Hi! My name is Zack! I’m a climate scientist looking to find the signal in all the noise. I use data-driven methods to untangle climate change patterns from natural variability, providing clearer insights into climate risks. I also spend a lot of time thinking about how to make science more engaging through storytelling and visualization.
United States Climate Indicators
U.S. Climate Indicators By Topic… [click on headings]
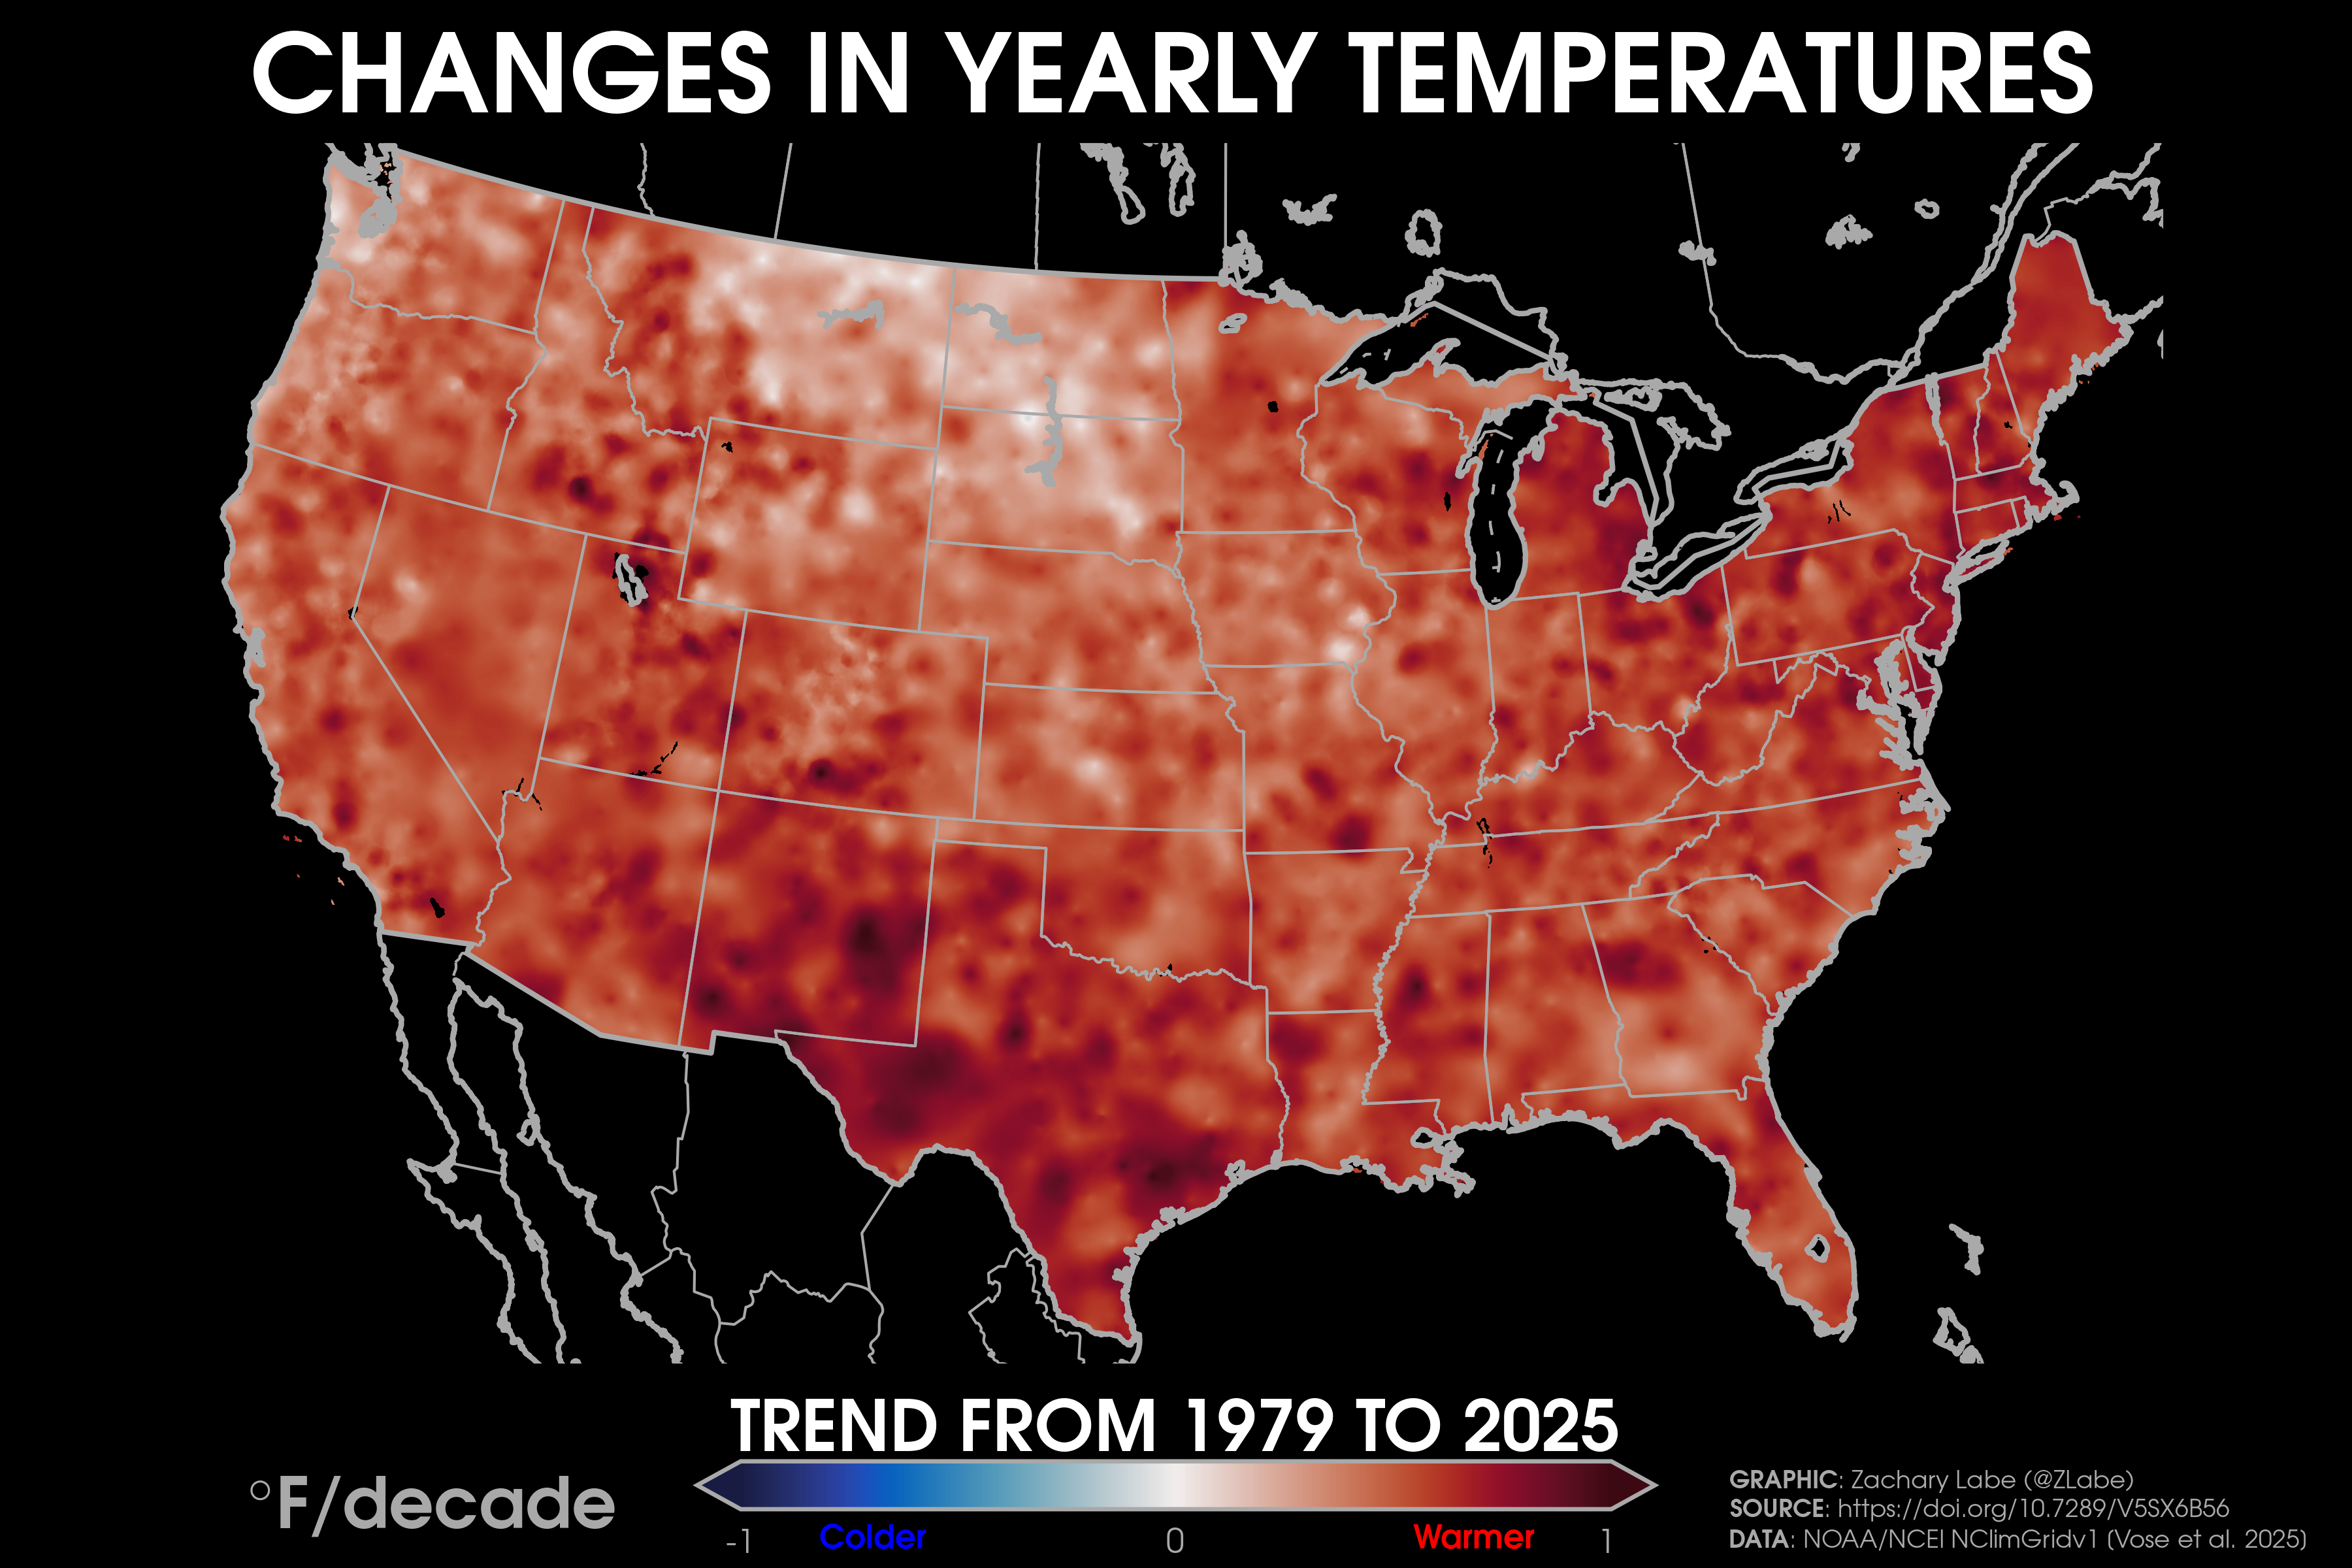
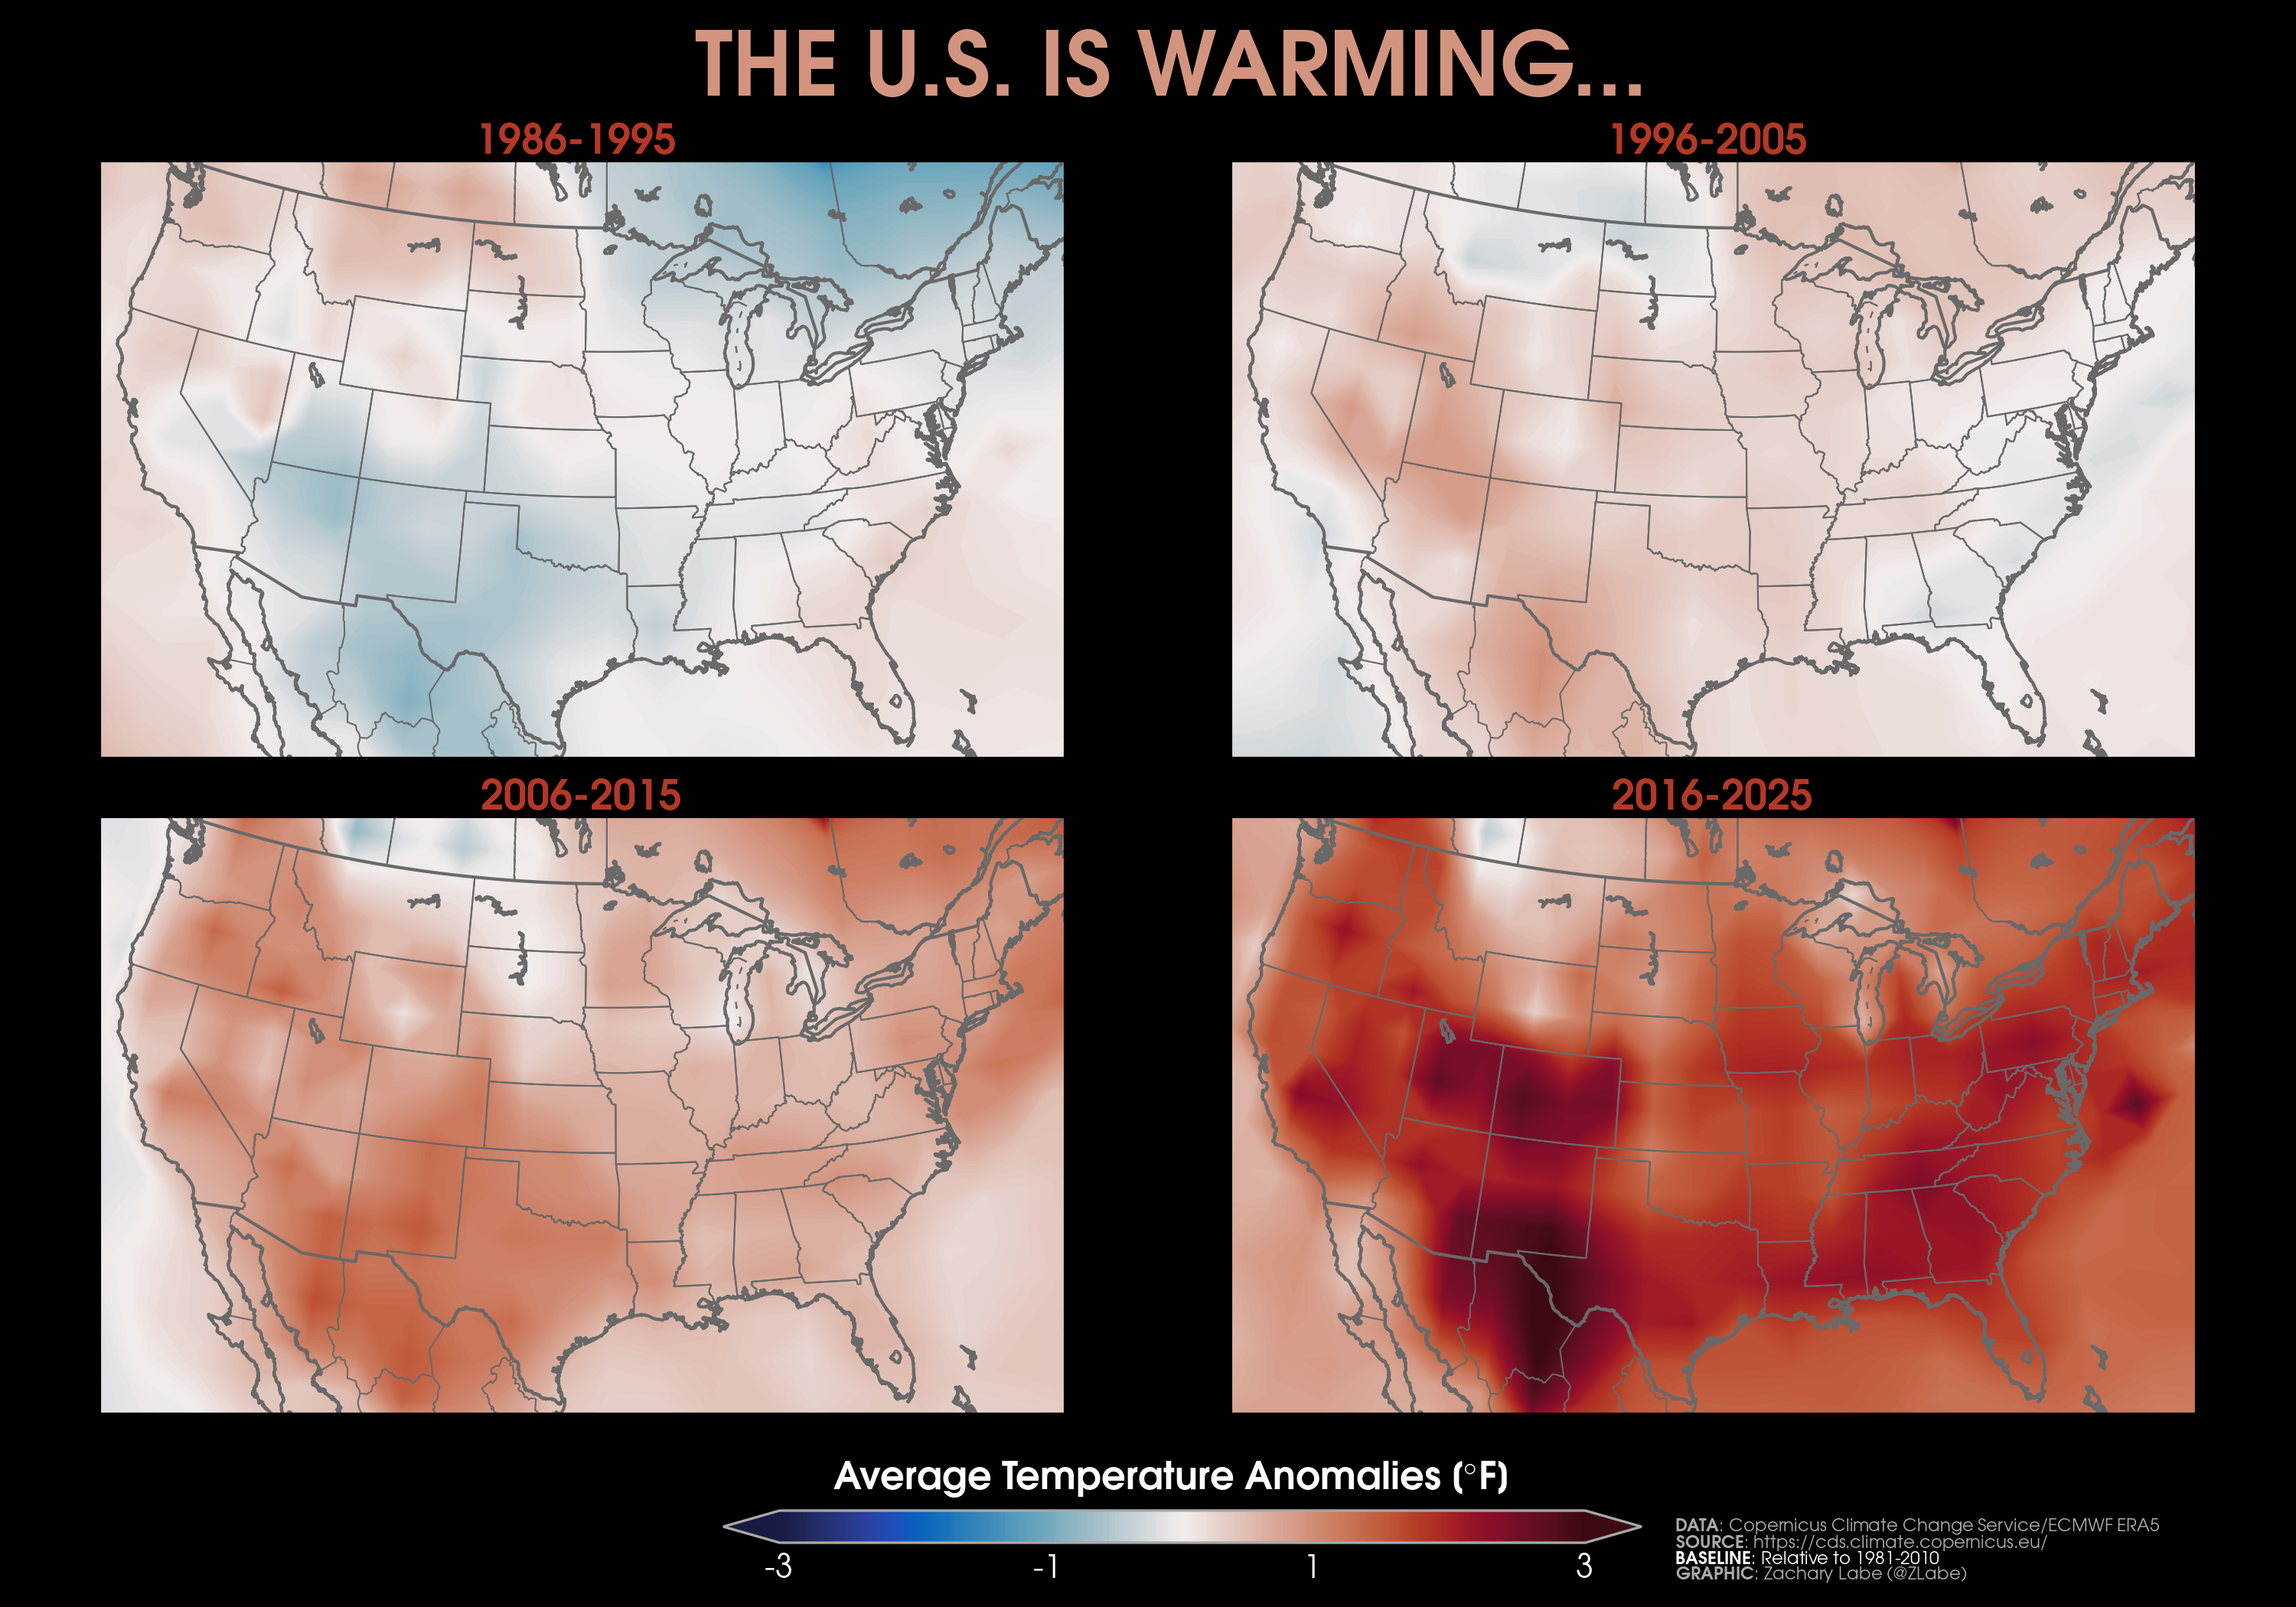
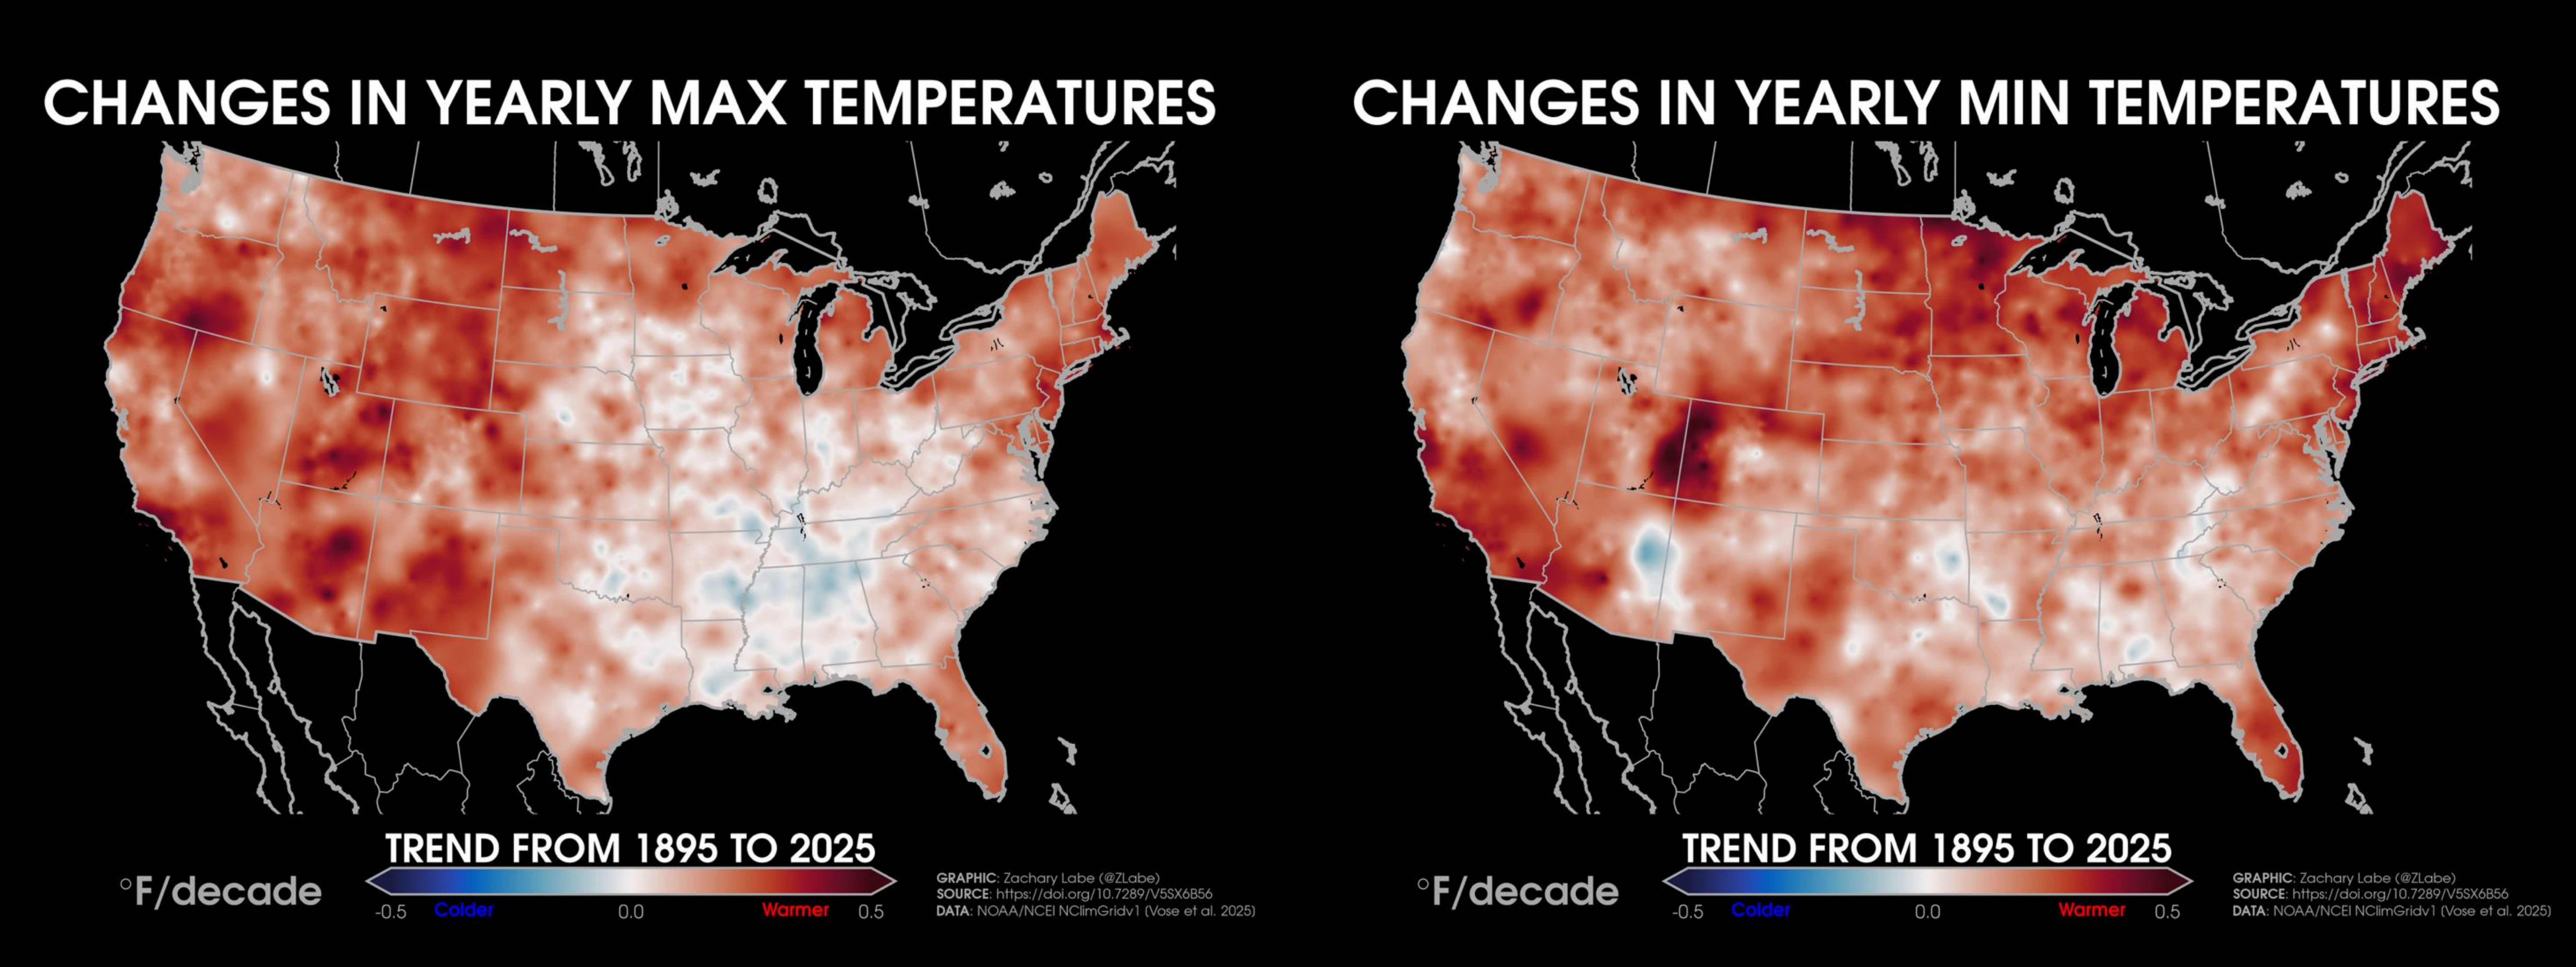
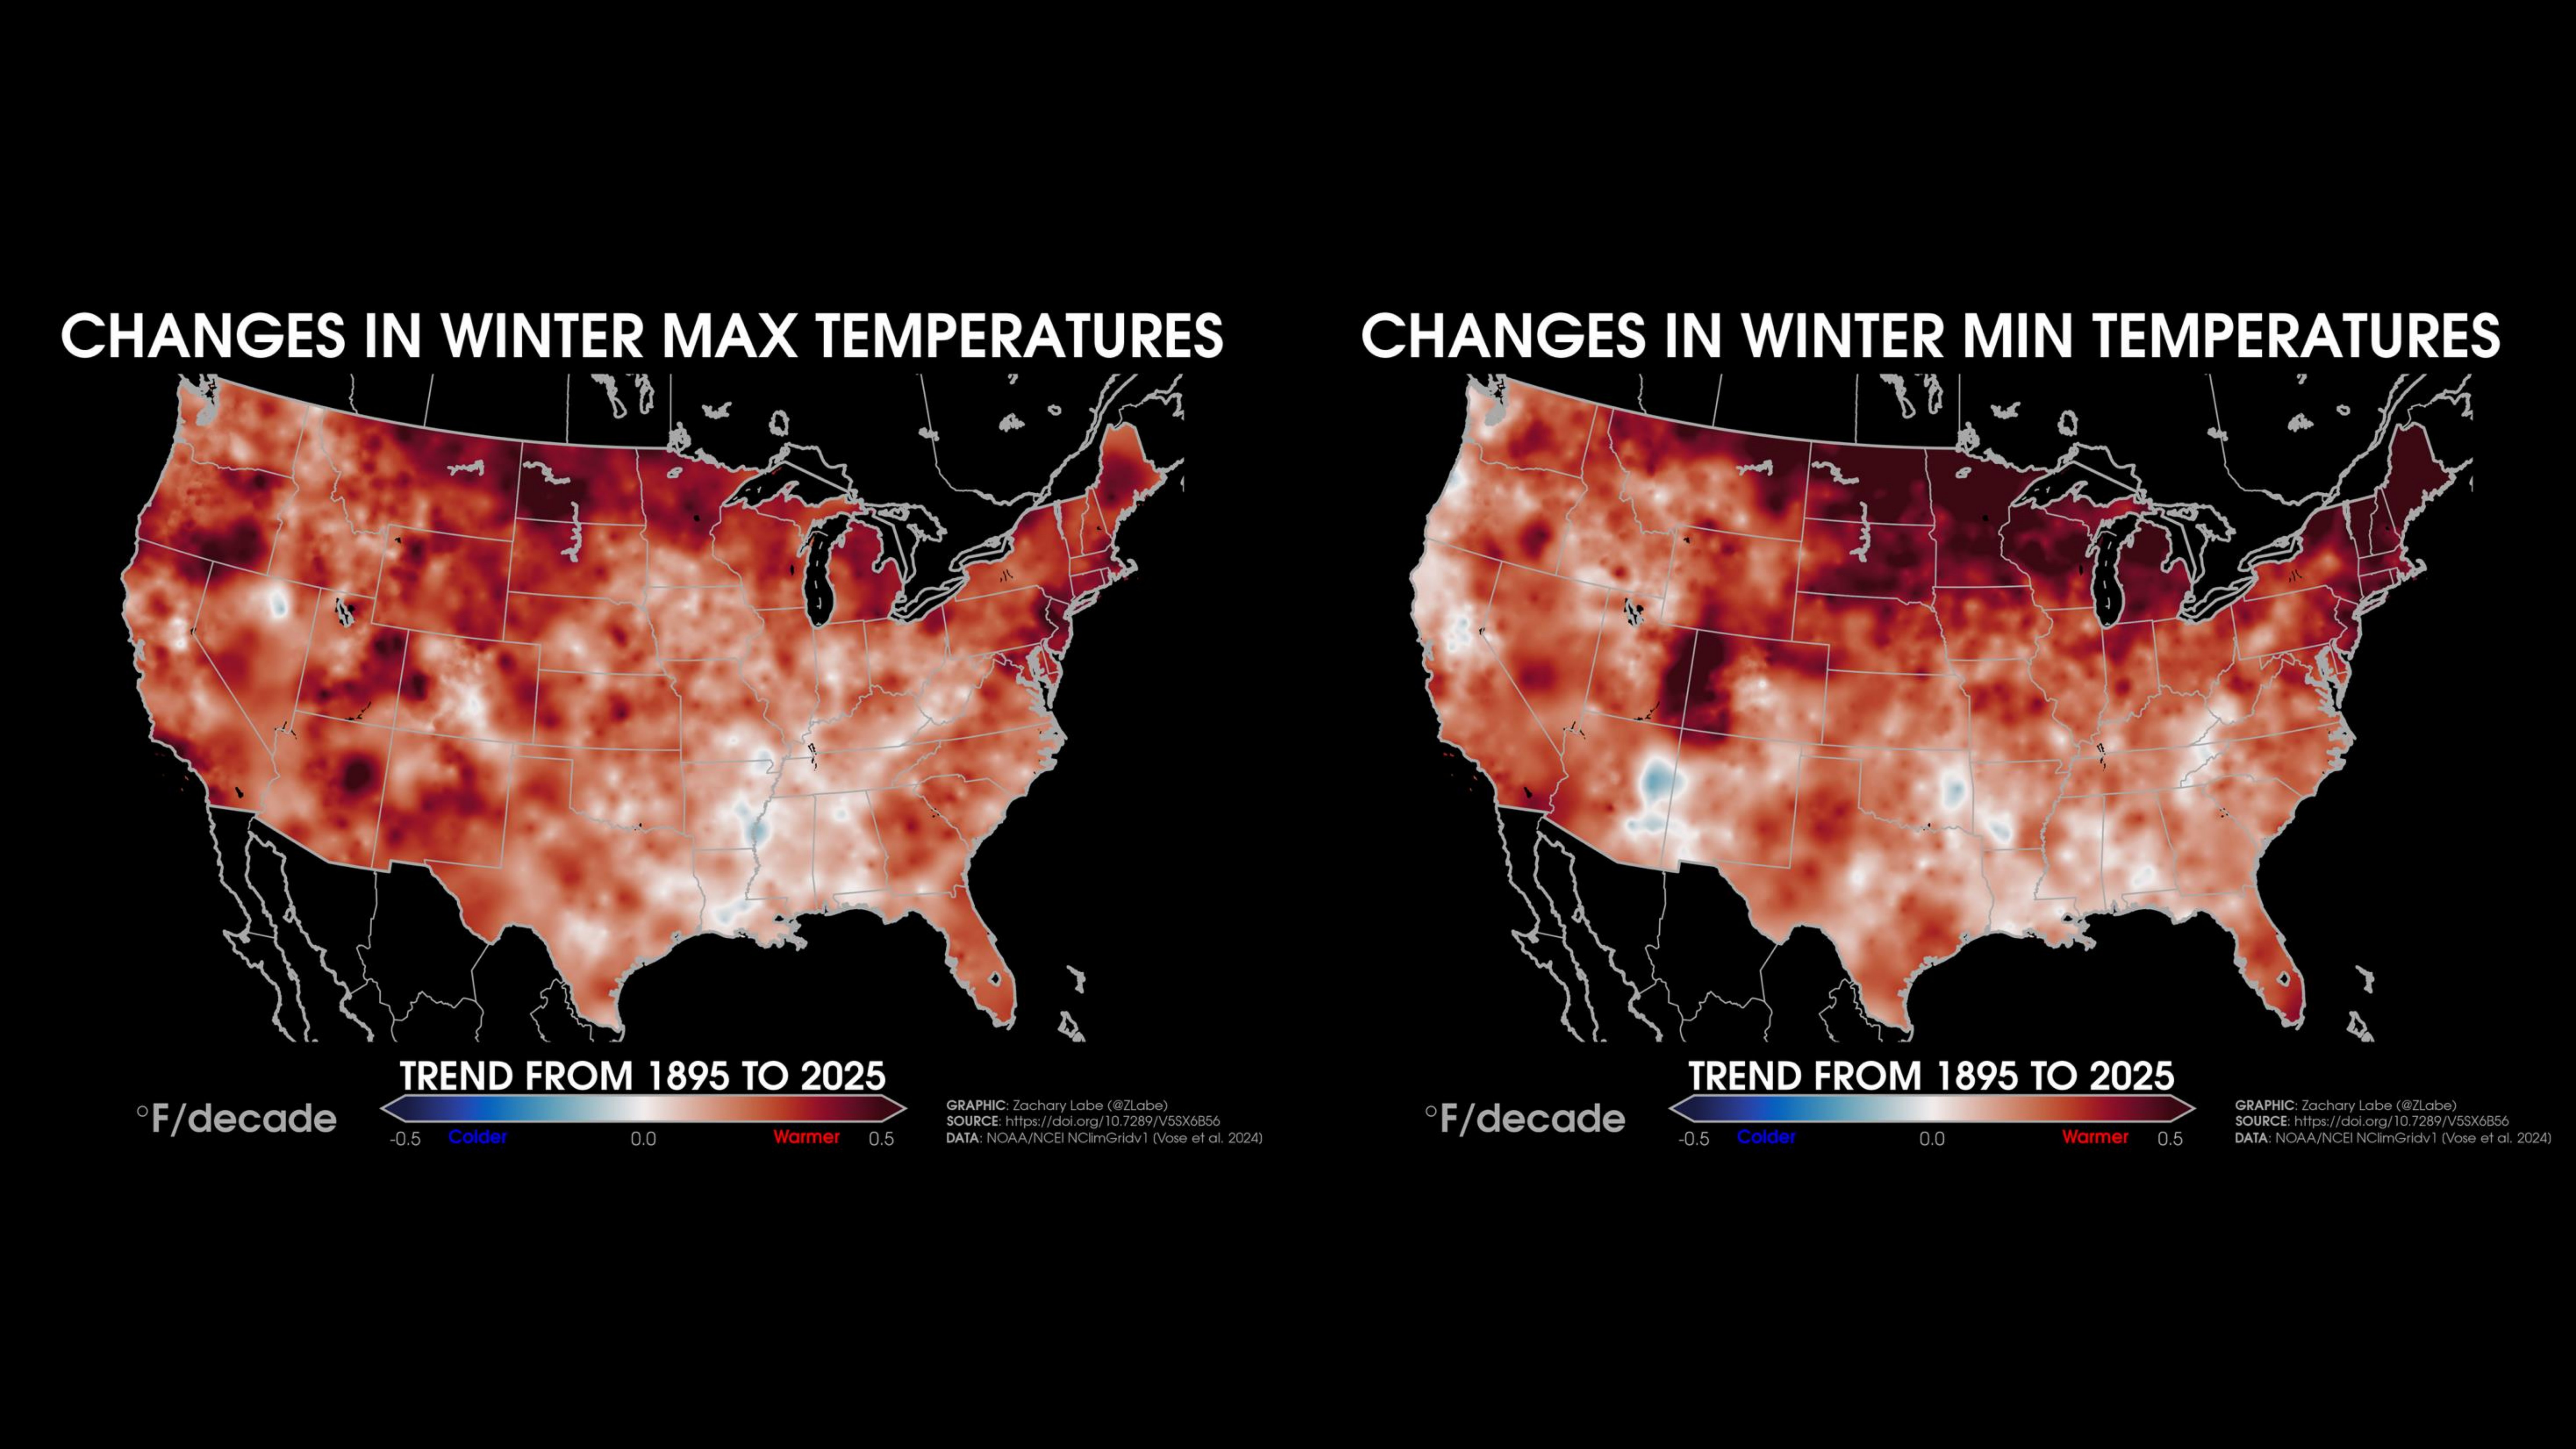
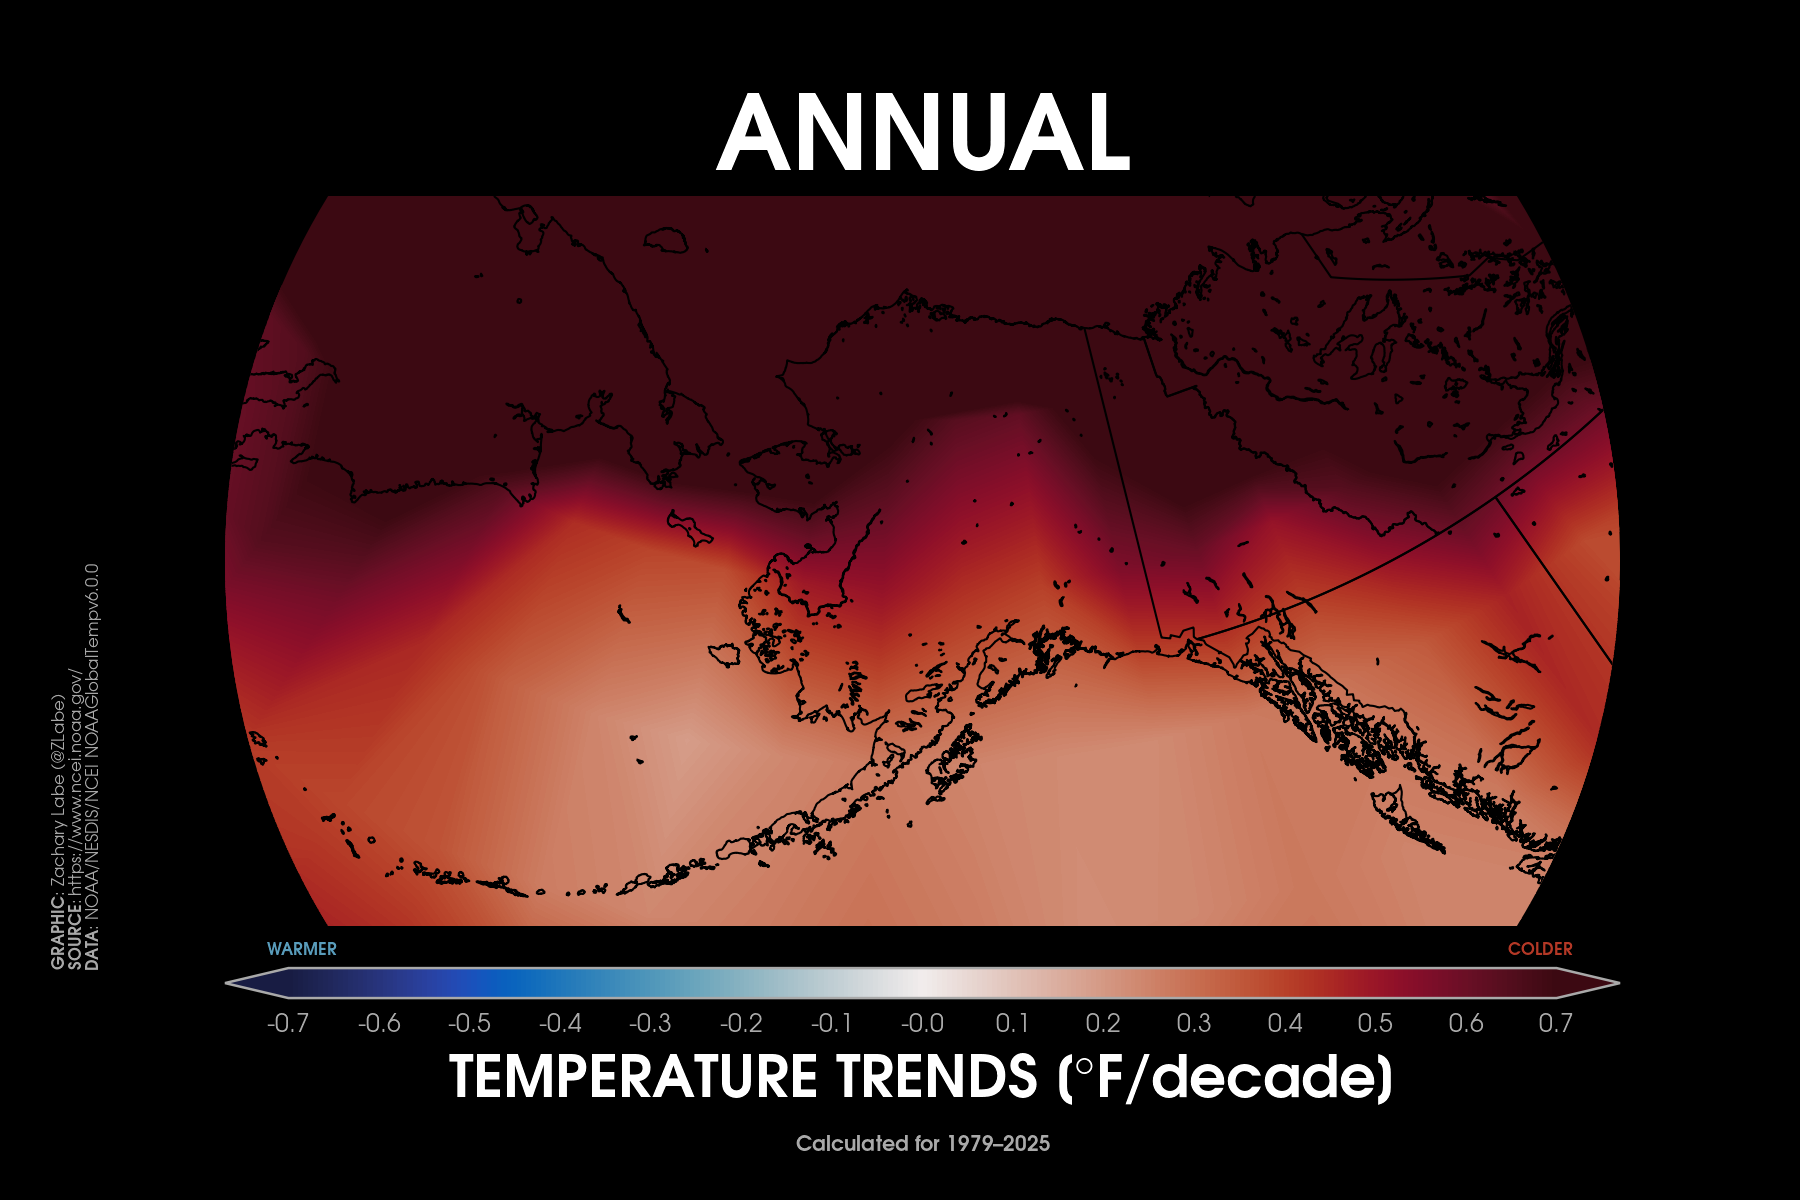
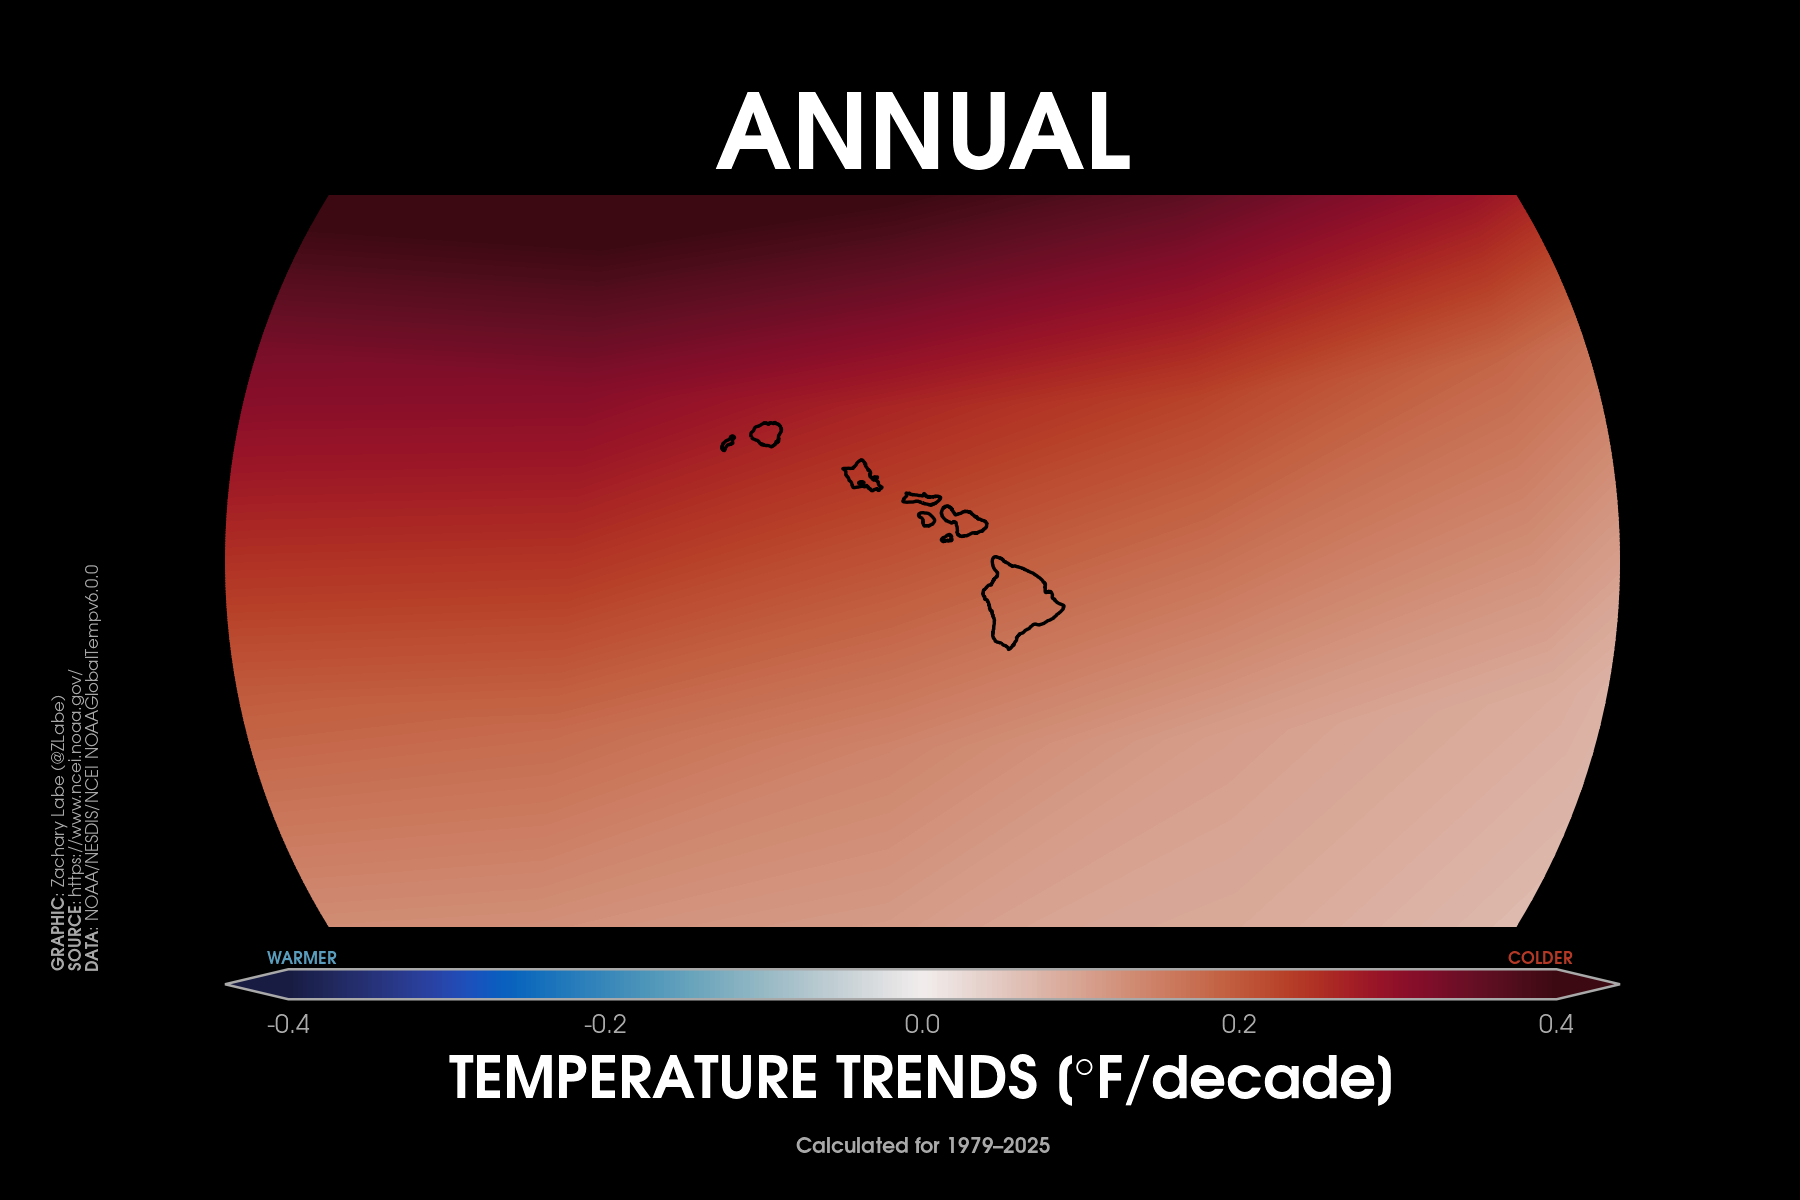
Temperature TrendsTrends (°F per decade) in annual mean surface air temperatures over the contiguous United States (CONUS) from 1979 to 2025. Data is provided by NOAA/NCEI NClimGrid (https://doi.org/10.7289/V5SX6B56). Graphic was updated on 1/17/2026.Animation of annual mean near-surface temperature anomalies across the contiguous United States (CONUS) for each year from 1940 to 2025. Data is from ERA5 (https://cds.climate.copernicus.eu/datasets). Anomalies are calculated relative to a 1951 to 1980 climate baseline. Graphic was updated on 2/8/2026.Temperature anomalies averaged for each decade since 1986 across the contiguous United States region. Anomalies are computed relative to a 1981-2010 climate reference period. Data is from ERA5 reanalysis (https://doi.org/10.24381/cds.f17050d7). Graphic was updated on 2/8/2026.Trends (°F per decade) in annual mean “maximum” (left; MAX) surface air temperatures and annual mean “minimum” (right; MIN) surface air temperatures over the contiguous United States (CONUS) from 1895 to 2025. Data is provided by NOAA/NCEI NClimGrid (https://doi.org/10.7289/V5SX6B56). Graphic was updated on 1/18/2026.Trends (°F per decade) in summer (June-July-August) “maximum” (left; MAX) surface air temperatures and summer mean “minimum” (right; MIN) surface air temperatures over the contiguous United States (CONUS) from 1895 to 2025. Data is provided by NOAA/NCEI NClimGrid (https://doi.org/10.7289/V5SX6B56). Graphic was updated on 1/18/2026.Trends (°F per decade) in winter (December-January-February) “maximum” (left; MAX) surface air temperatures and winter mean “minimum” (right; MIN) surface air temperatures over the contiguous United States (CONUS) from 1895 to 2025. Data is provided by NOAA/NCEI NClimGrid (https://doi.org/10.7289/V5SX6B56). Graphic was updated on 1/19/2026.Decadal trends in annual mean surface air temperatures over the region of Alaska from 1979 to 2025. Data are from NOAAGlobalTemp v6.0.0 (https://www.ncei.noaa.gov/products/land-based-station/noaa-global-temp). Graphic was updated on 2/8/2026.Decadal trends in annual mean surface air temperatures around Hawaii from 1979 to 2025. Data are from NOAAGlobalTemp v6.0.0 (https://www.ncei.noaa.gov/products/land-based-station/noaa-global-temp). Graphic was updated on 2/8/2026.
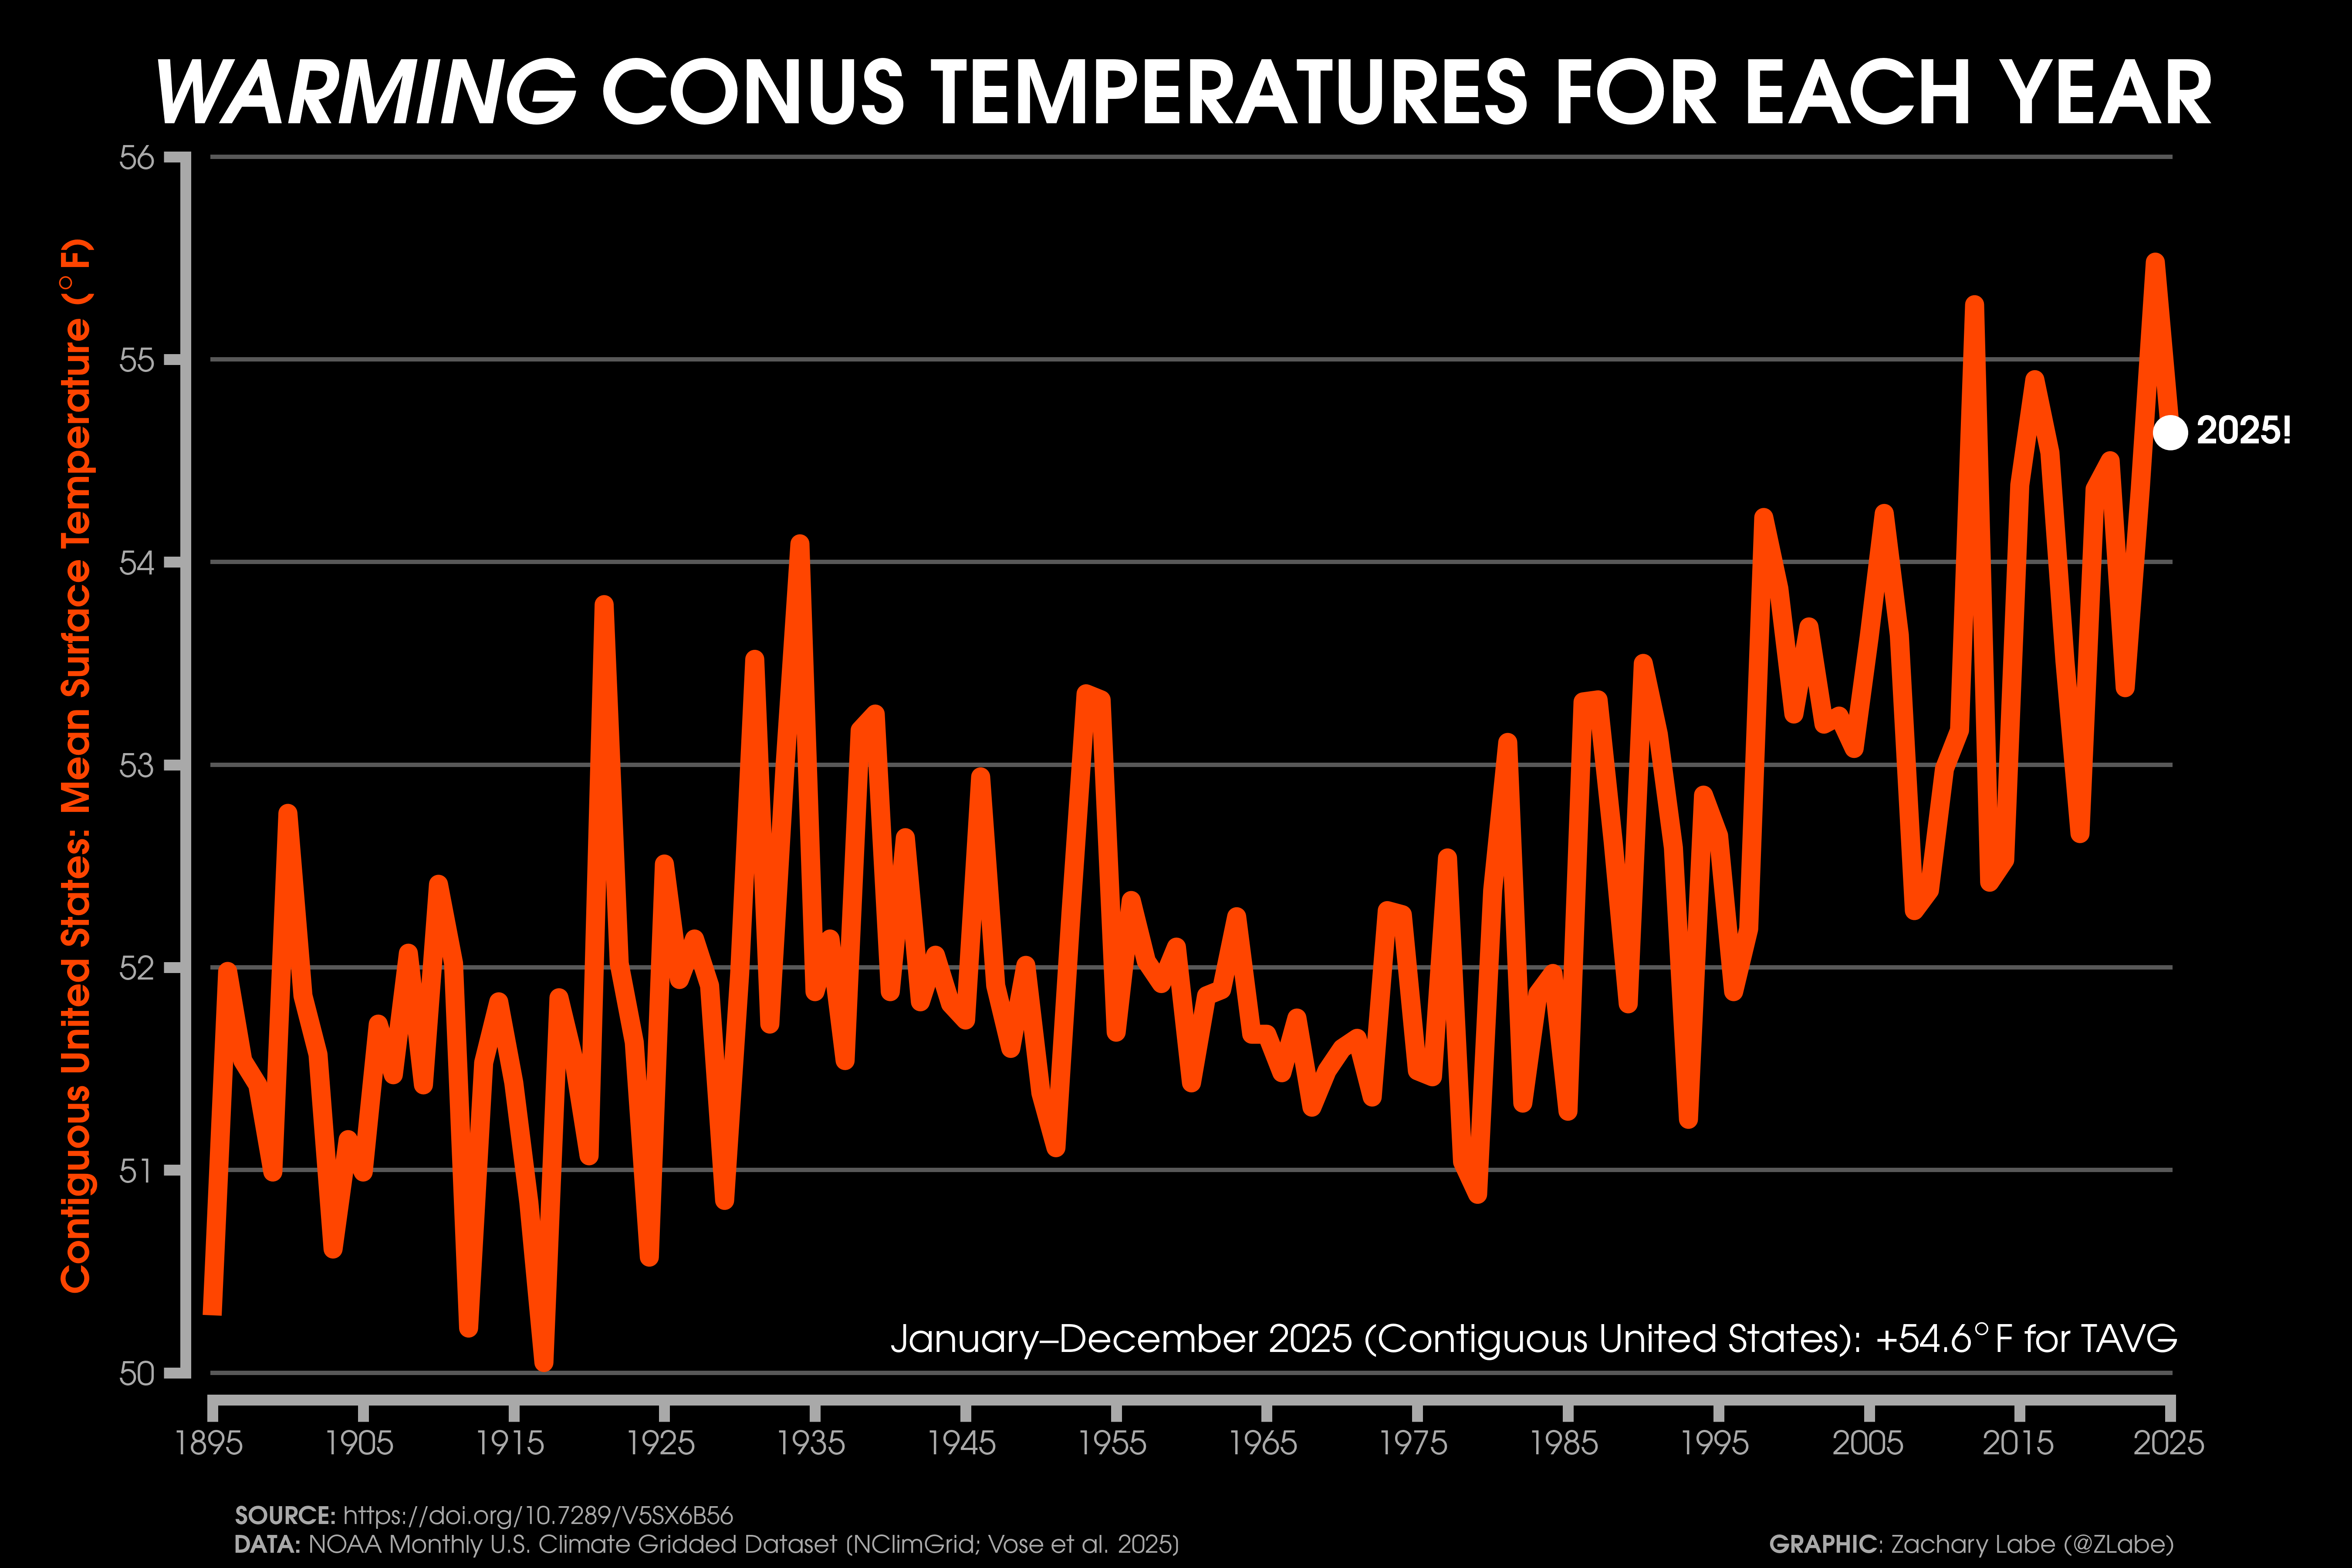
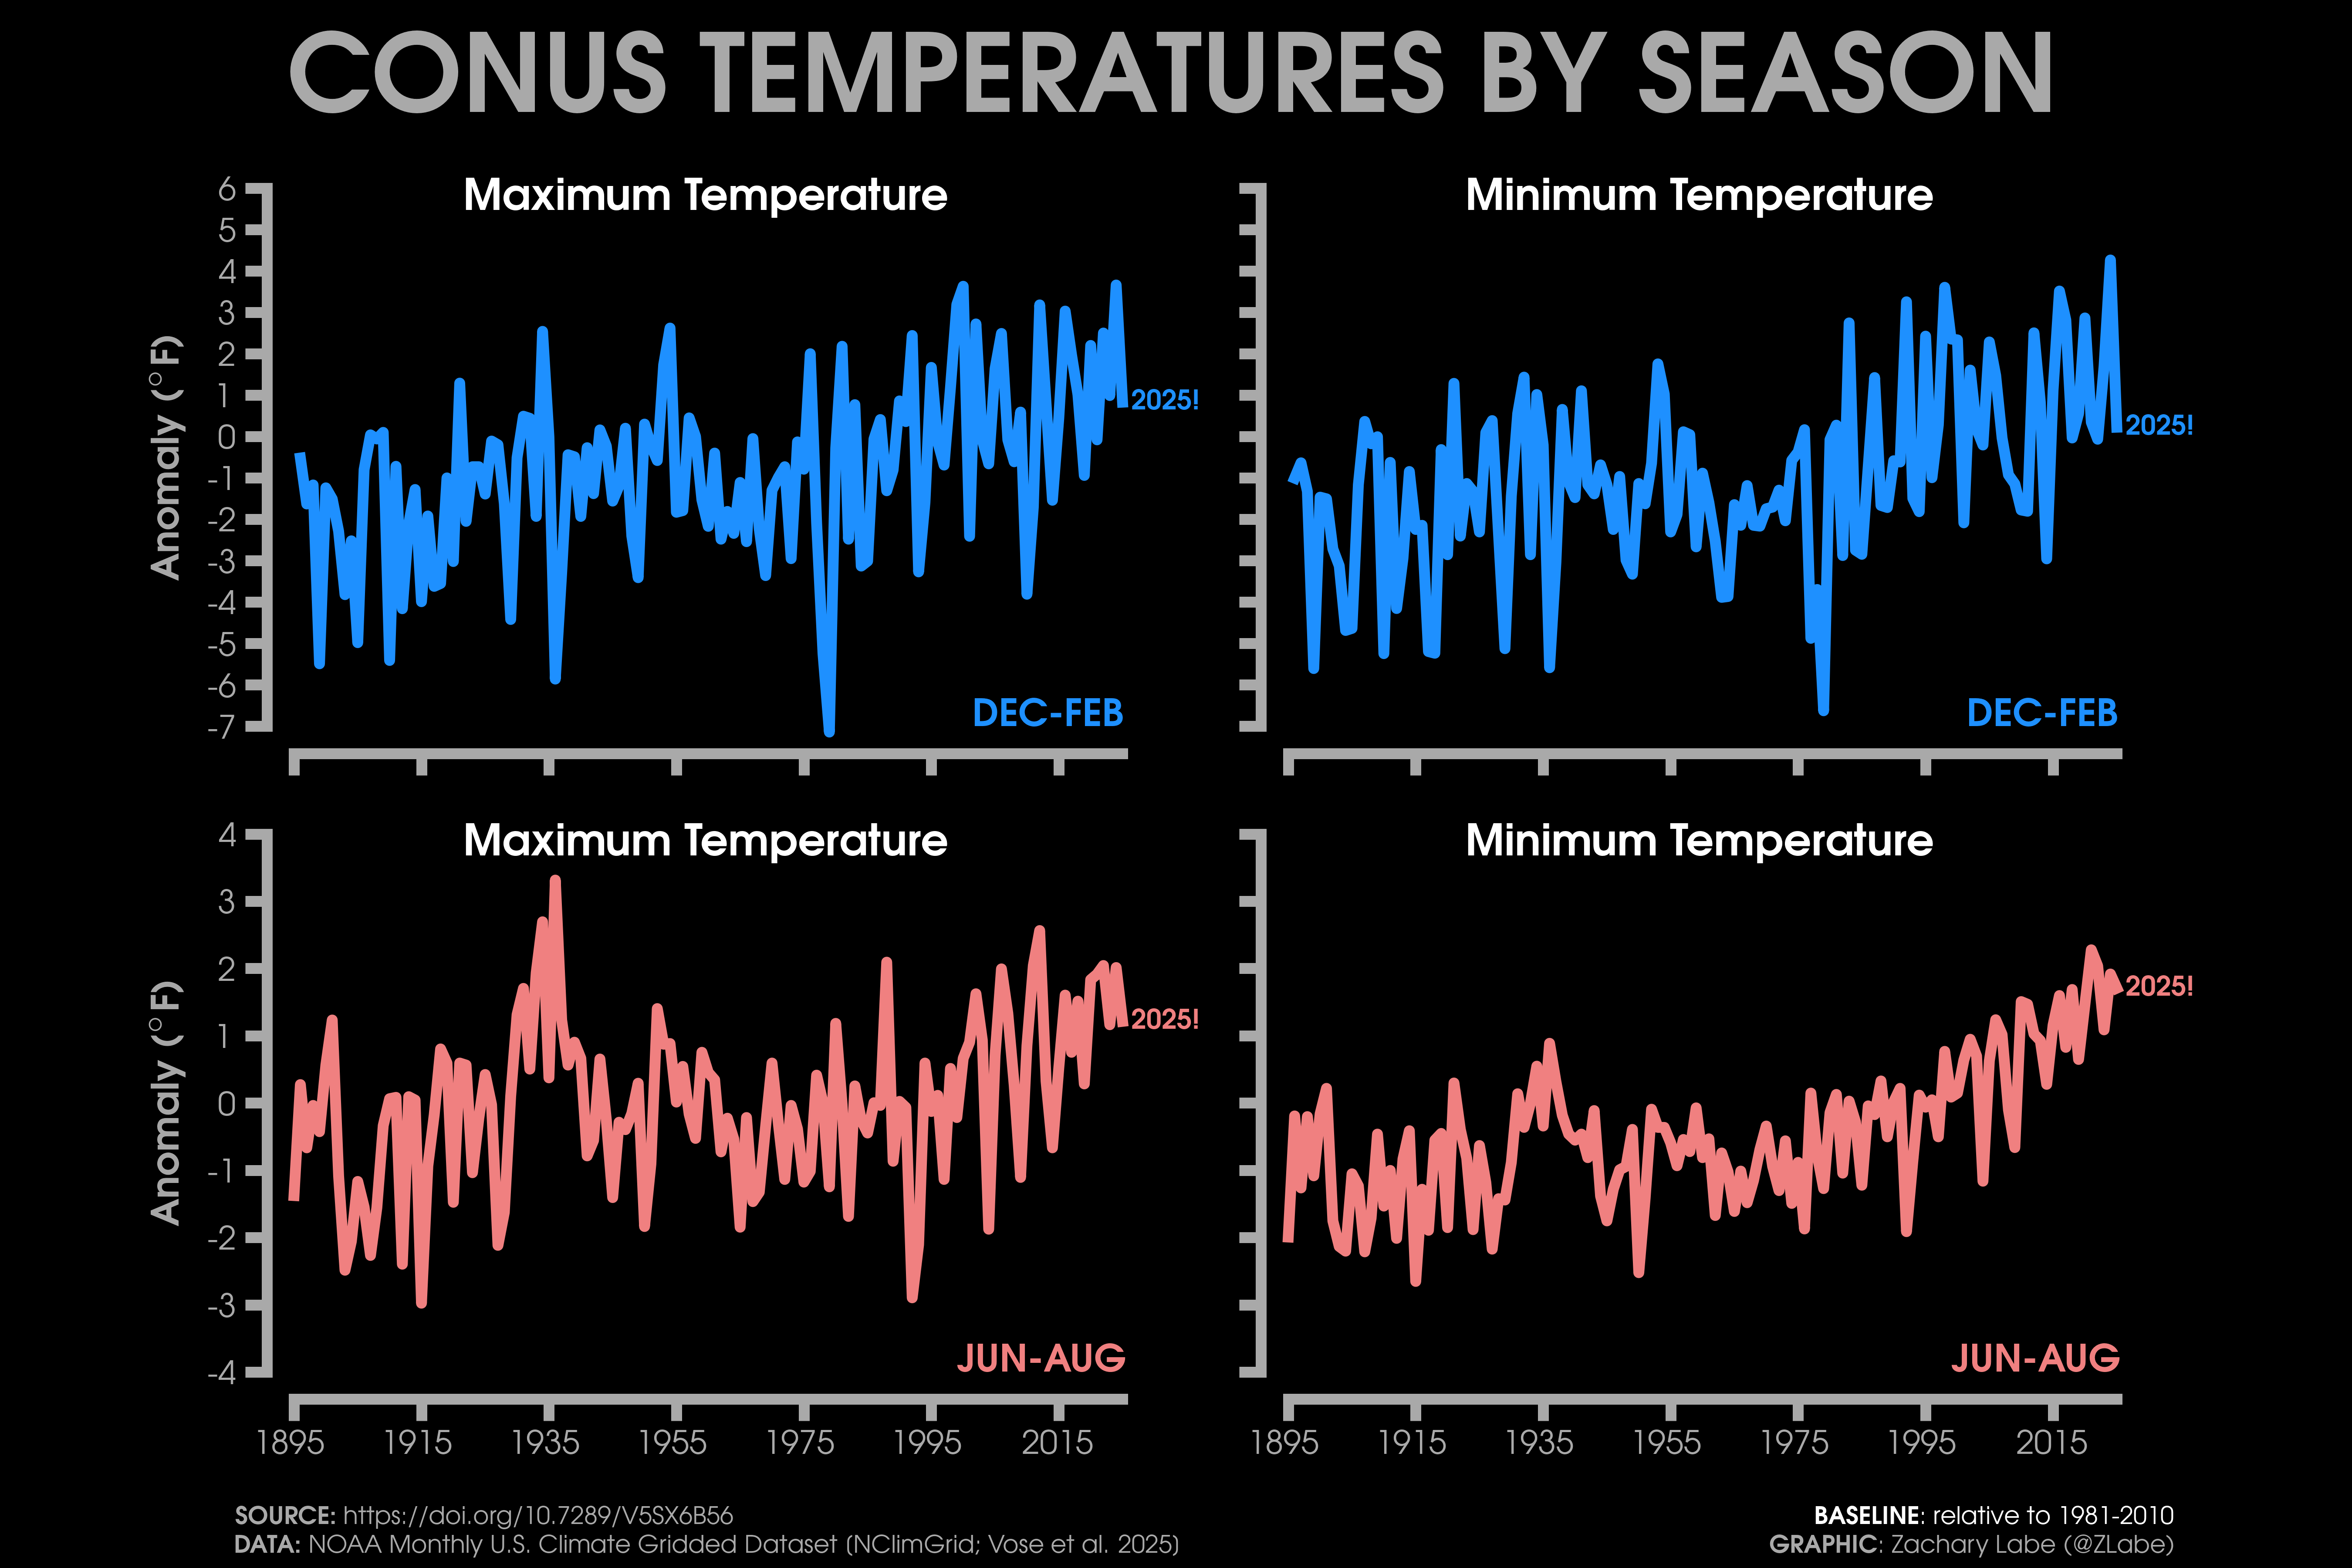
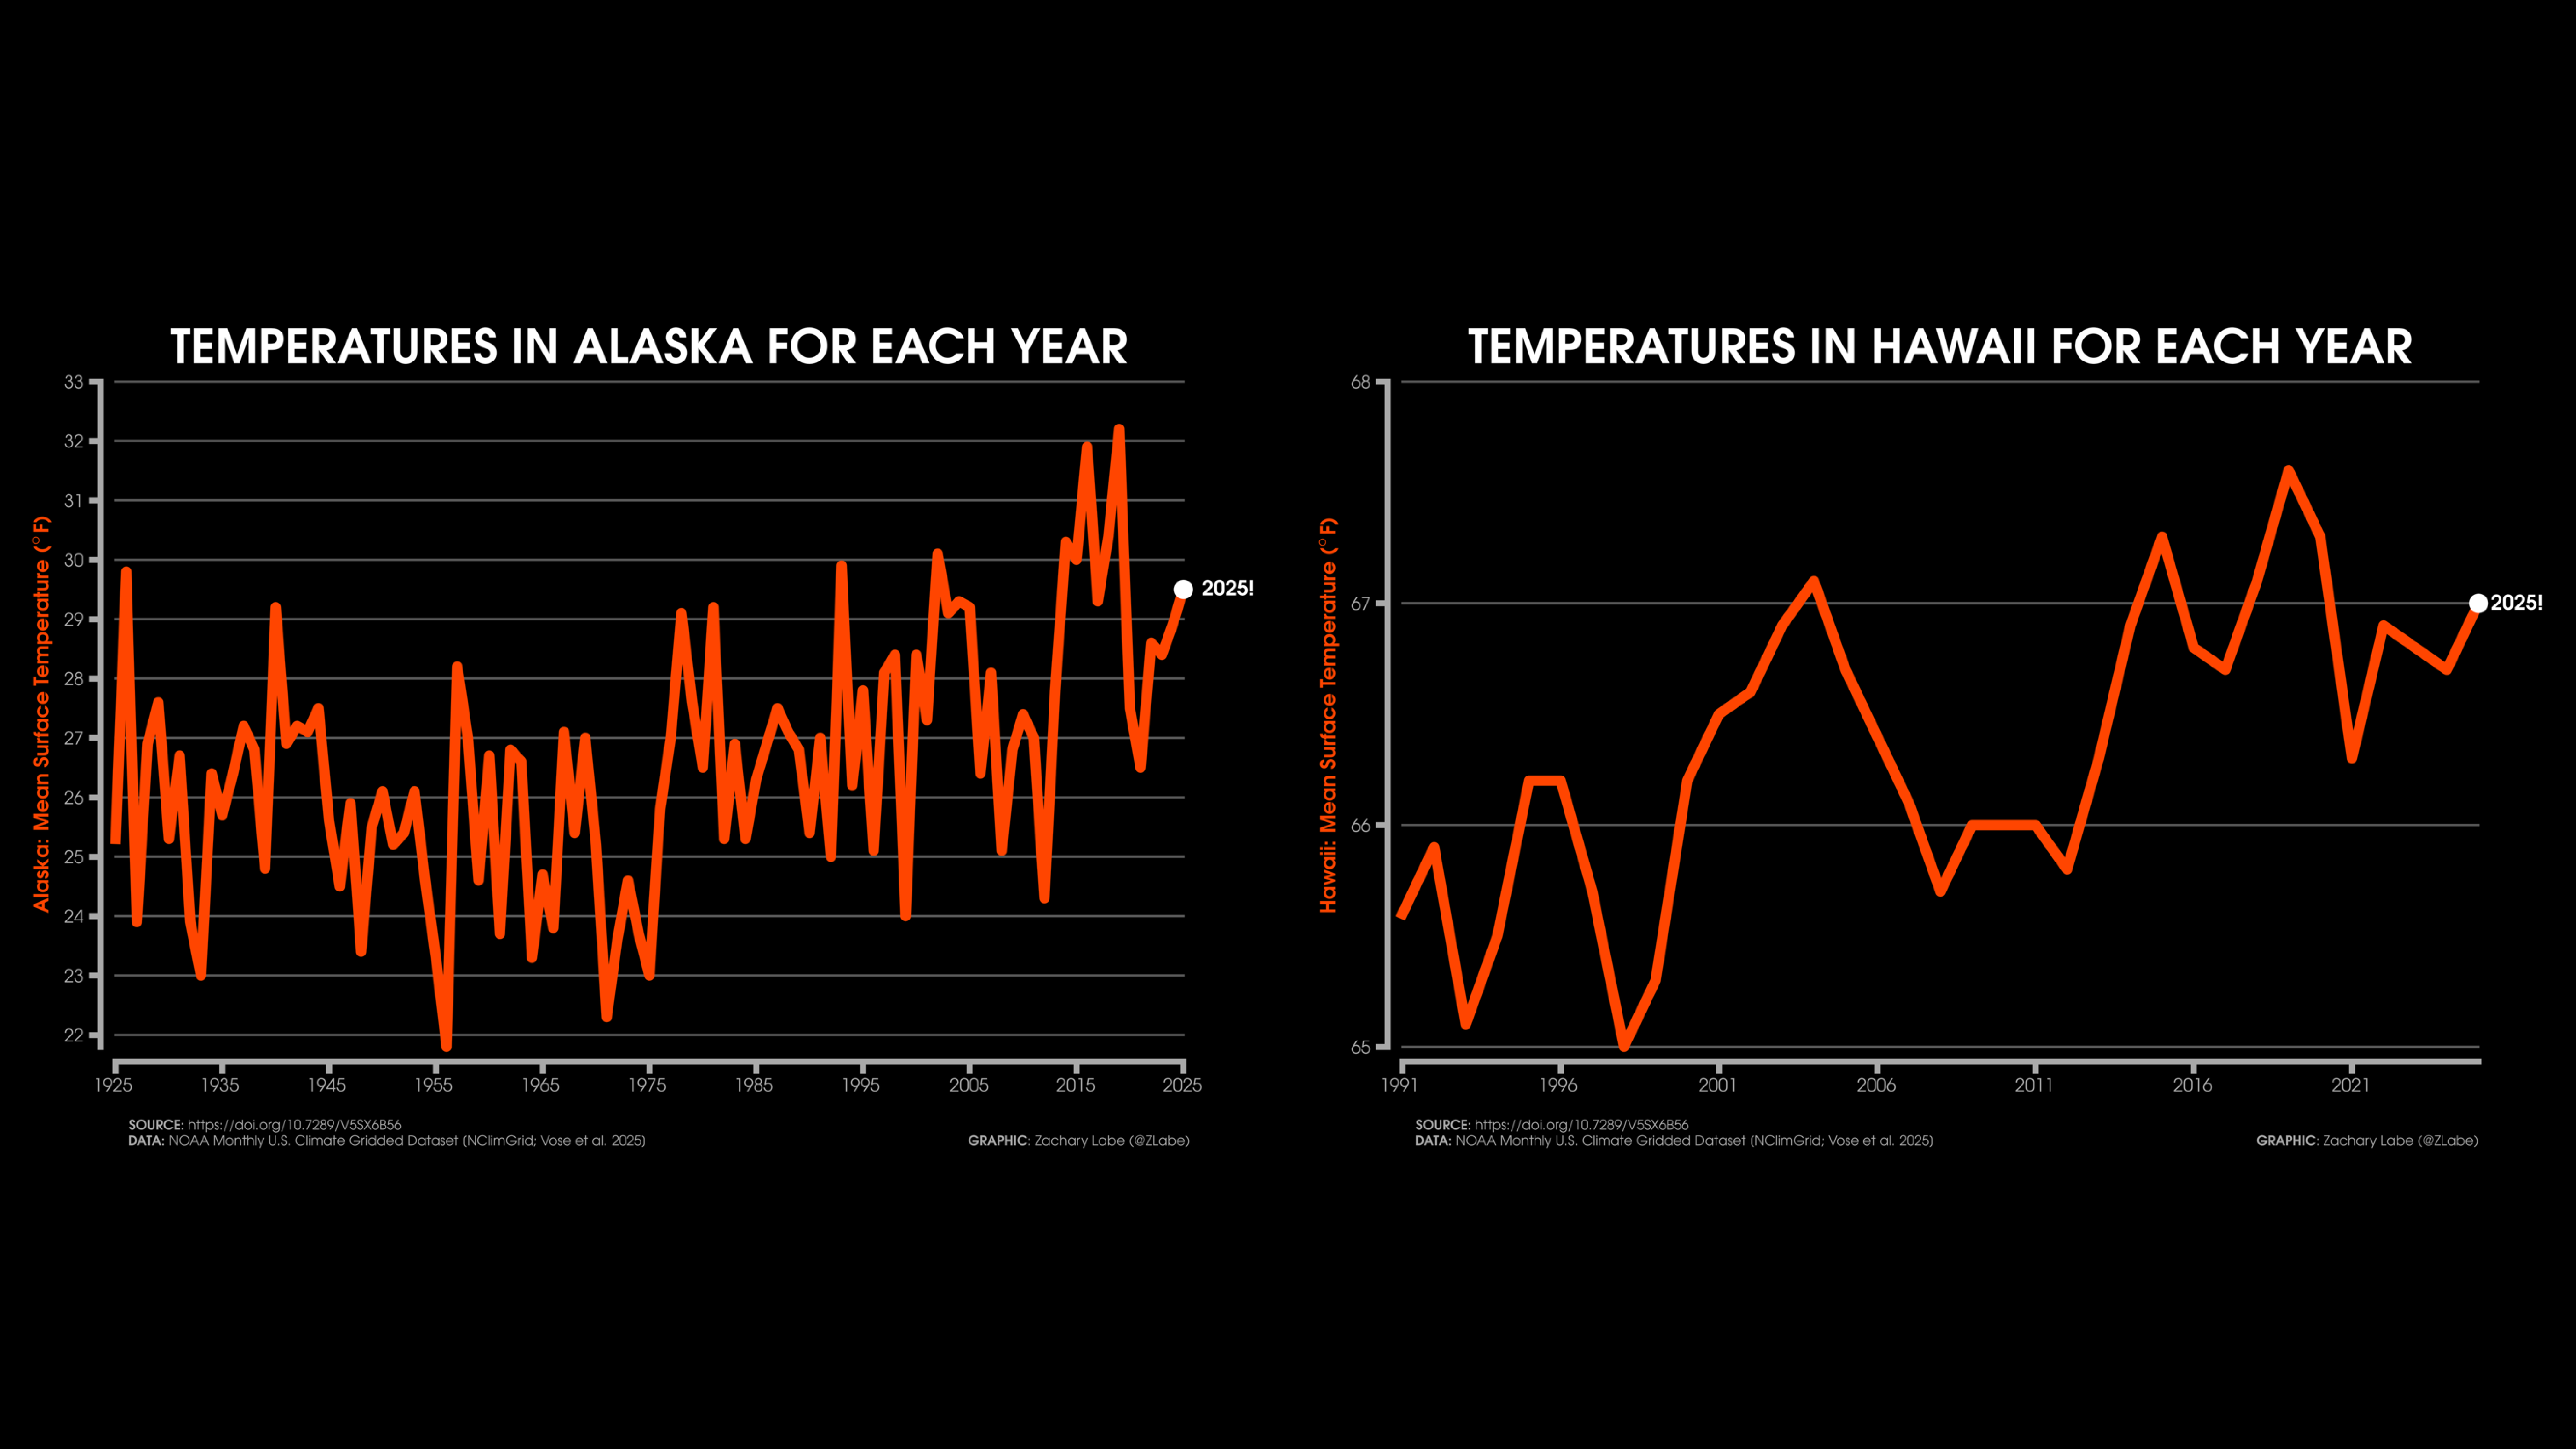
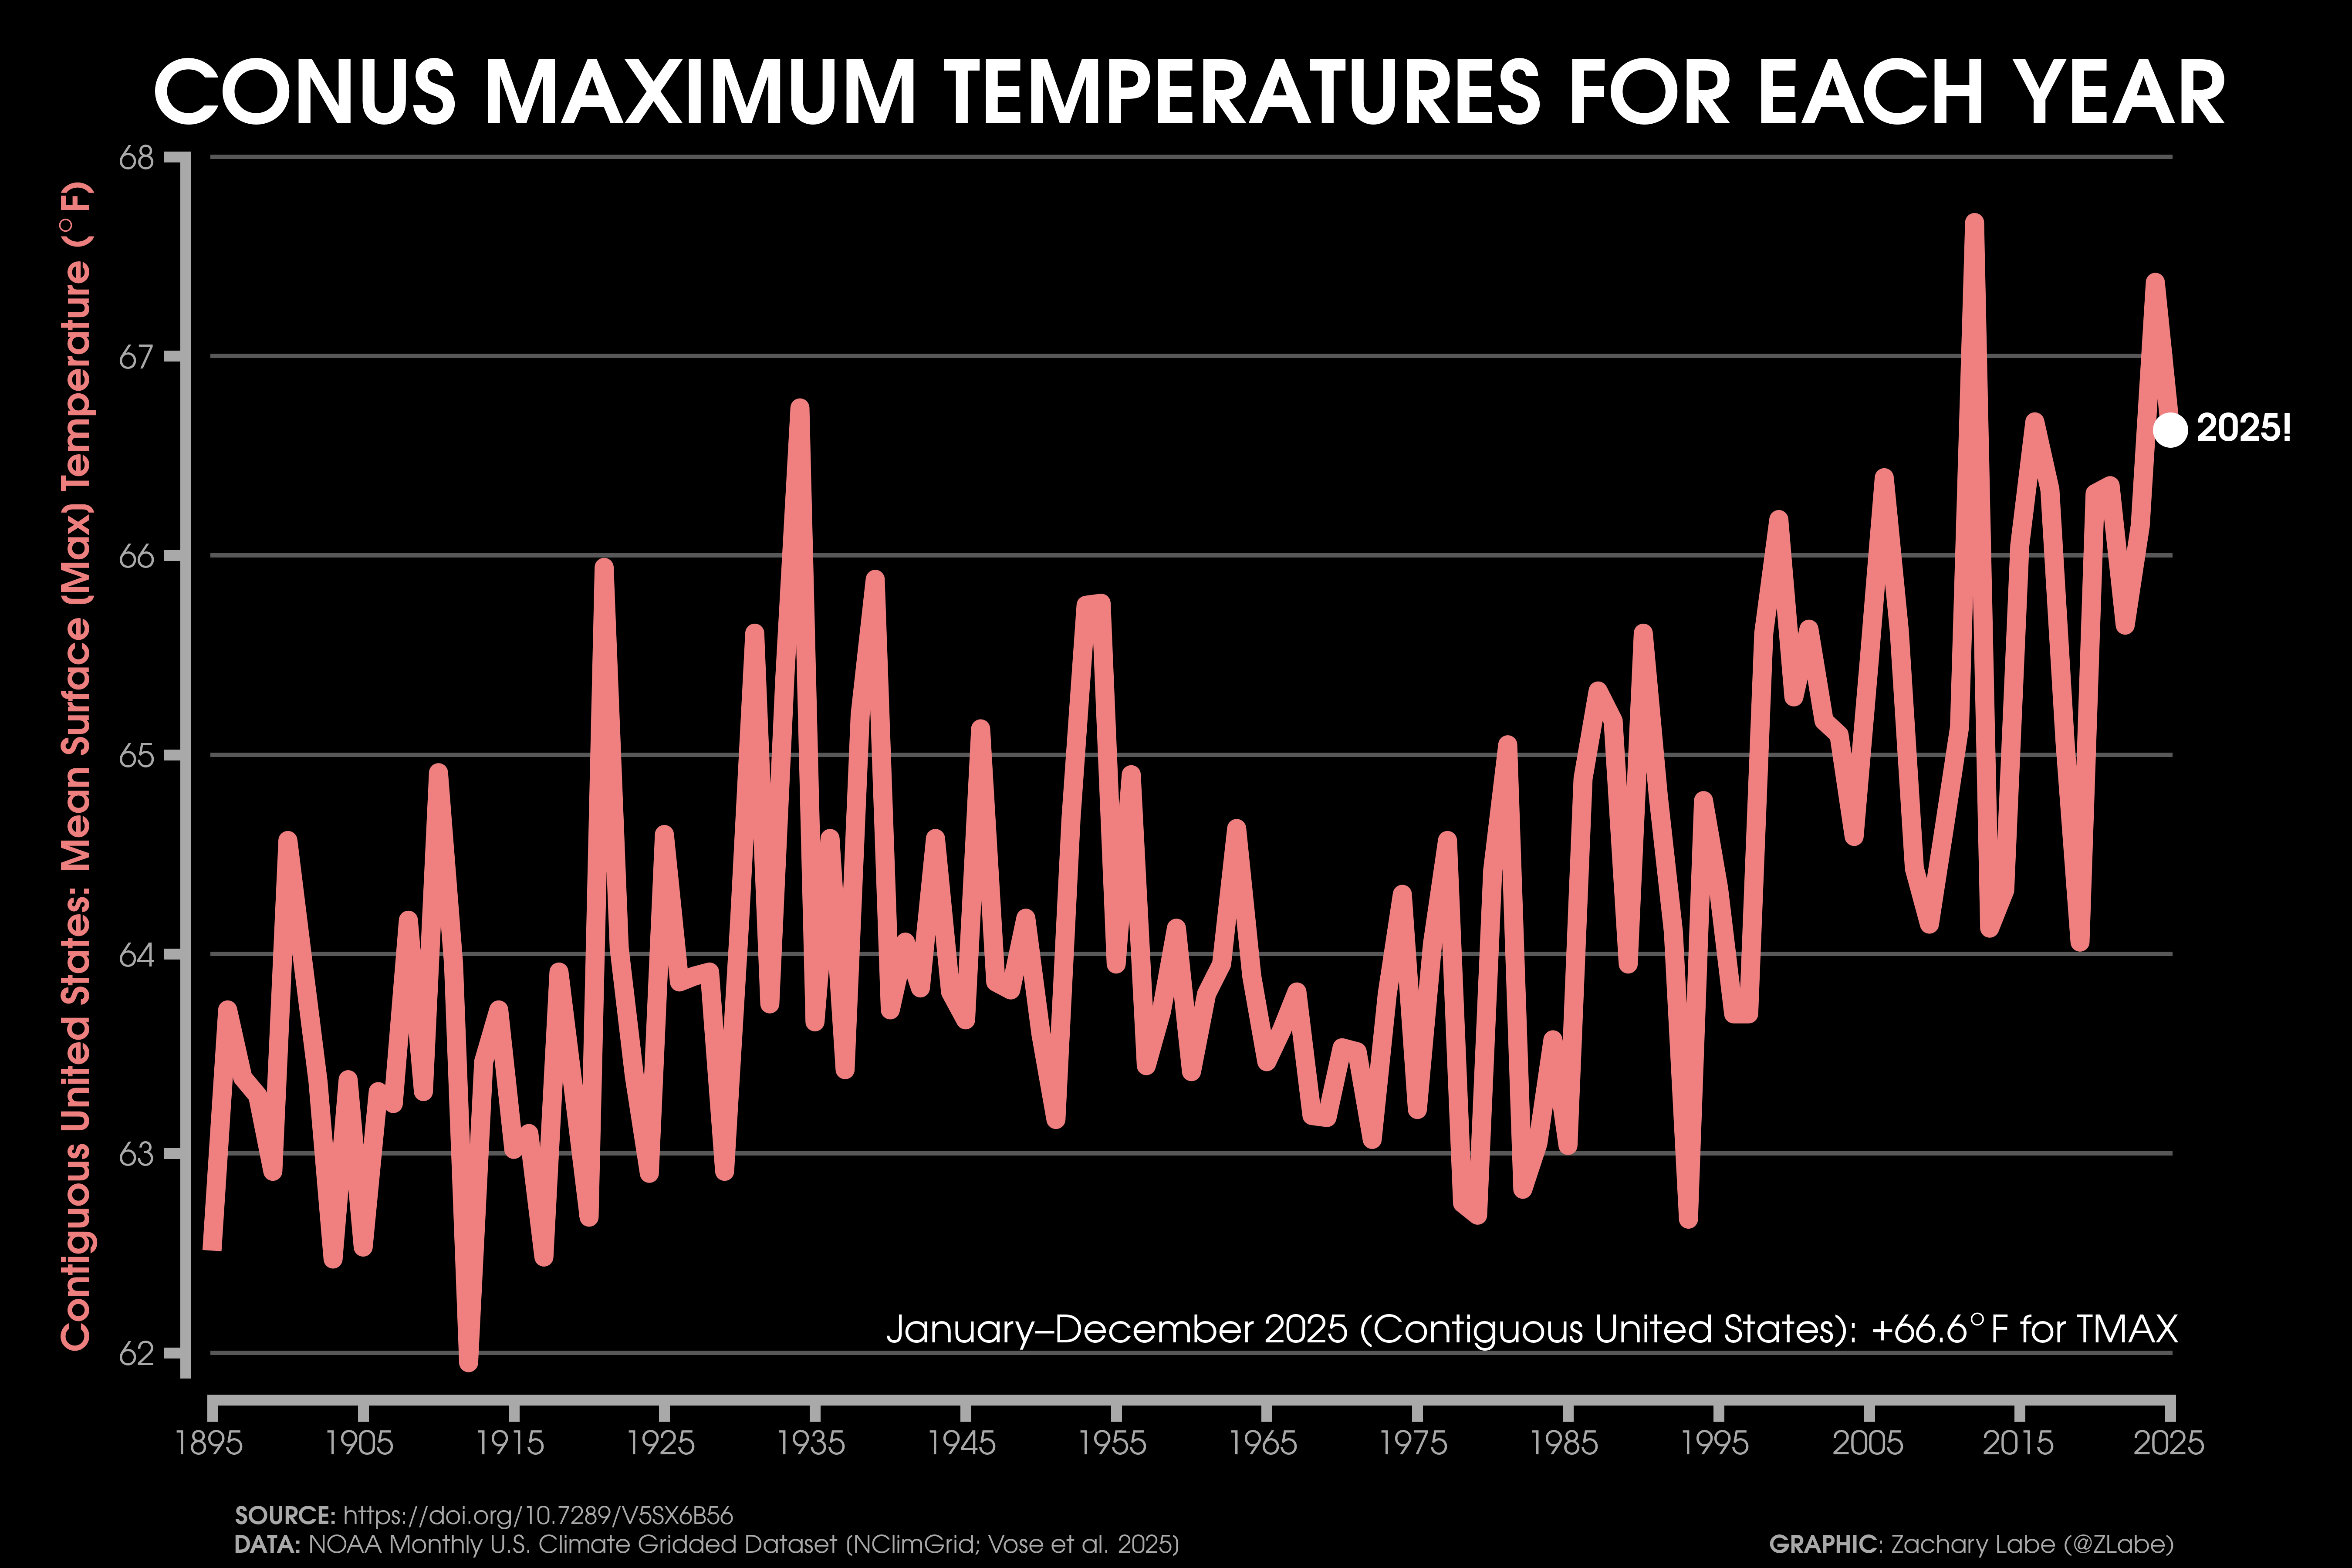
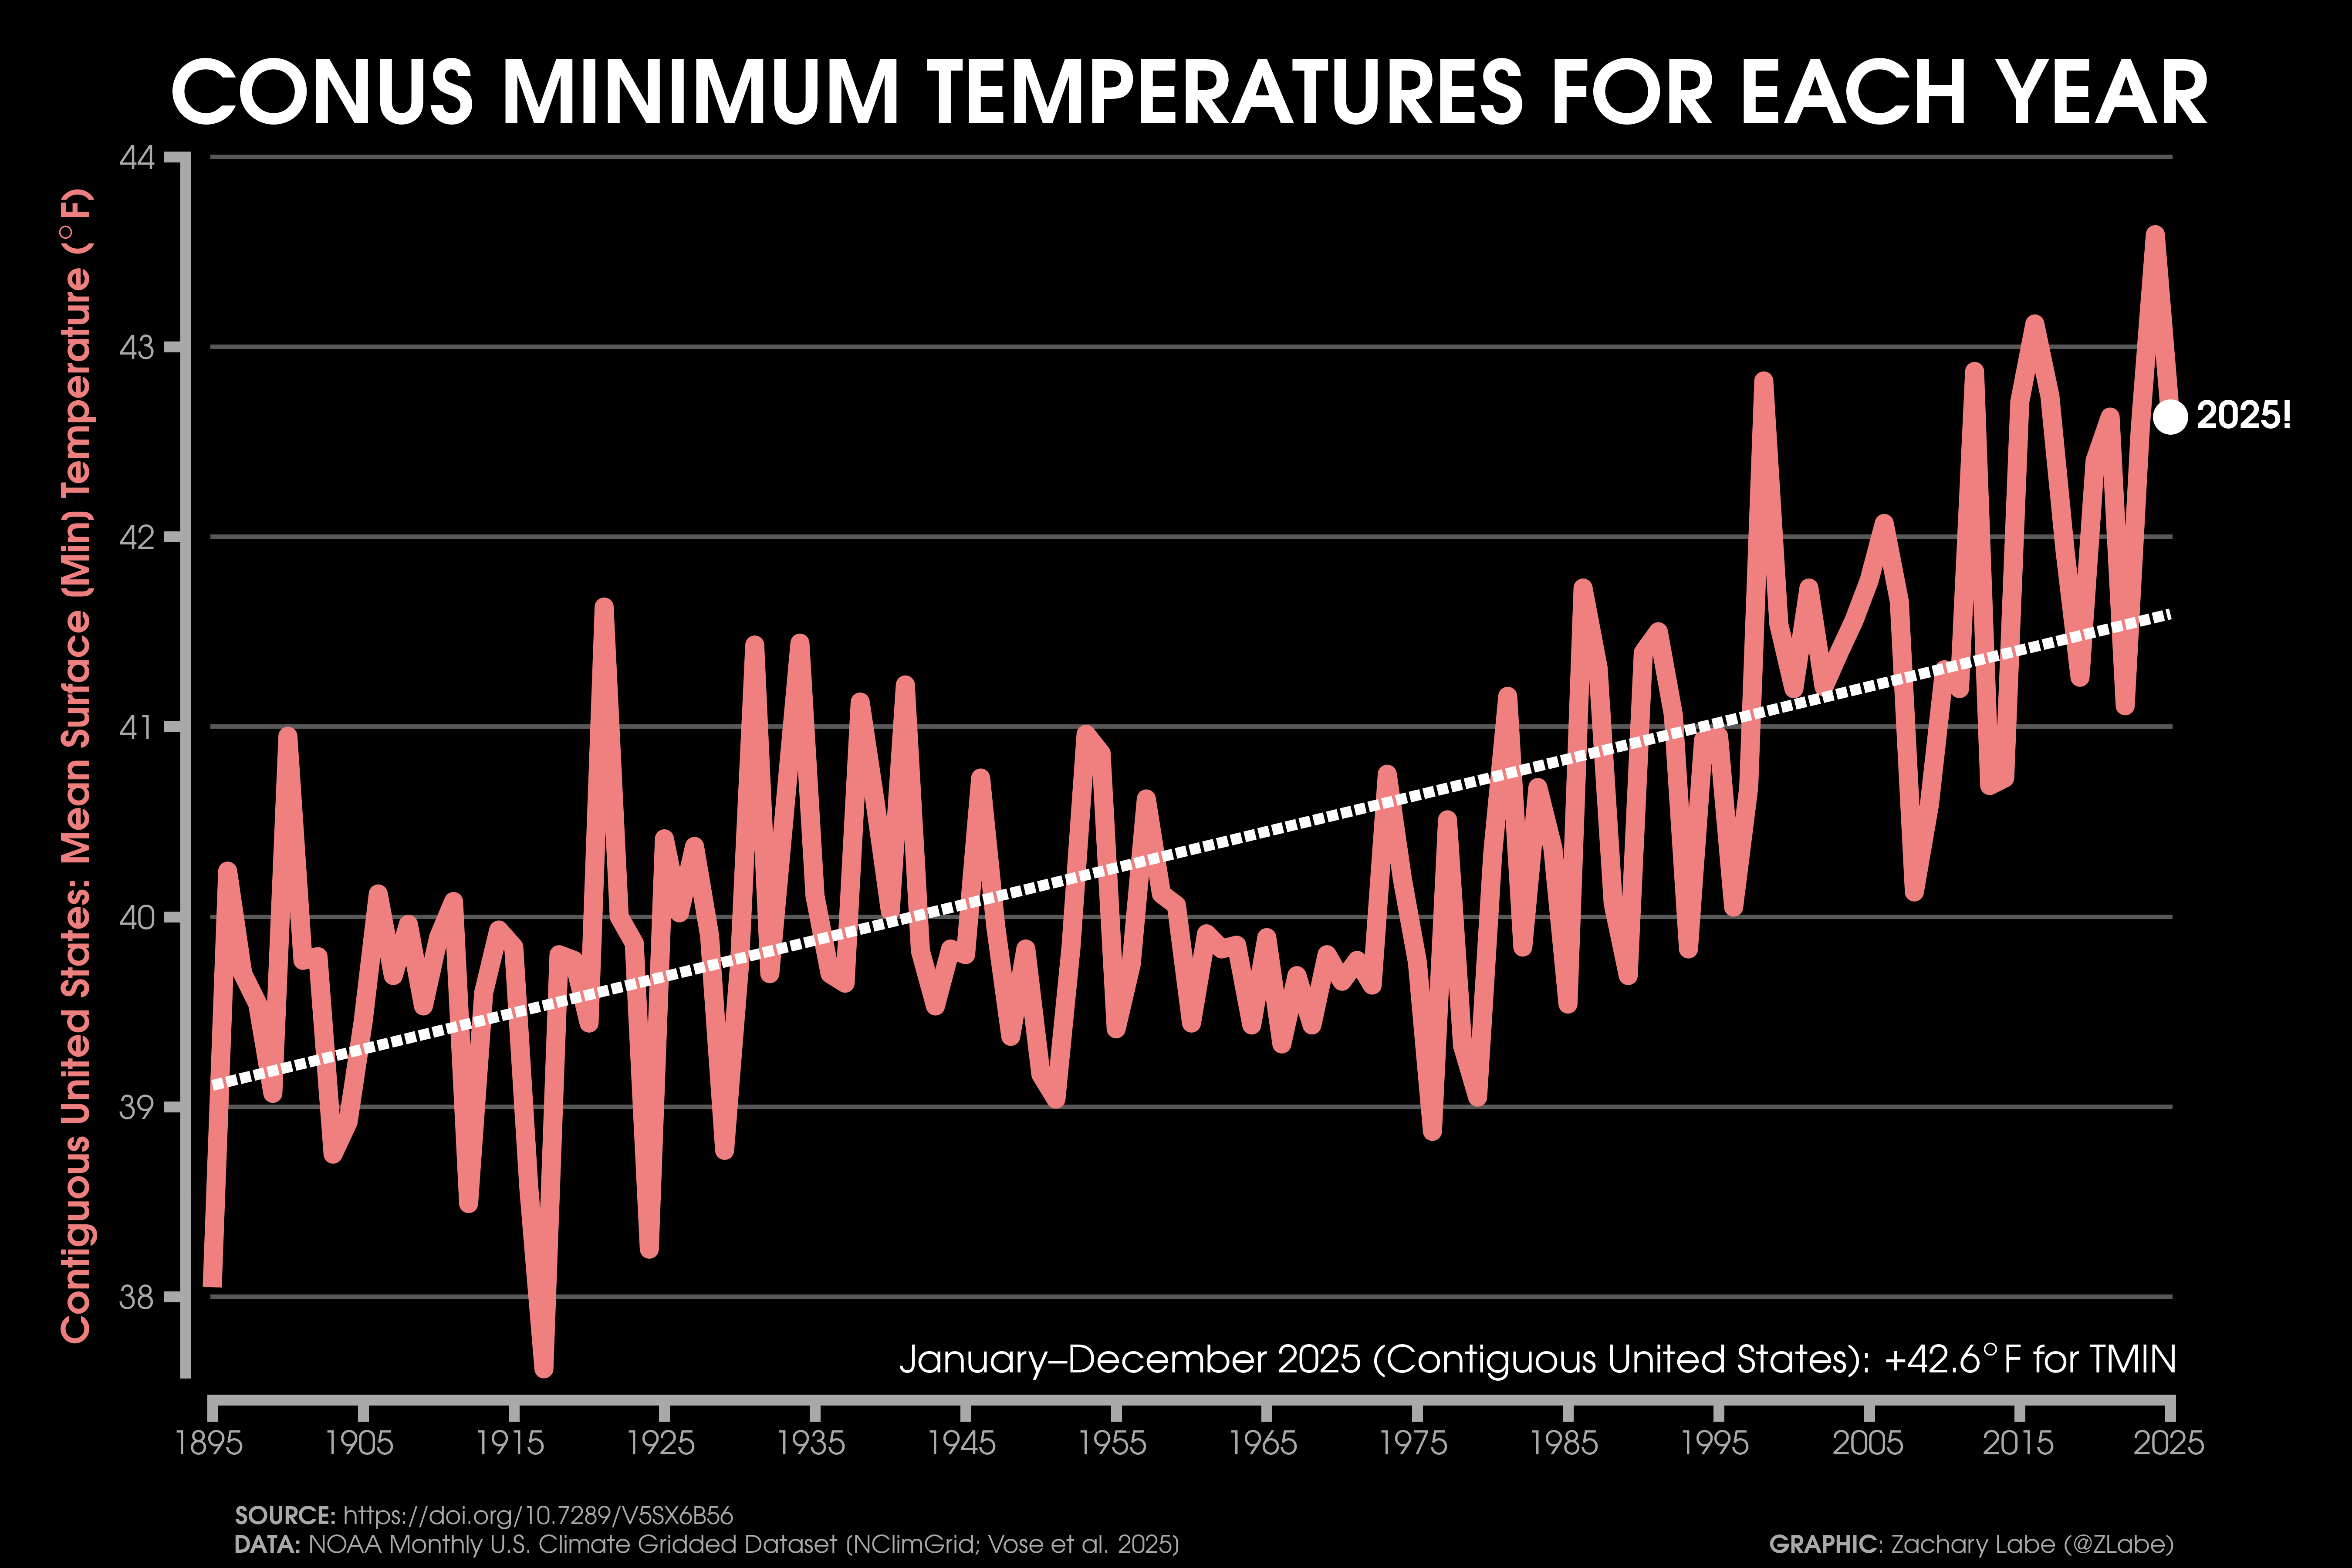
Temperature Time SeriesGraph showing the mean temperature (°F) across the contiguous United States (CONUS) and averaged for each year from 1895 to 2025. The actual mean CONUS temperature in 2025 was 54.6°F. Data is provided by NOAA/NCEI NClimGrid (https://doi.org/10.7289/V5SX6B56). Graphic was updated on 1/17/2026.A comparison of the seasonally-averaged maximum (left) and minimum (right) temperature anomalies (°F) for December-February (top) and June through August (bottom) across the contiguous United States (CONUS). Anomalies are calculated relative to the 1981-2010 reference period. Data is provided by NOAA/NCEI NClimGrid (https://doi.org/10.7289/V5SX6B56). Graphic was updated on 1/18/2026.Graph showing the mean temperature (°F) across Alaska (left) and Hawaii (right). The time series for each state is averaged for each year. Differences in the length of the record is due to data availability. Data is provided by NOAA/NCEI NClimGrid (https://doi.org/10.7289/V5SX6B56). Graphic was updated on 1/17/2026.Graph showing the mean maximum temperature (°F; TMAX) across the contiguous United States (CONUS) and averaged for each year from 1895 to 2025. Data is provided by NOAA/NCEI NClimGrid (https://doi.org/10.7289/V5SX6B56). Graphic was updated on 1/17/2026.Graph showing the mean minimum temperature (°F; TMIN) across the contiguous United States (CONUS) and averaged for each year from 1895 to 2025. The actual mean minimum CONUS temperature in 2025 was 42.6°F. The linear least squares trend line is also displayed over this period. Data is provided by NOAA/NCEI NClimGrid (https://doi.org/10.7289/V5SX6B56). Graphic was updated on 1/17/2026.
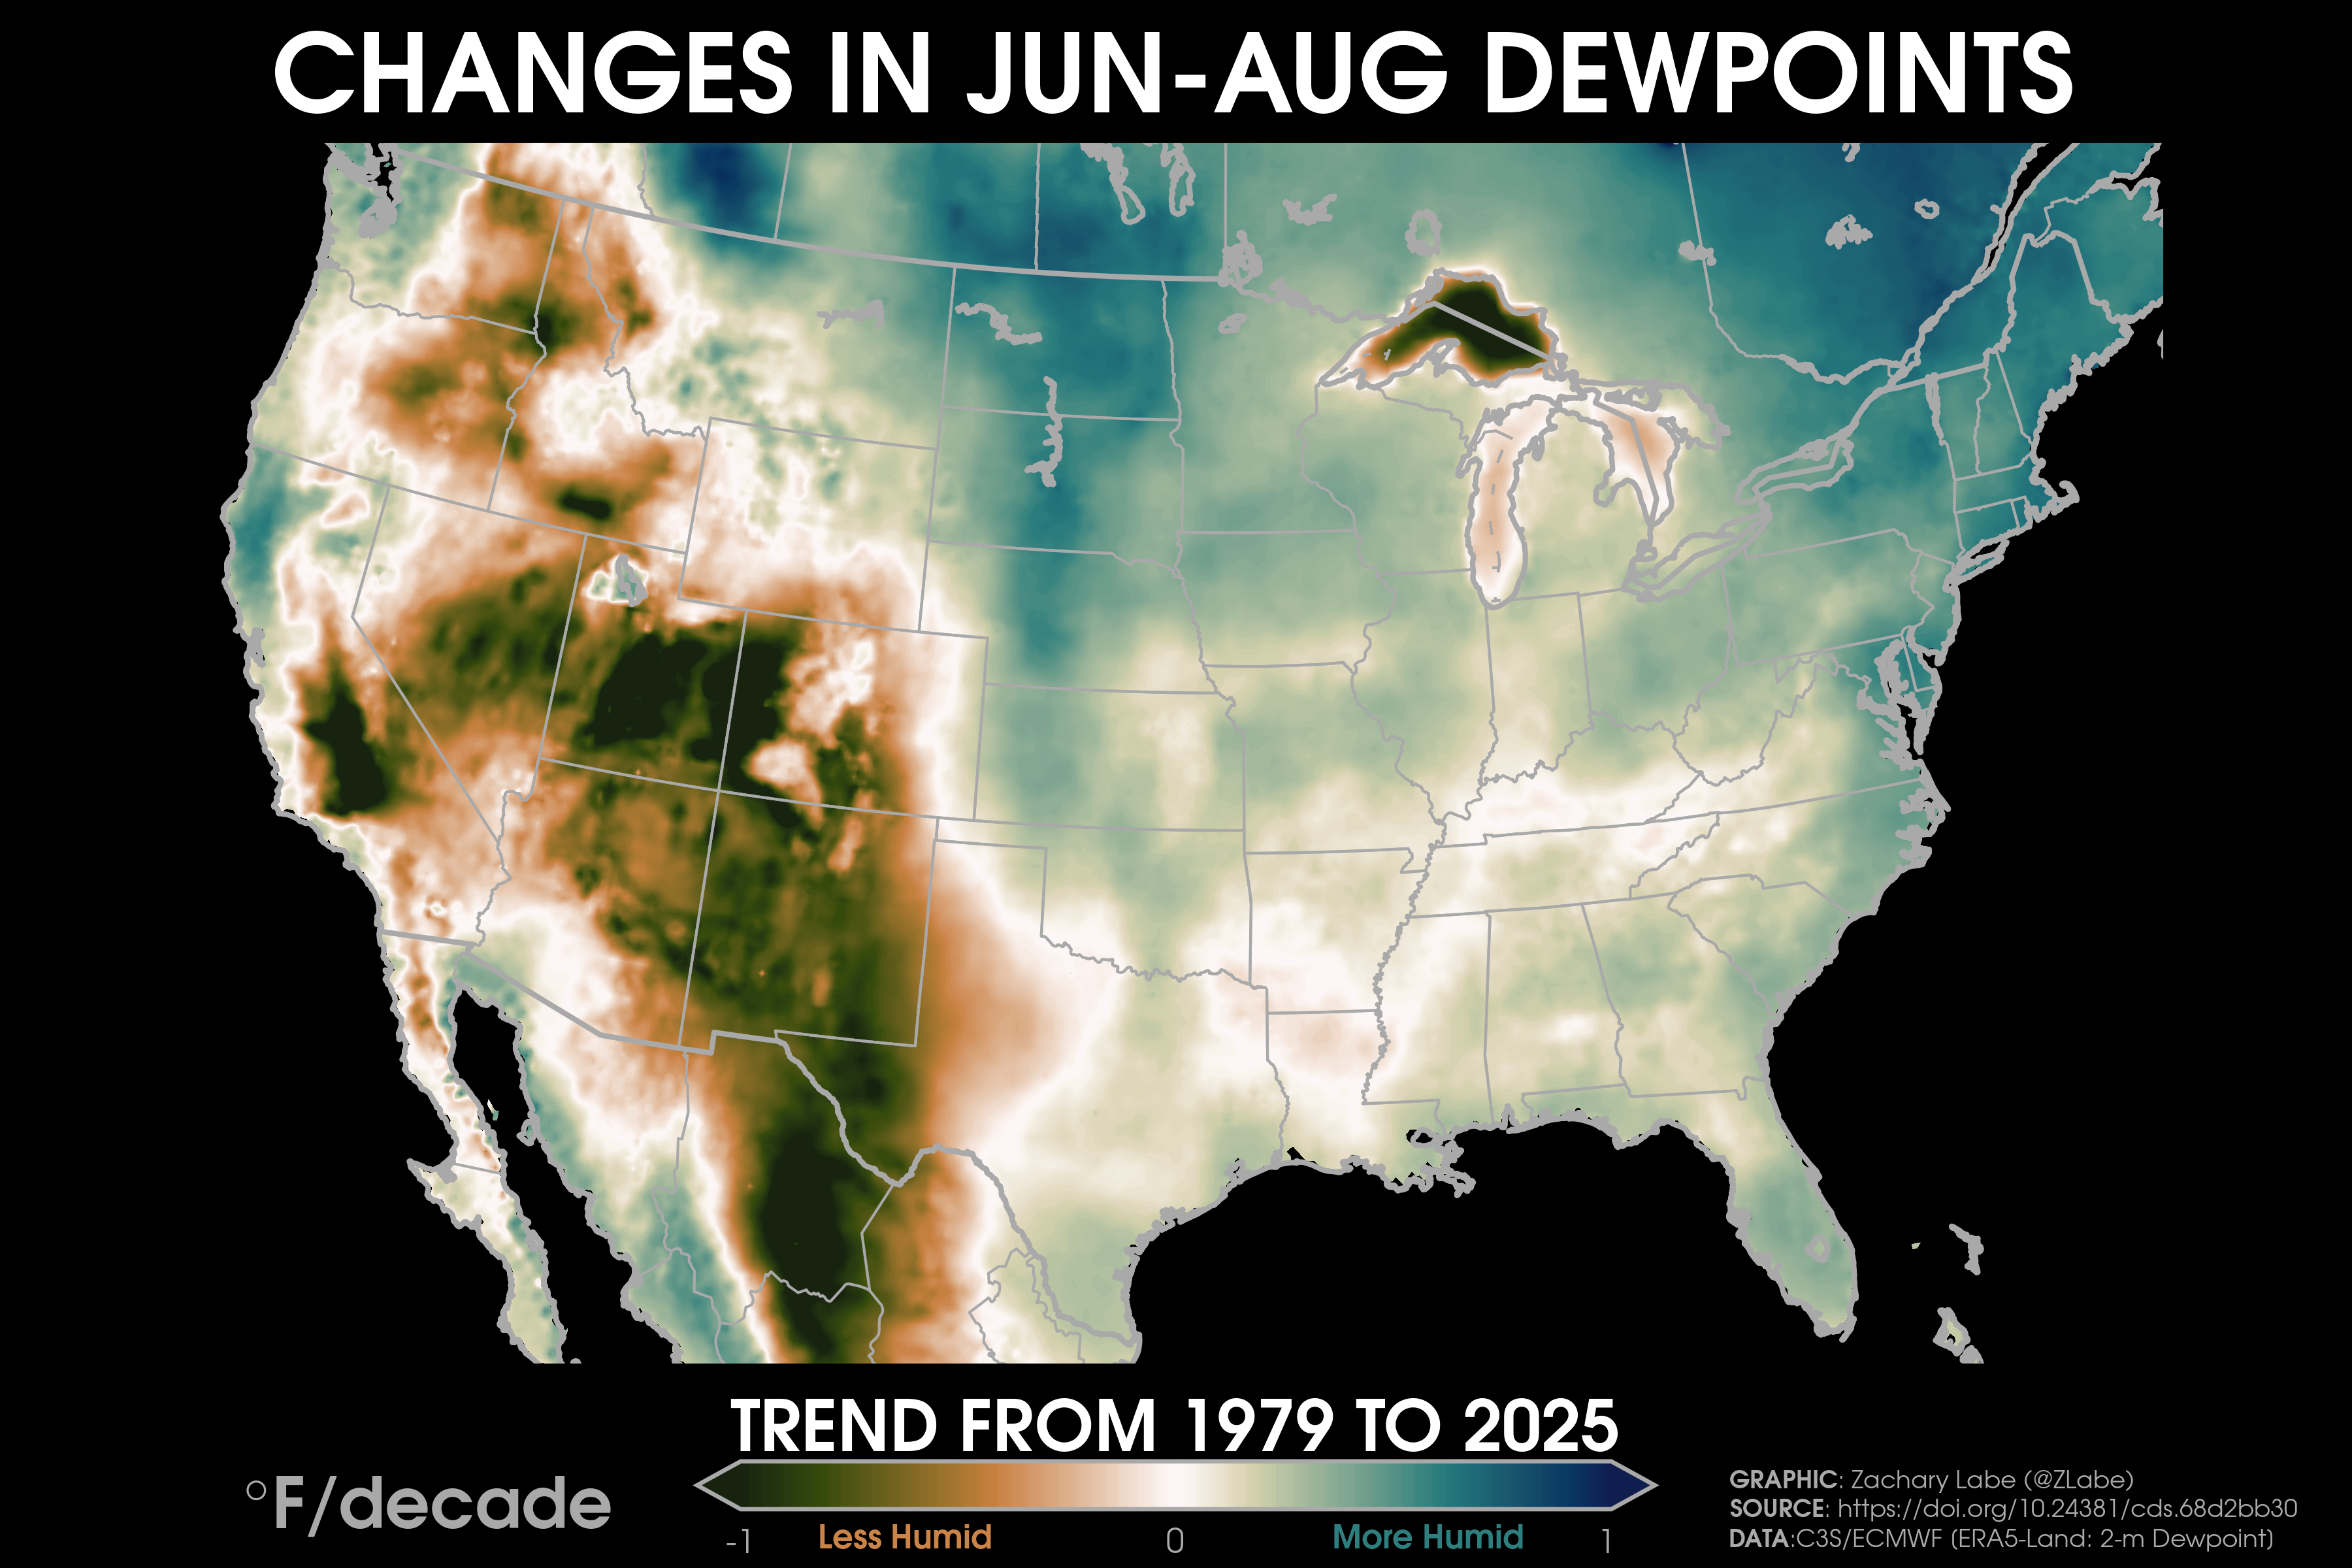
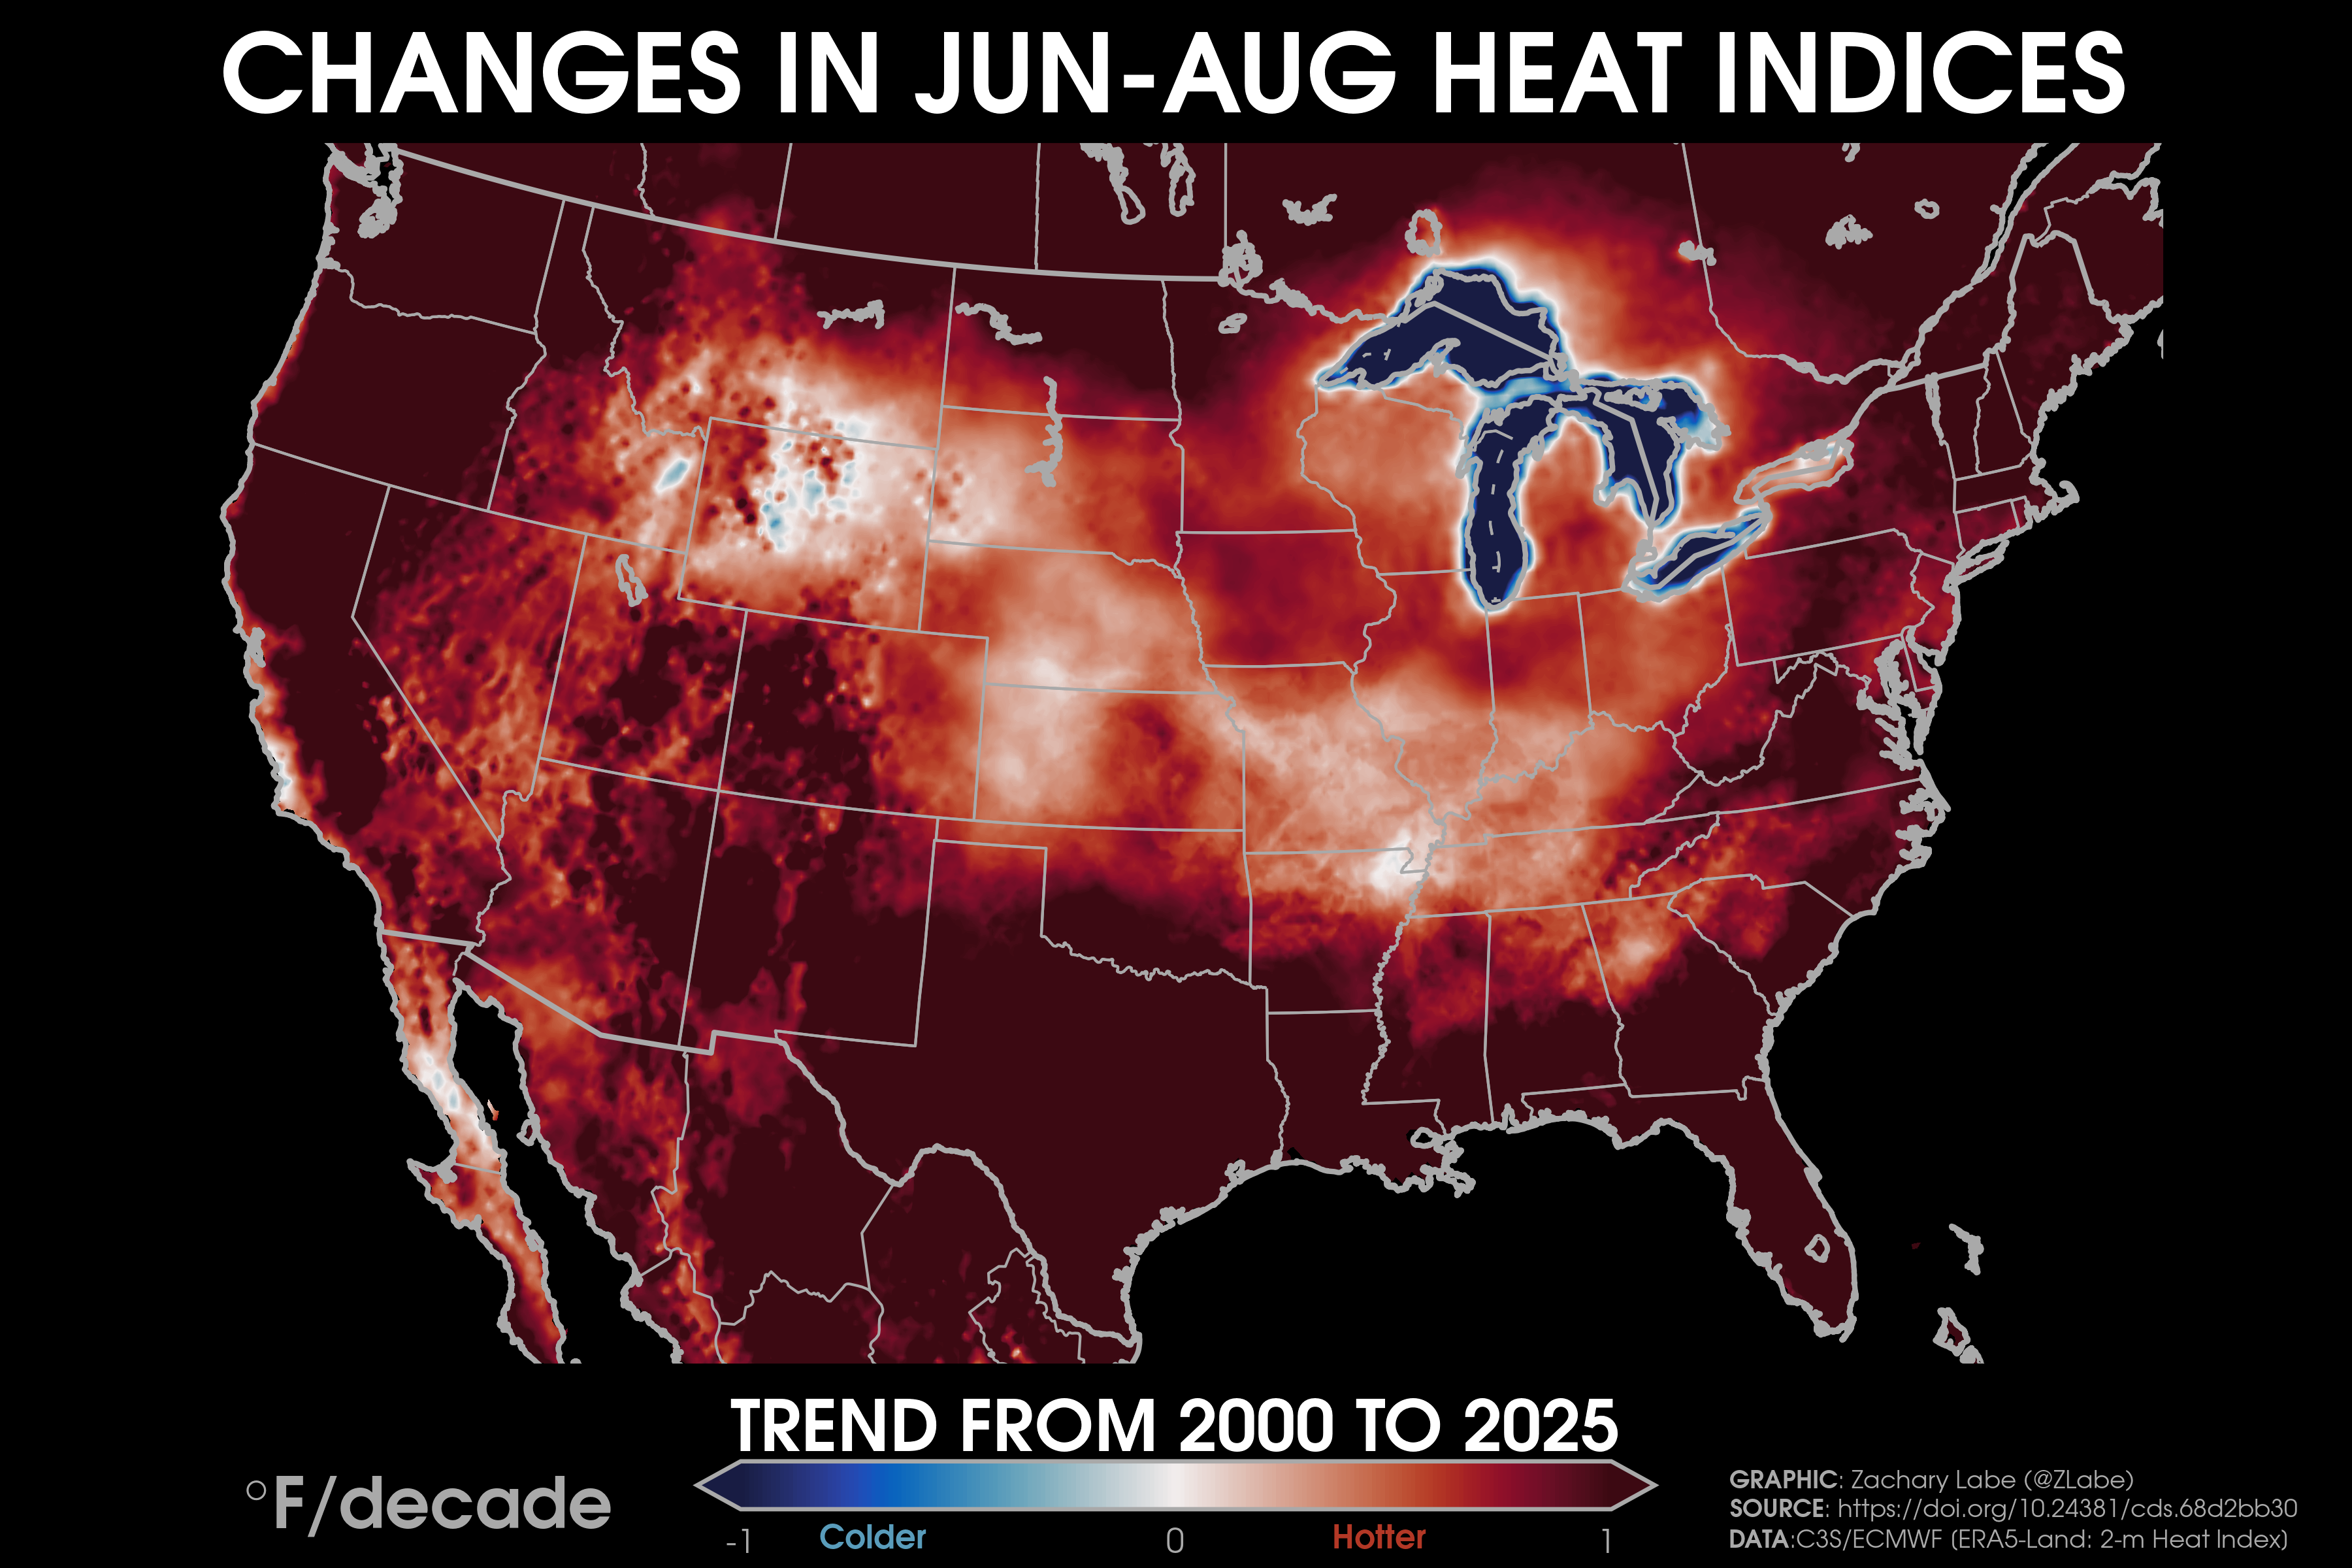
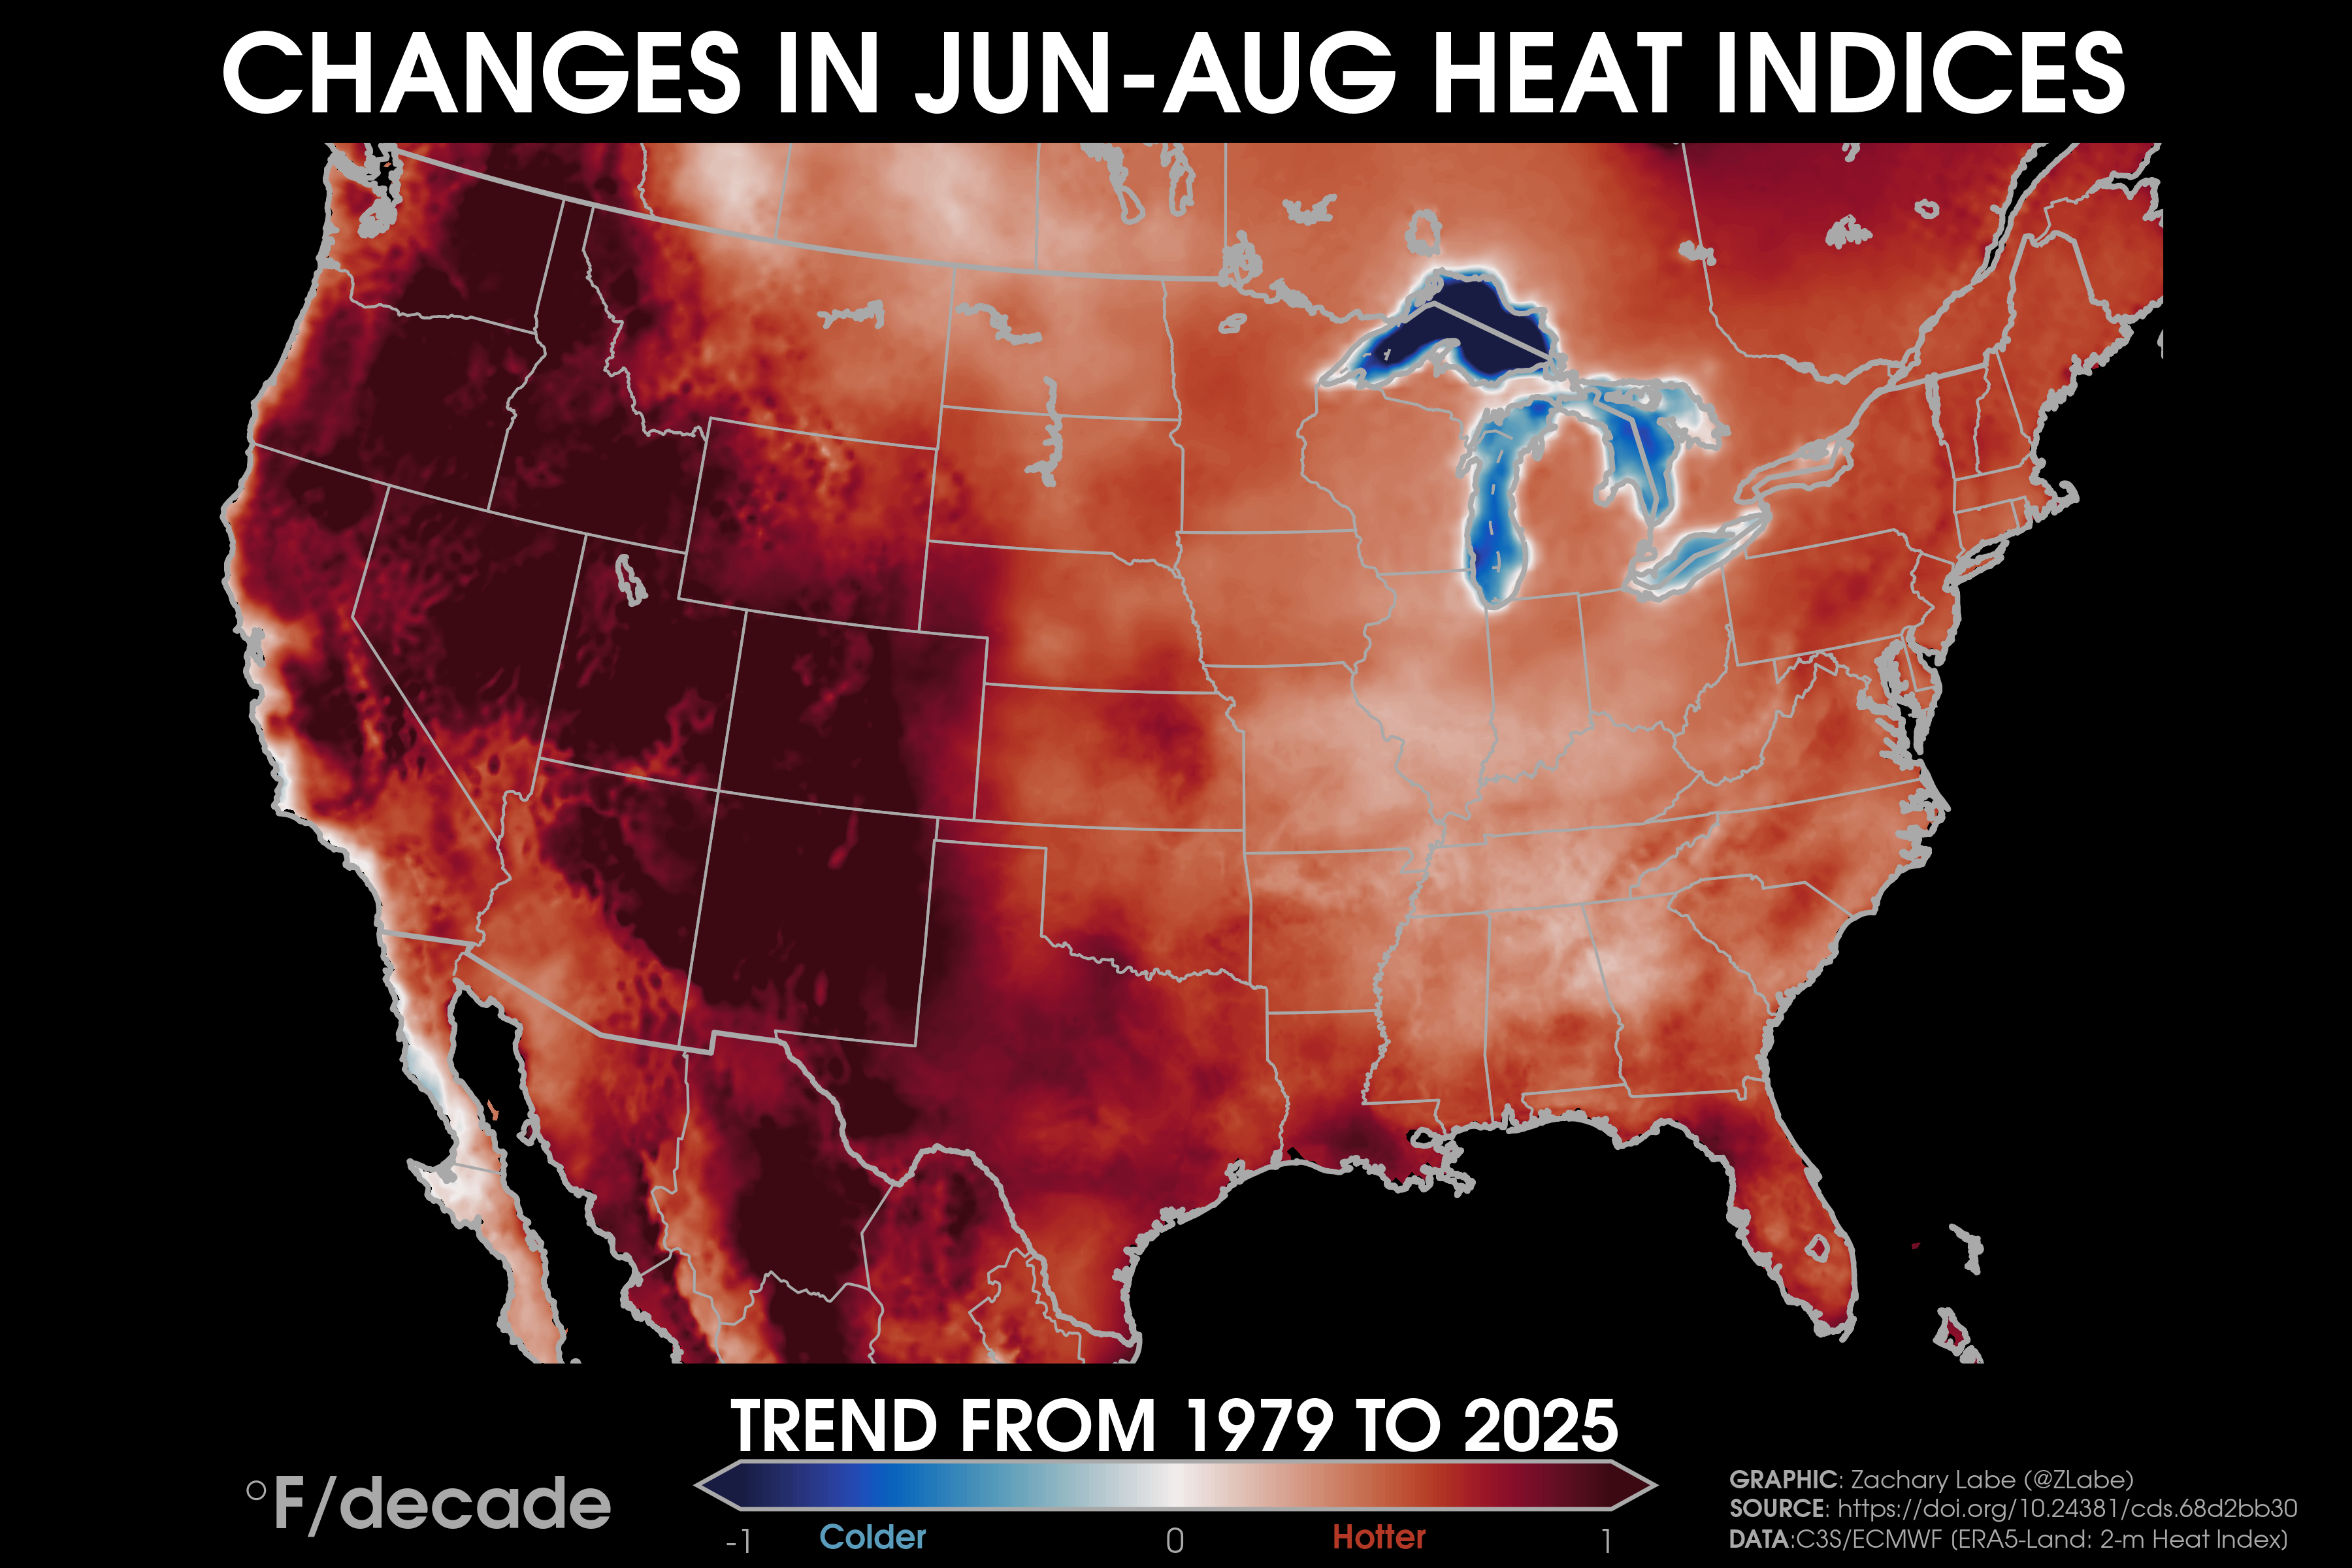
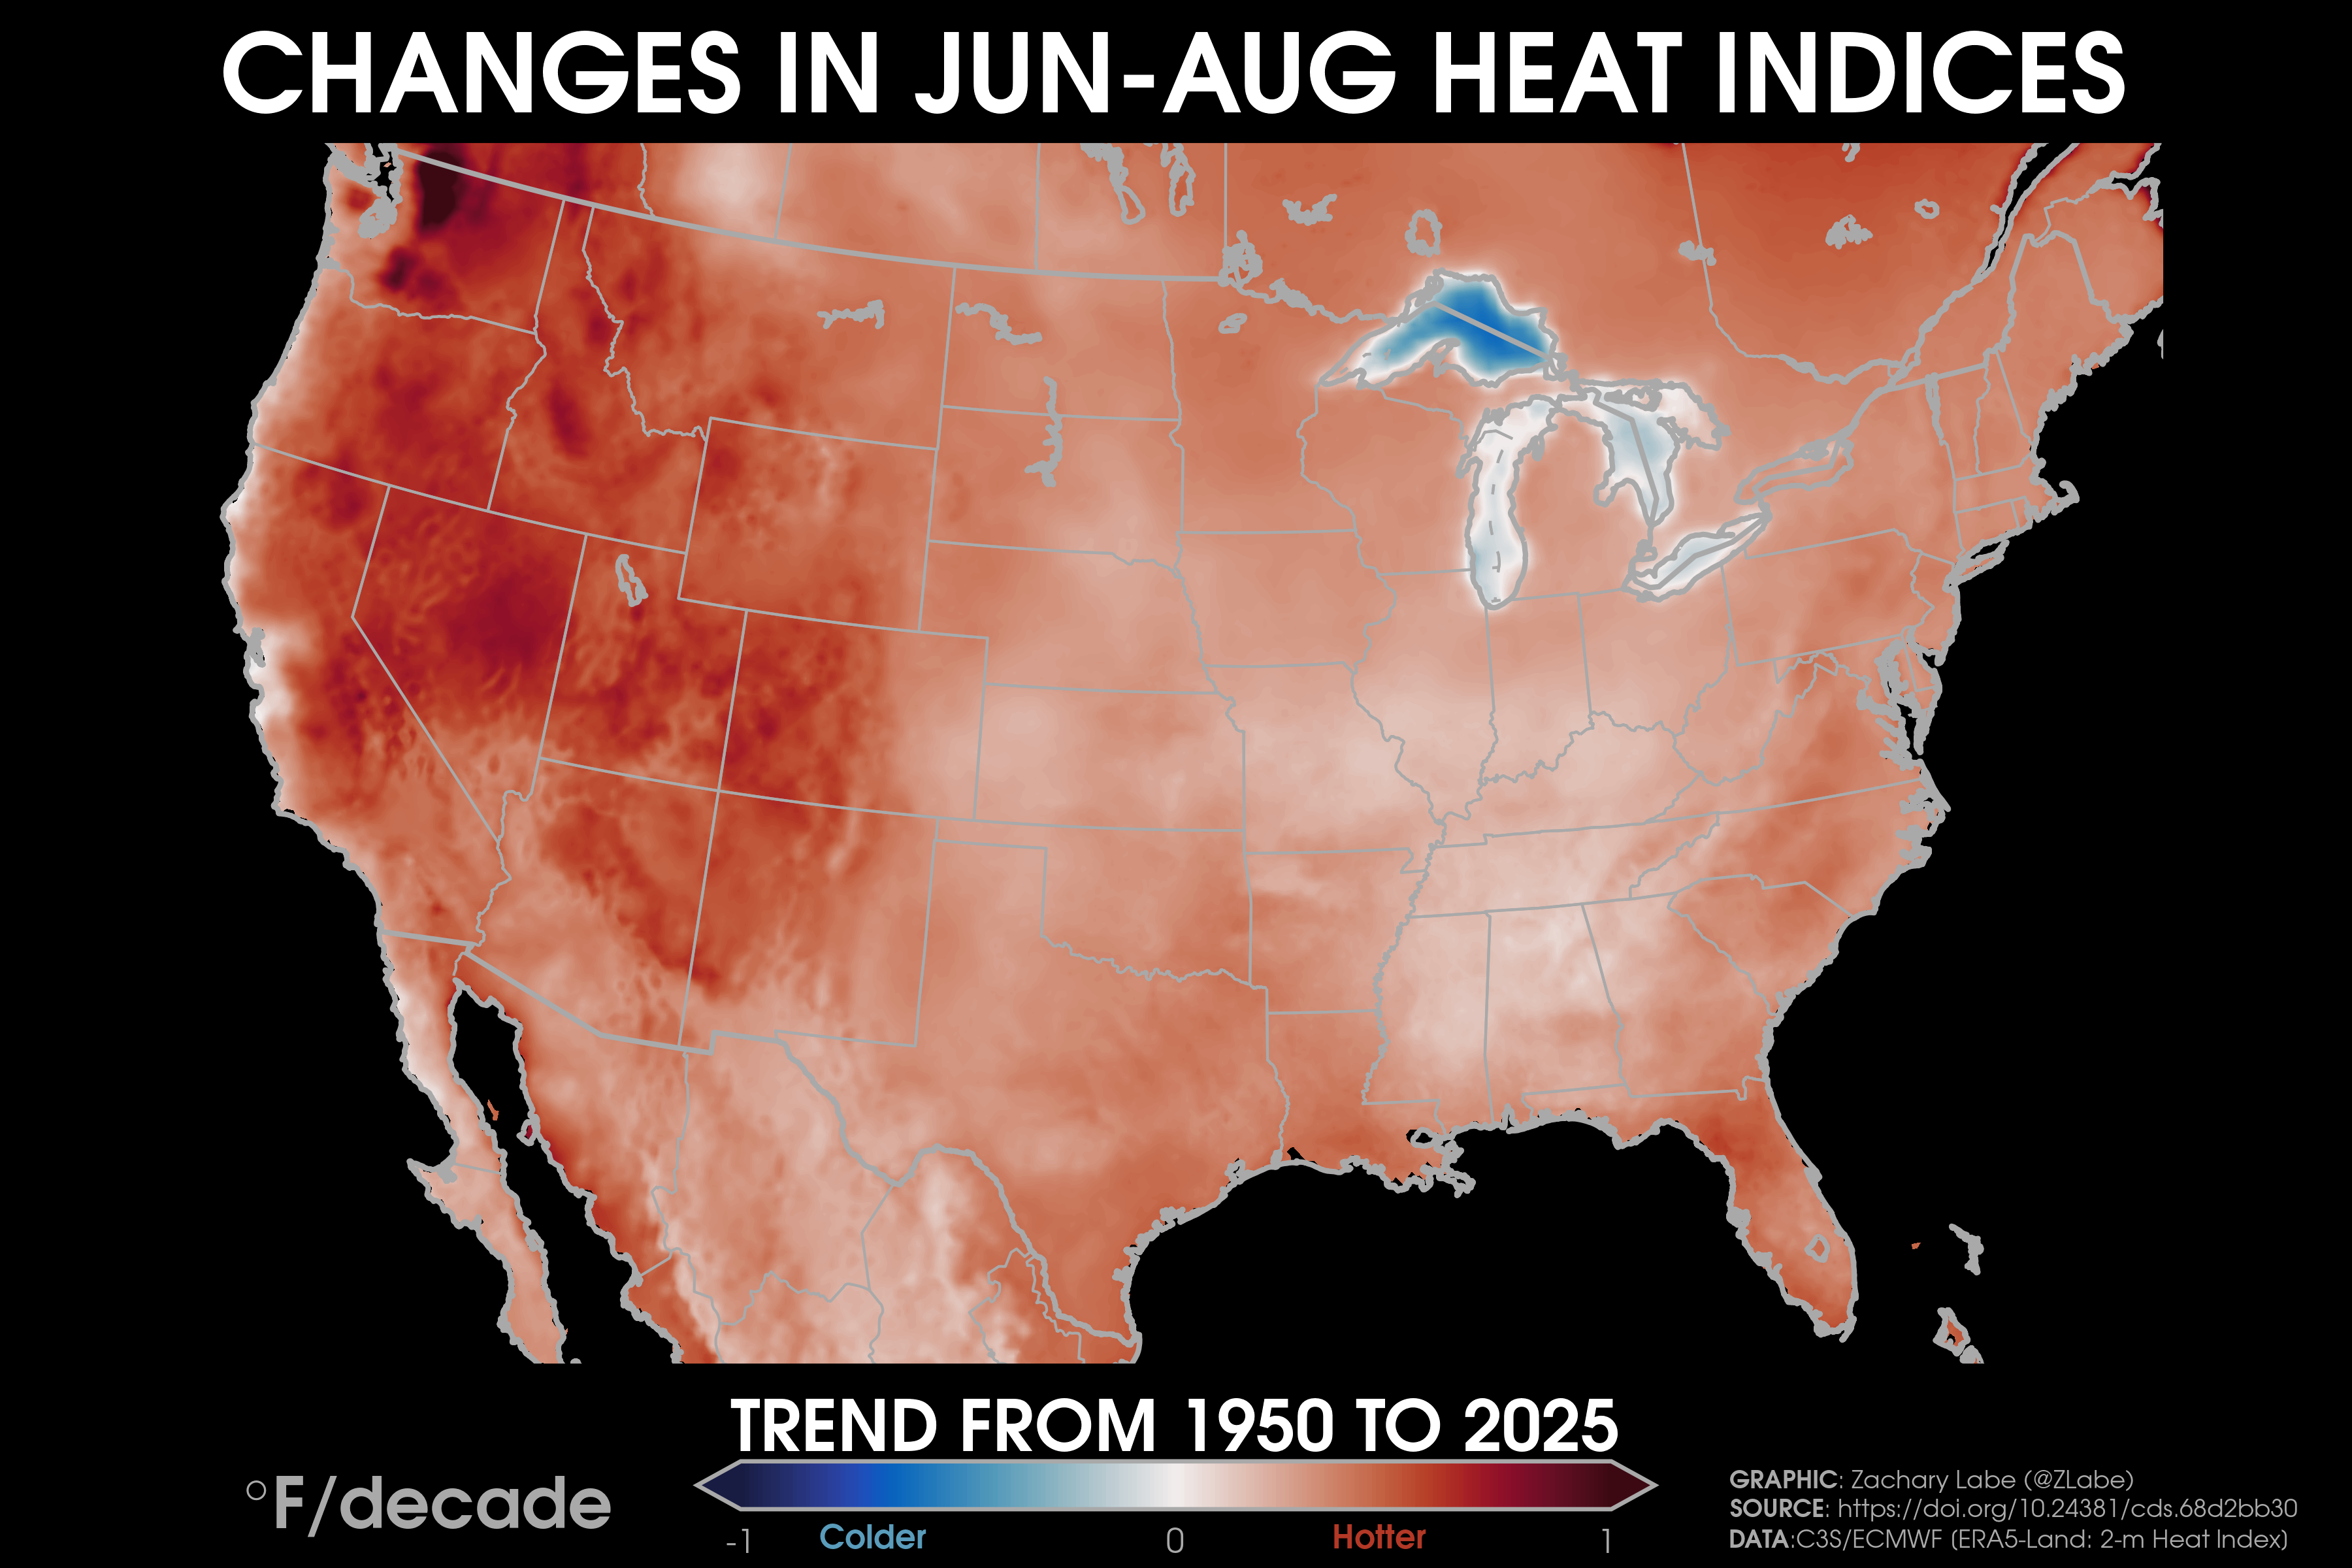
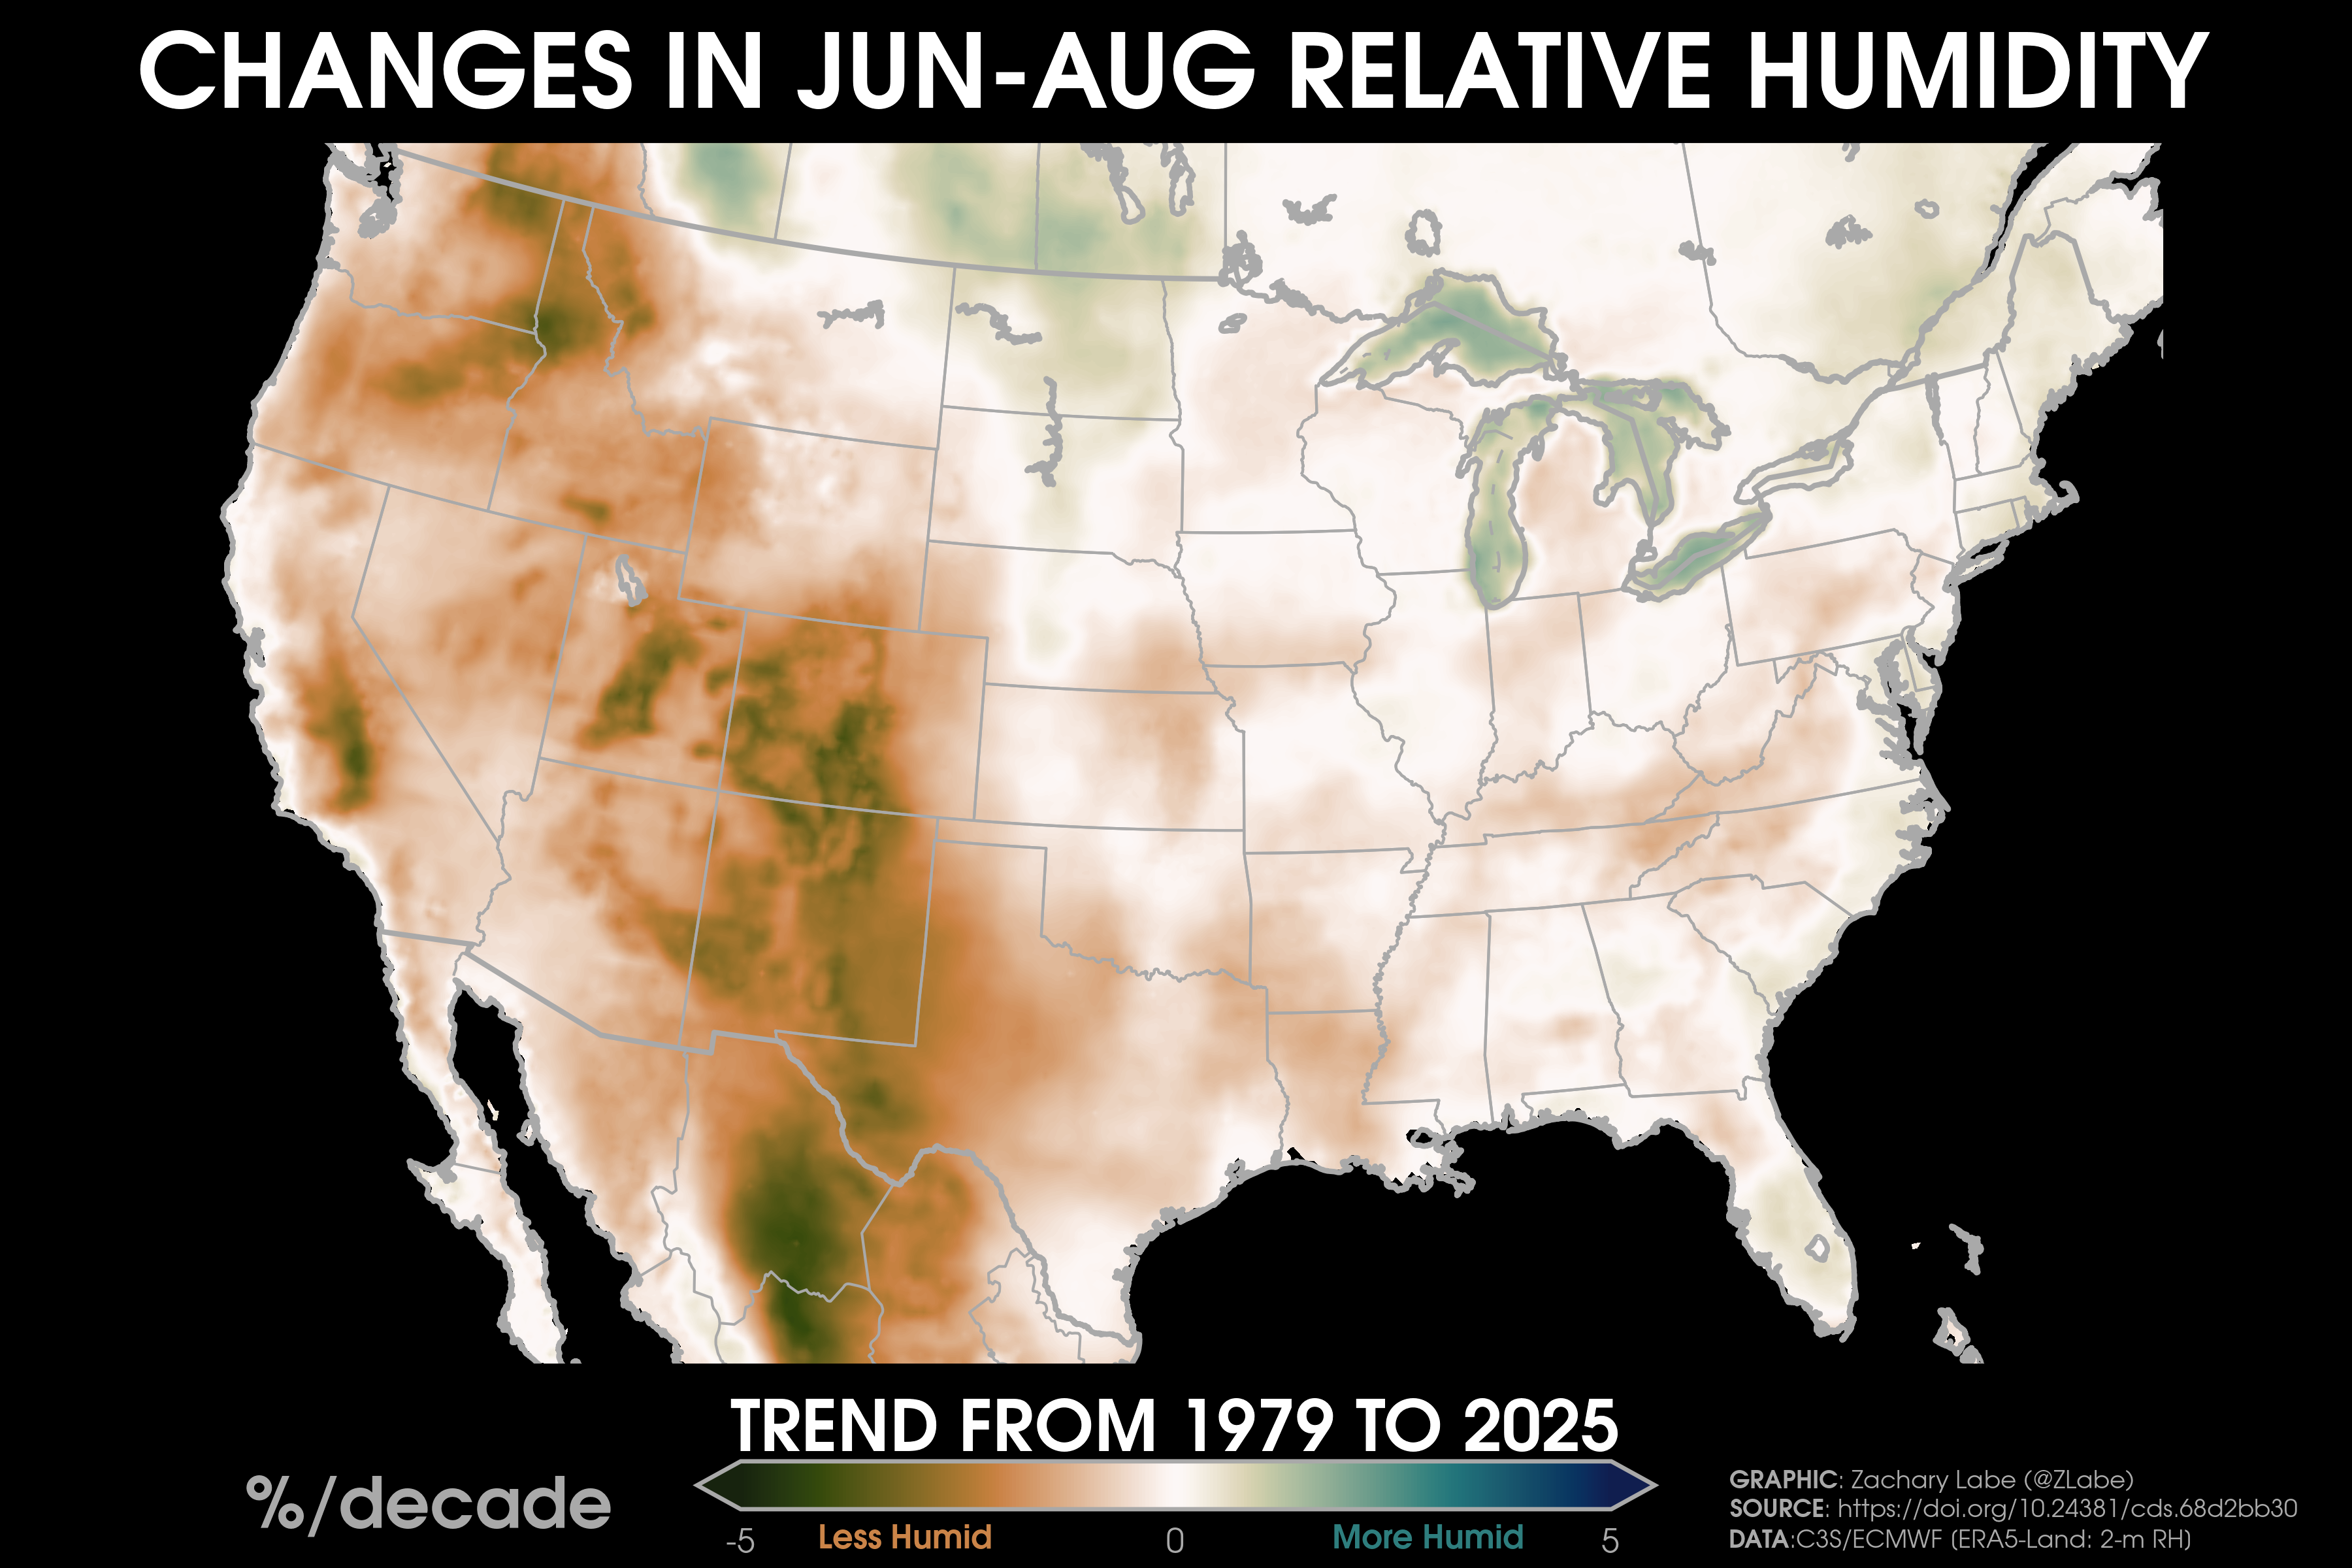
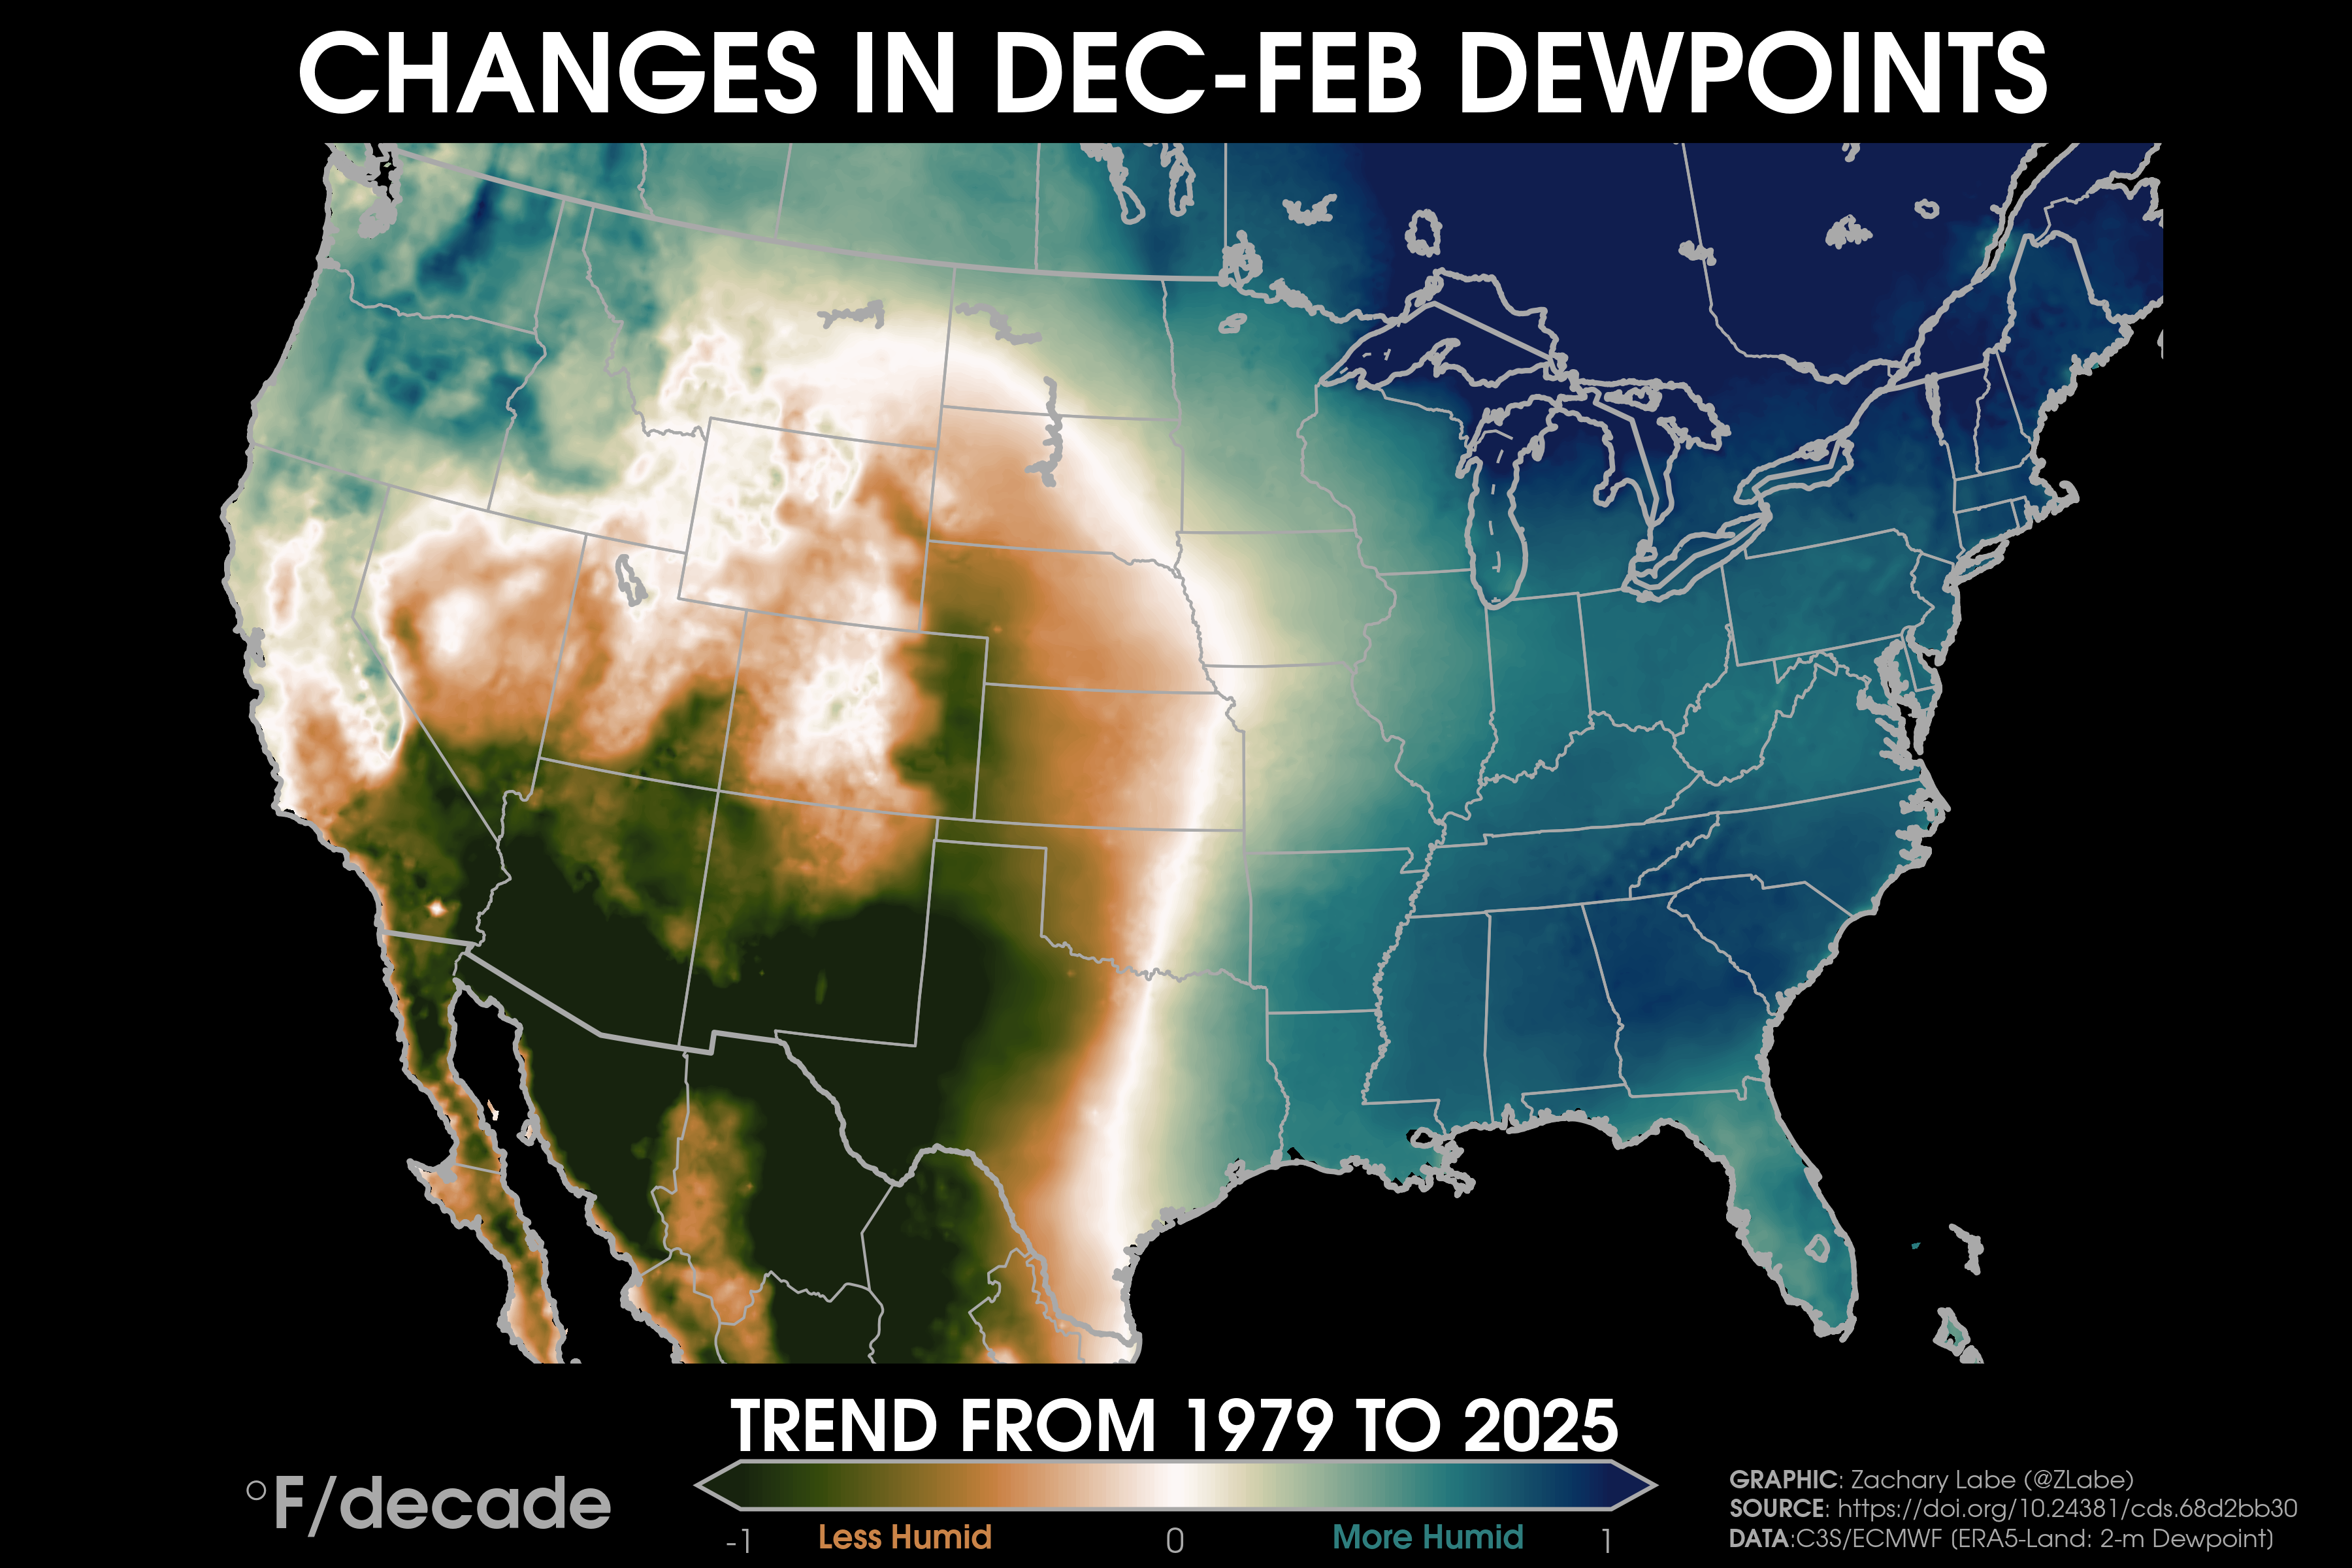
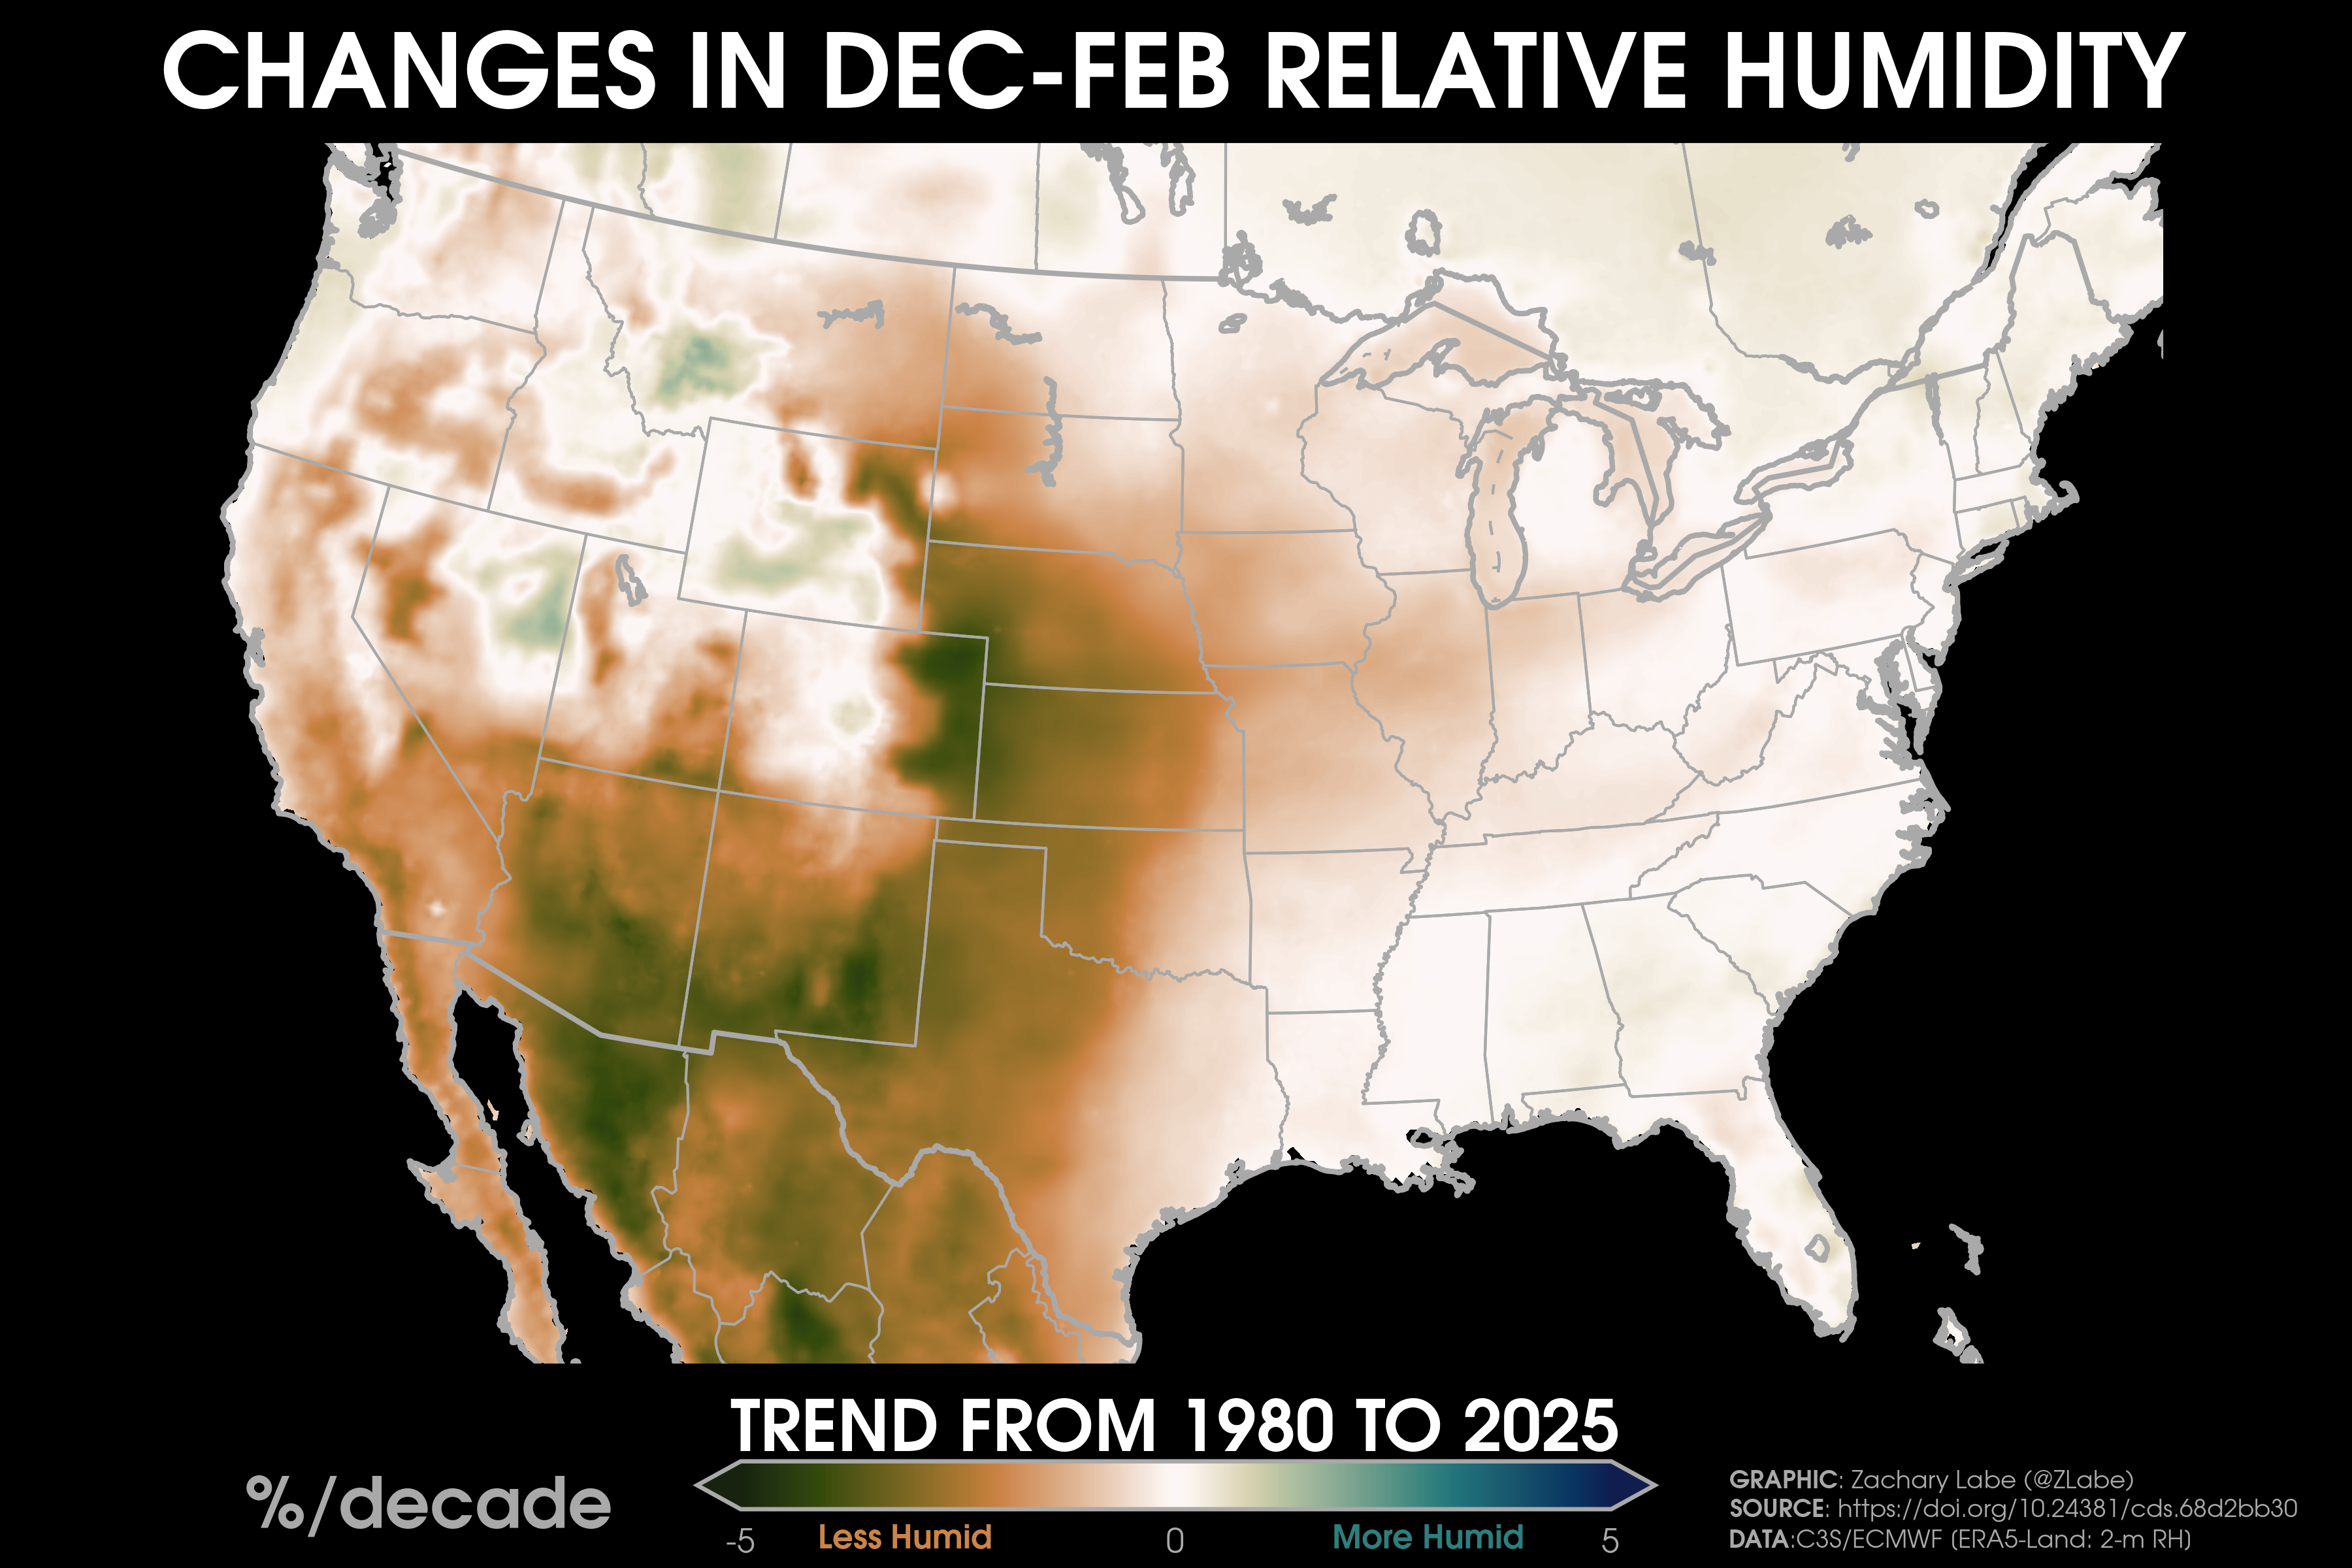
Humidity TrendsTrends (°F per decade) in near-surface dewpoints over land areas from 1979 to 2025 during June-July-August (JJA). Data is provided by ECMWF ERA5-Land Reanalysis (https://doi.org/10.24381/cds.68d2bb30). Graphic was updated on 1/11/2026.Trends (°F per decade) in near-surface monthly-averaged heat indices over land areas from 2000 to 2025 during June-July-August (JJA). Data is derived from ECMWF ERA5-Land Reanalysis (https://doi.org/10.24381/cds.68d2bb30) using the NOAA/NWS formula (https://www.wpc.ncep.noaa.gov/html/heatindex_equation.shtml). Graphic was updated on 2/8/2026.Trends (°F per decade) in near-surface monthly-averaged heat indices over land areas from 1979 to 2025 during June-July-August (JJA). Data is derived from ECMWF ERA5-Land Reanalysis (https://doi.org/10.24381/cds.68d2bb30) using the NOAA/NWS formula (https://www.wpc.ncep.noaa.gov/html/heatindex_equation.shtml). Graphic was updated on 2/8/2026.Trends (°F per decade) in near-surface monthly-averaged heat indices over land areas from 1950 to 2025 during June-July-August (JJA). Data is derived from ECMWF ERA5-Land Reanalysis (https://doi.org/10.24381/cds.68d2bb30) using the NOAA/NWS formula (https://www.wpc.ncep.noaa.gov/html/heatindex_equation.shtml). Graphic was updated on 2/8/2026.Trends (°F per decade) in near-surface relative humidity over land areas from 1979 to 2025 during June-July-August (JJA). Data derived from ECMWF ERA5-Land Reanalysis (https://doi.org/10.24381/cds.68d2bb30). Graphic was updated on 2/8/2026.Trends (°F per decade) in near-surface dewpoints over land areas from 1979 to 2025 during December-January-February (DJF). Data is provided by ECMWF ERA5-Land Reanalysis (https://doi.org/10.24381/cds.68d2bb30). Graphic was updated on 1/11/2026.Trends (°F per decade) in near-surface relative humidity over land areas from 1980 to 2025 during December-January-February (DJF). Data derived from ECMWF ERA5-Land Reanalysis (https://doi.org/10.24381/cds.68d2bb30). Graphic was updated on 2/8/2026.
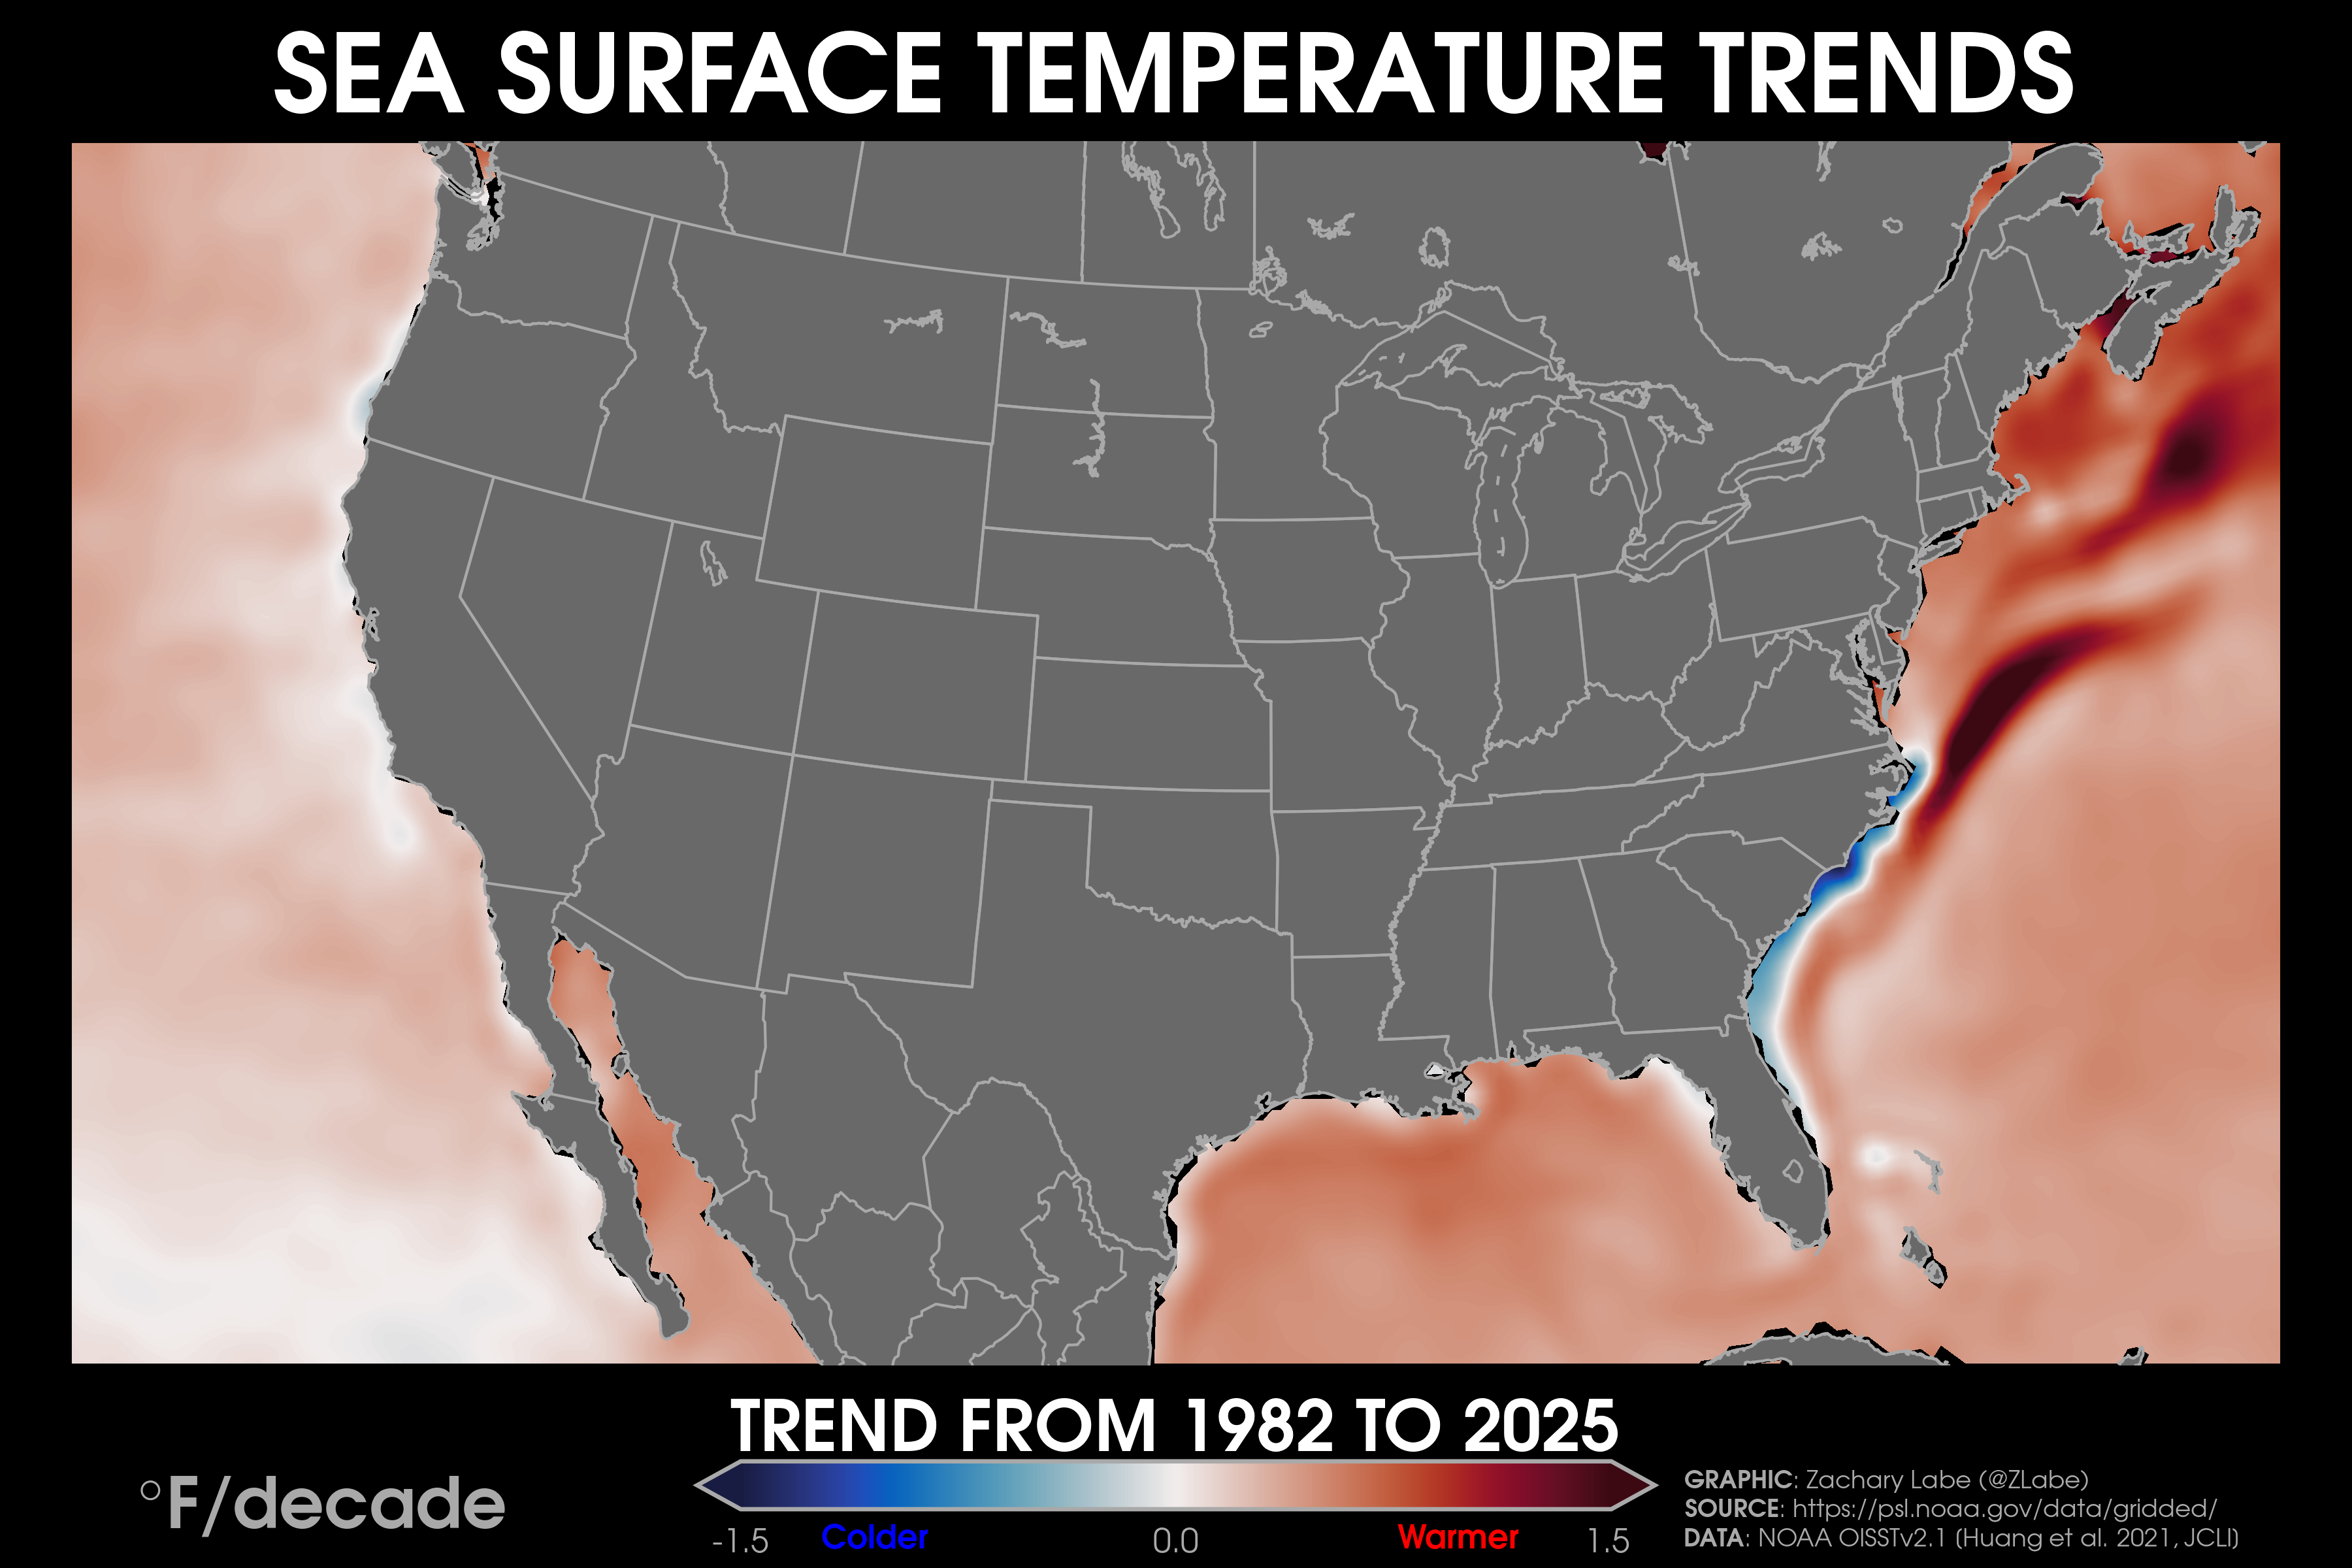
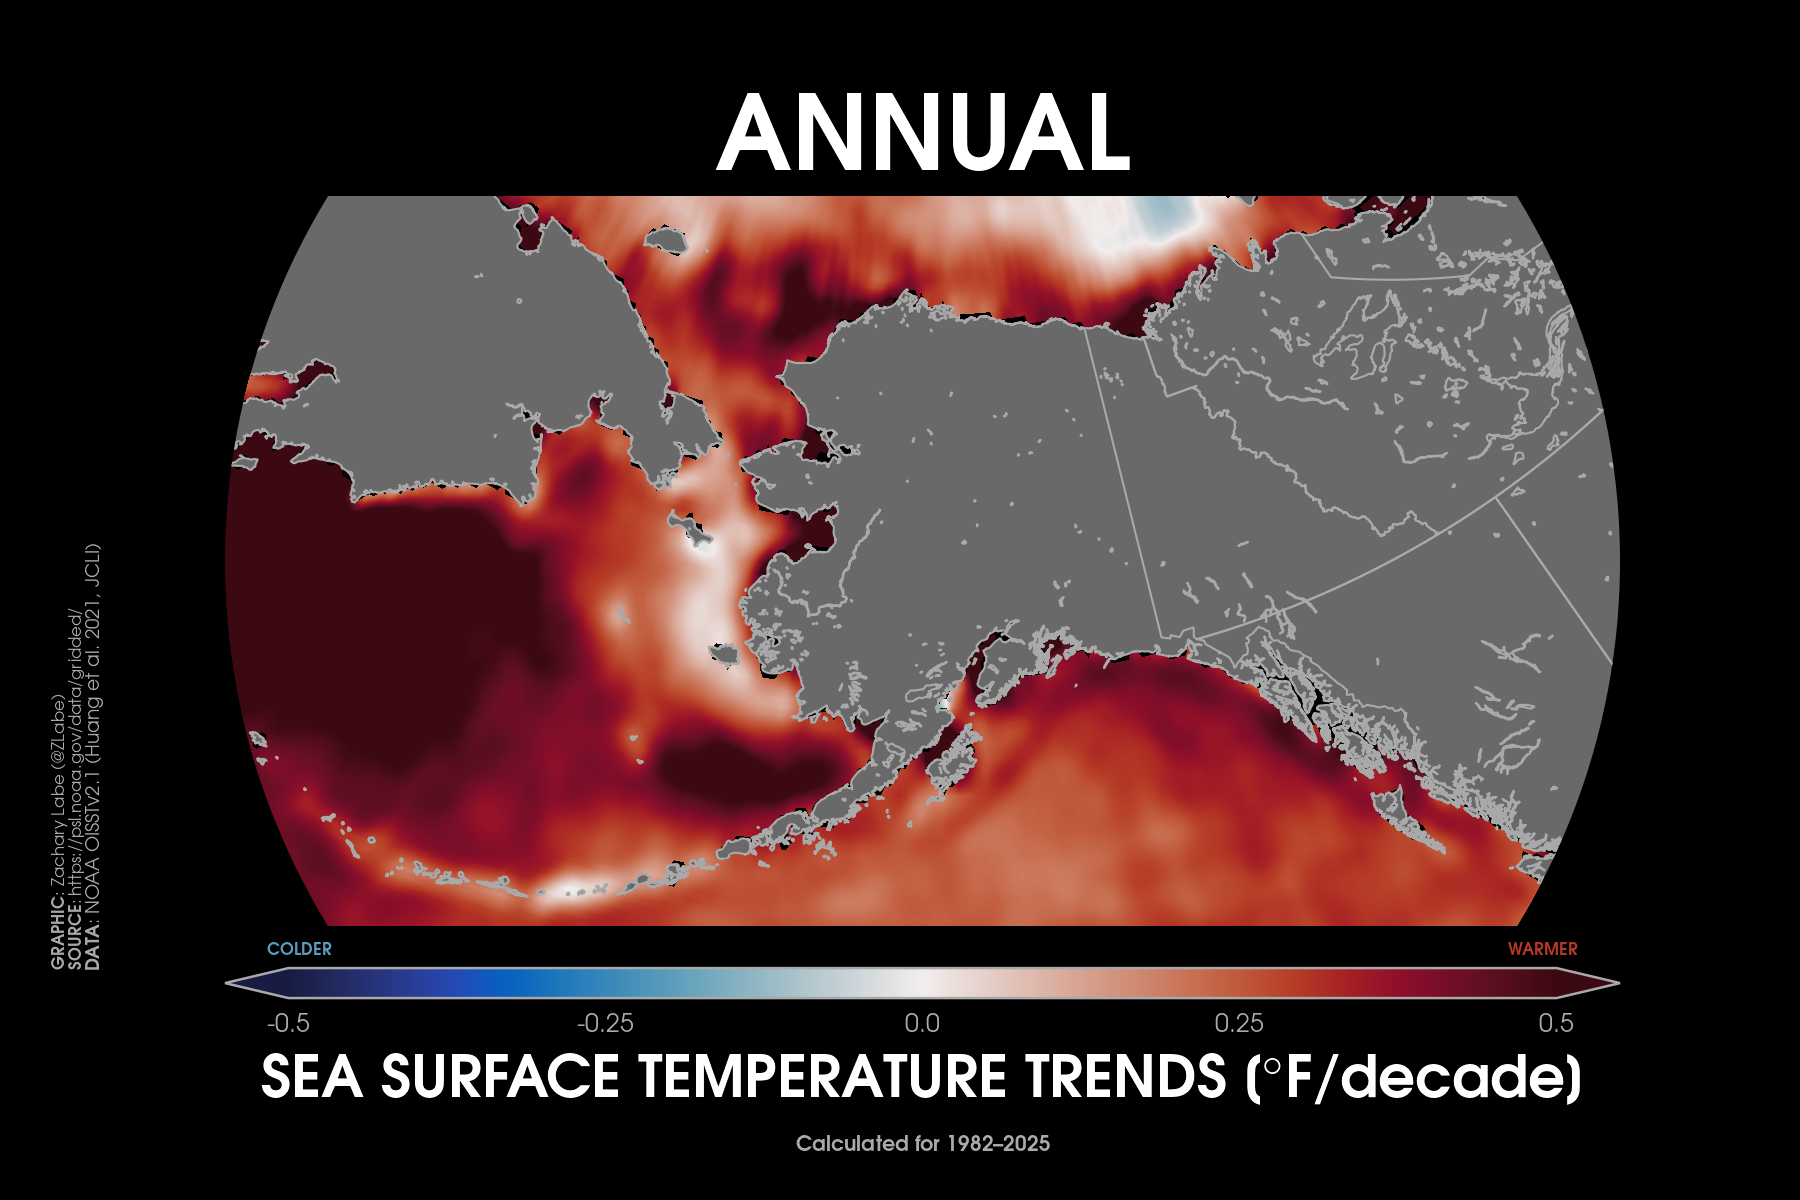
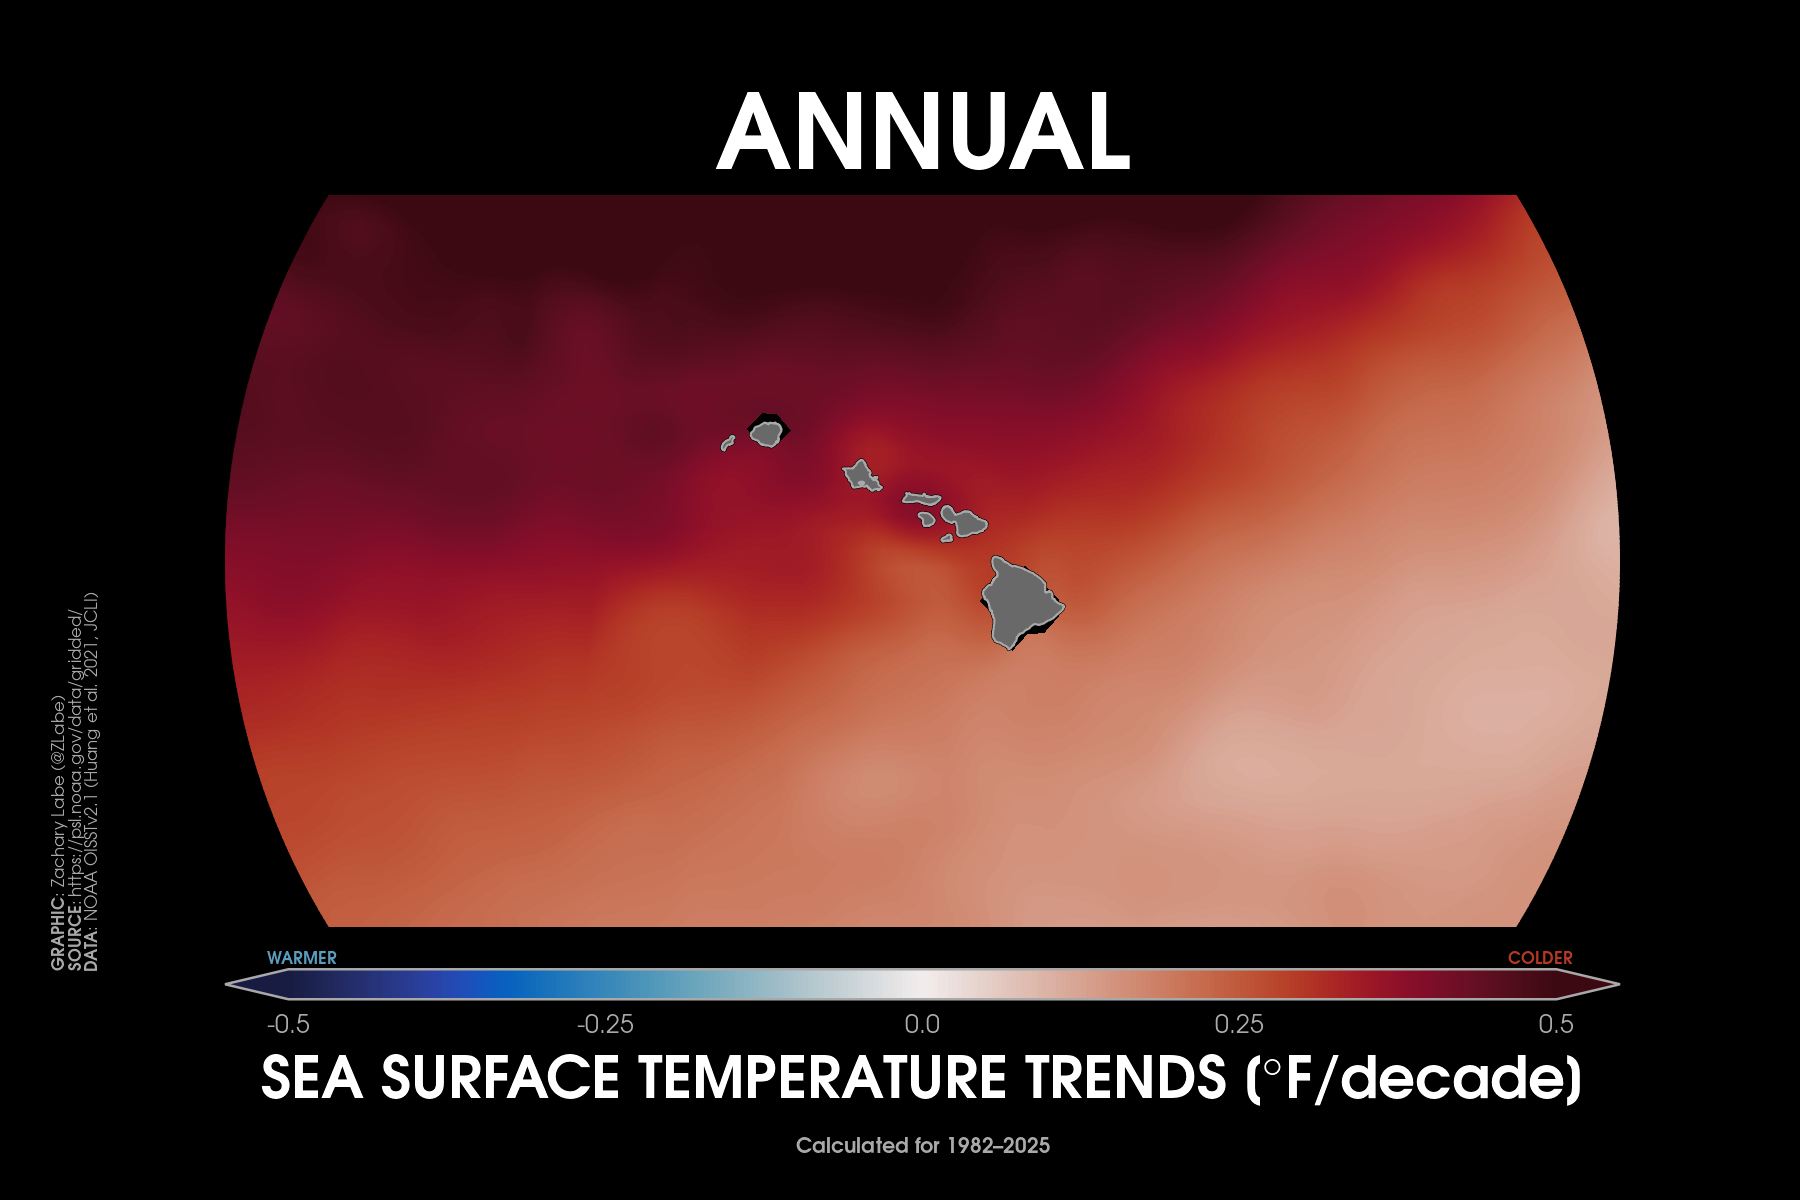
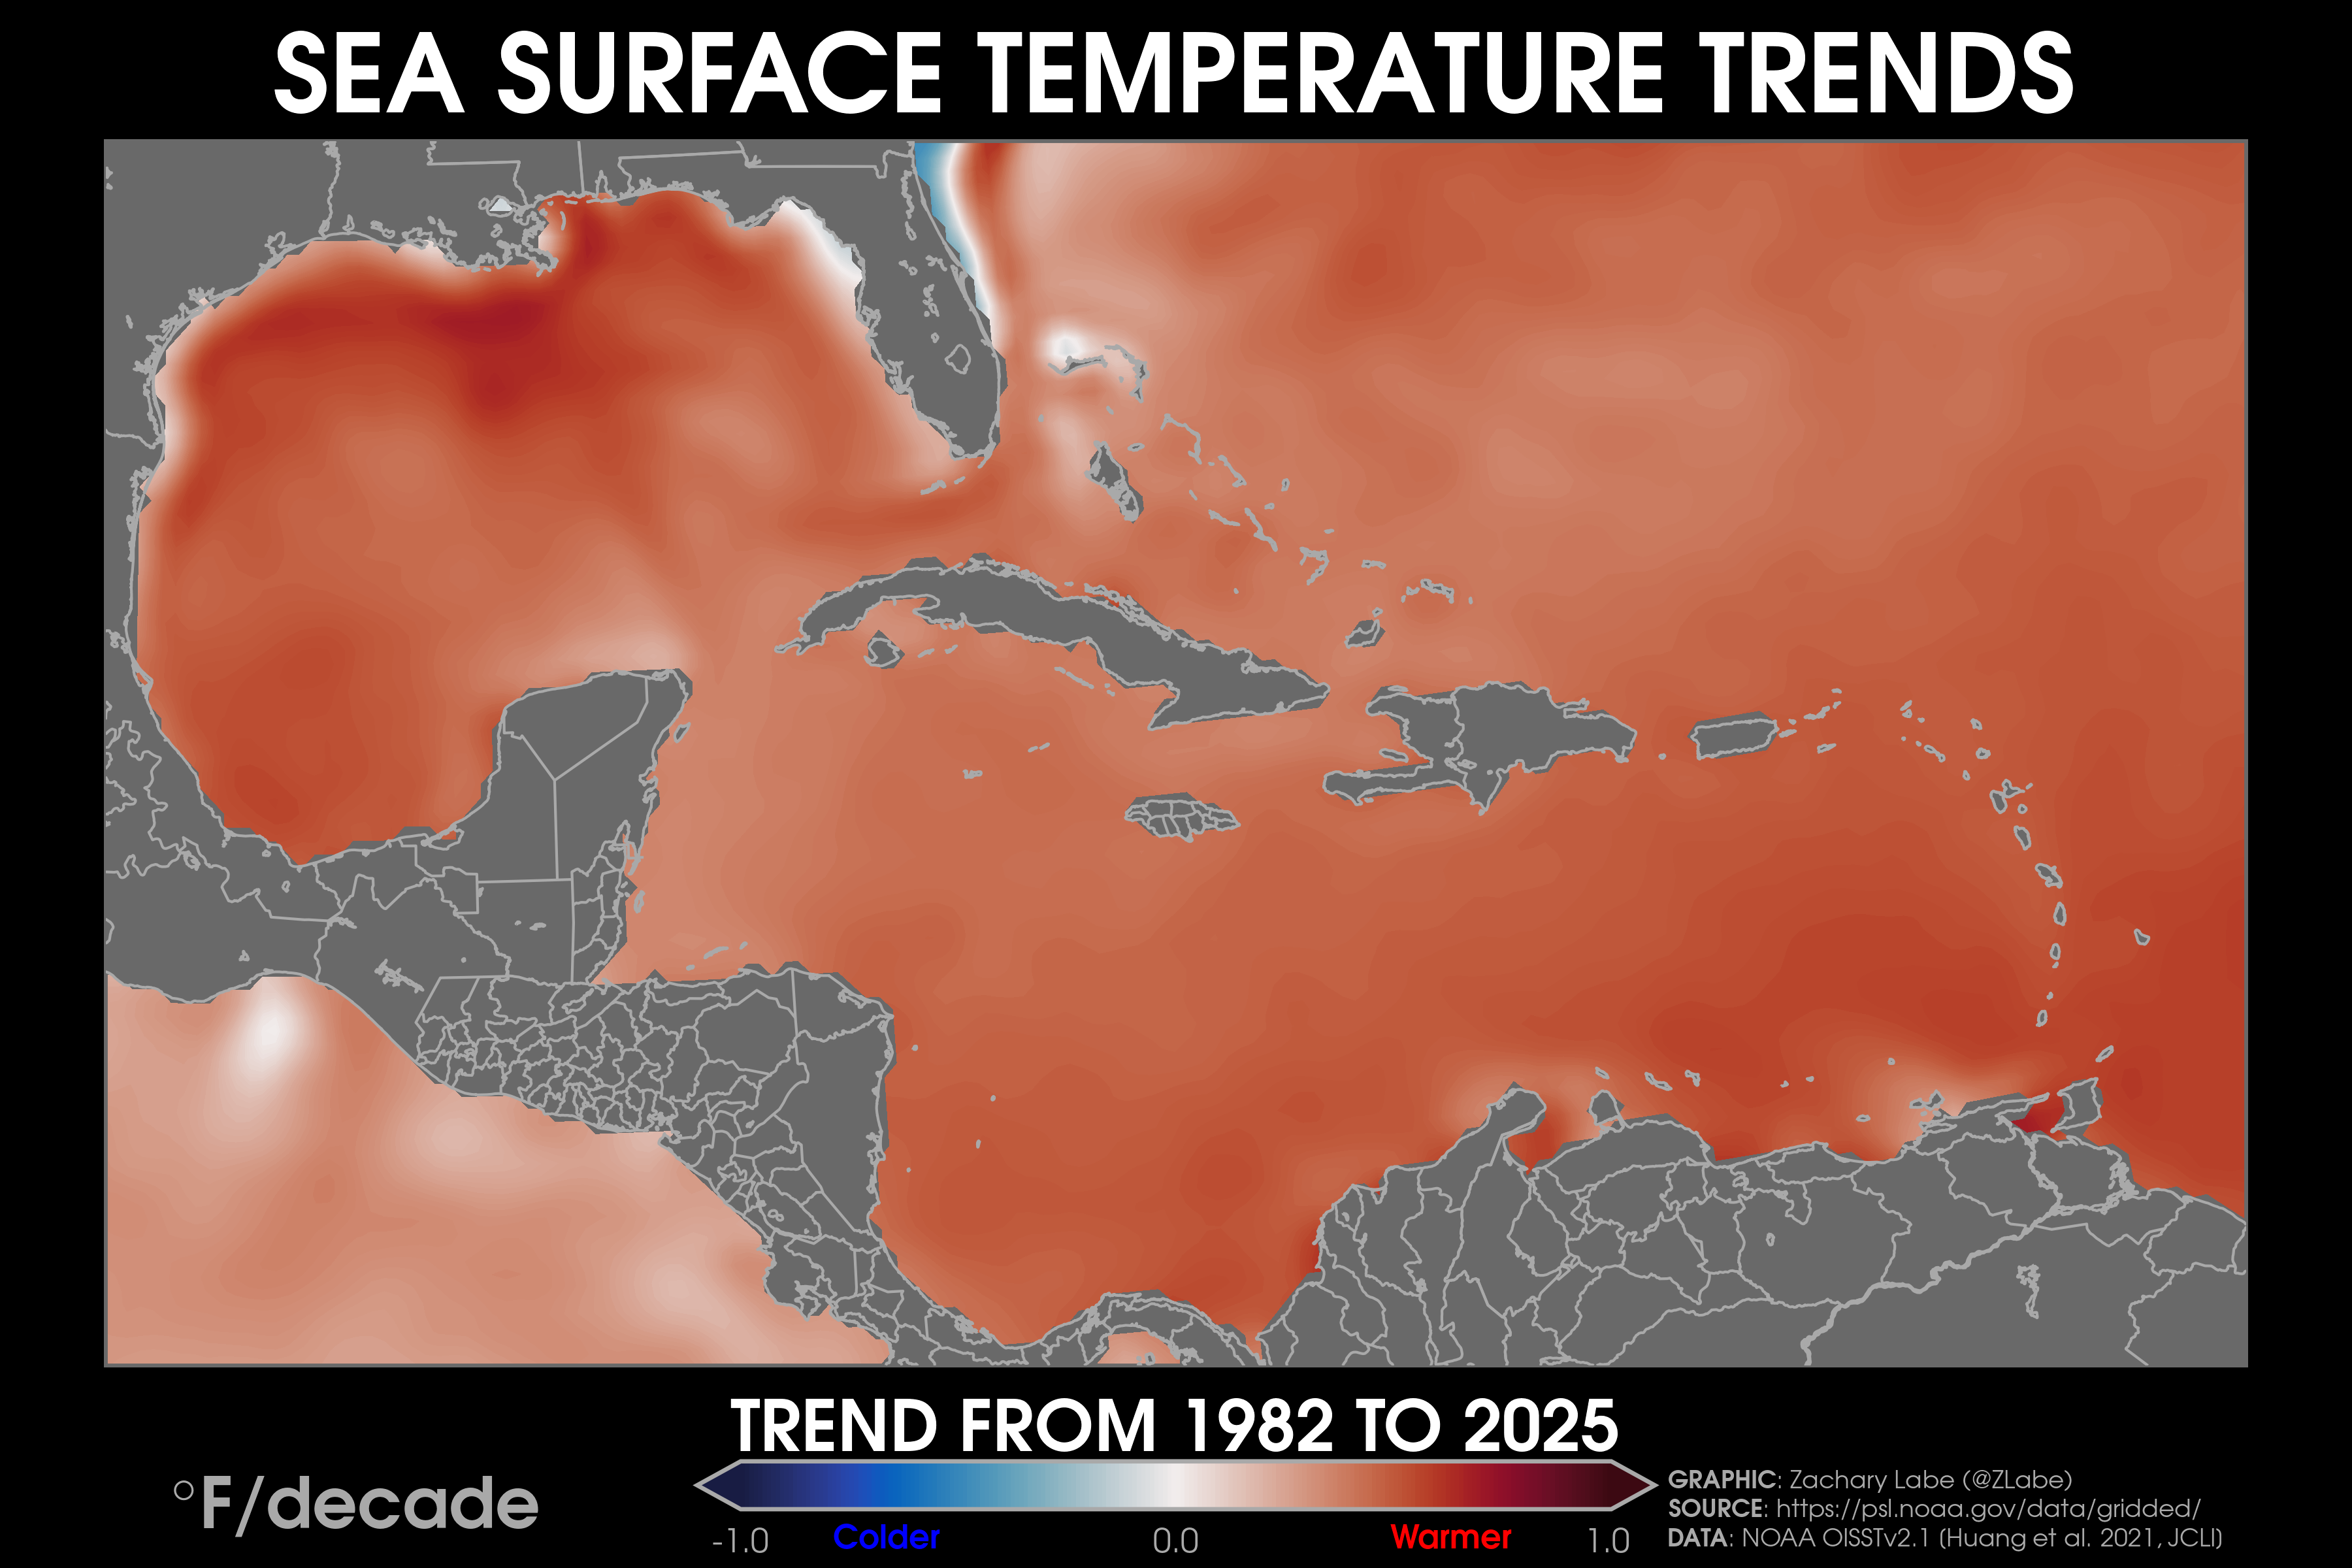
Sea Surface Temperature TrendsDecadal trends in annual mean sea surface temperatures around the contiguous United States from 1979 to 2025. Data are from NOAA Optimum Interpolation Sea Surface Temperature V2.1 (OISSTv21) (https://psl.noaa.gov/data/gridded/data.noaa.oisst.v2.highres.html). Graphic was updated on 1/4/2026.Animation of annual mean sea surface temperature anomalies around the contiguous United States (CONUS) for each year from 1982 to 2025. Data are from NOAA Optimum Interpolation Sea Surface Temperature V2.1 (OISSTv21) (https://psl.noaa.gov/data/gridded/data.noaa.oisst.v2.highres.html). Graphic was updated on 1/4/2026.Decadal trends in annual mean sea surface temperatures around Alaska from 1979 to 2025. Data are from NOAA Optimum Interpolation Sea Surface Temperature V2.1 (OISSTv21) (https://psl.noaa.gov/data/gridded/data.noaa.oisst.v2.highres.html). Graphic was updated on 1/4/2026.Decadal trends in annual mean sea surface temperatures around Hawaii from 1979 to 2025. Data are from NOAA Optimum Interpolation Sea Surface Temperature V2.1 (OISSTv21) (https://psl.noaa.gov/data/gridded/data.noaa.oisst.v2.highres.html). Graphic was updated on 1/4/2026.Decadal trends in annual mean sea surface temperatures around the Caribbean Sea from 1979 to 2025. Data are from NOAA Optimum Interpolation Sea Surface Temperature V2.1 (OISSTv21) (https://psl.noaa.gov/data/gridded/data.noaa.oisst.v2.highres.html). Graphic was updated on 1/4/2026.
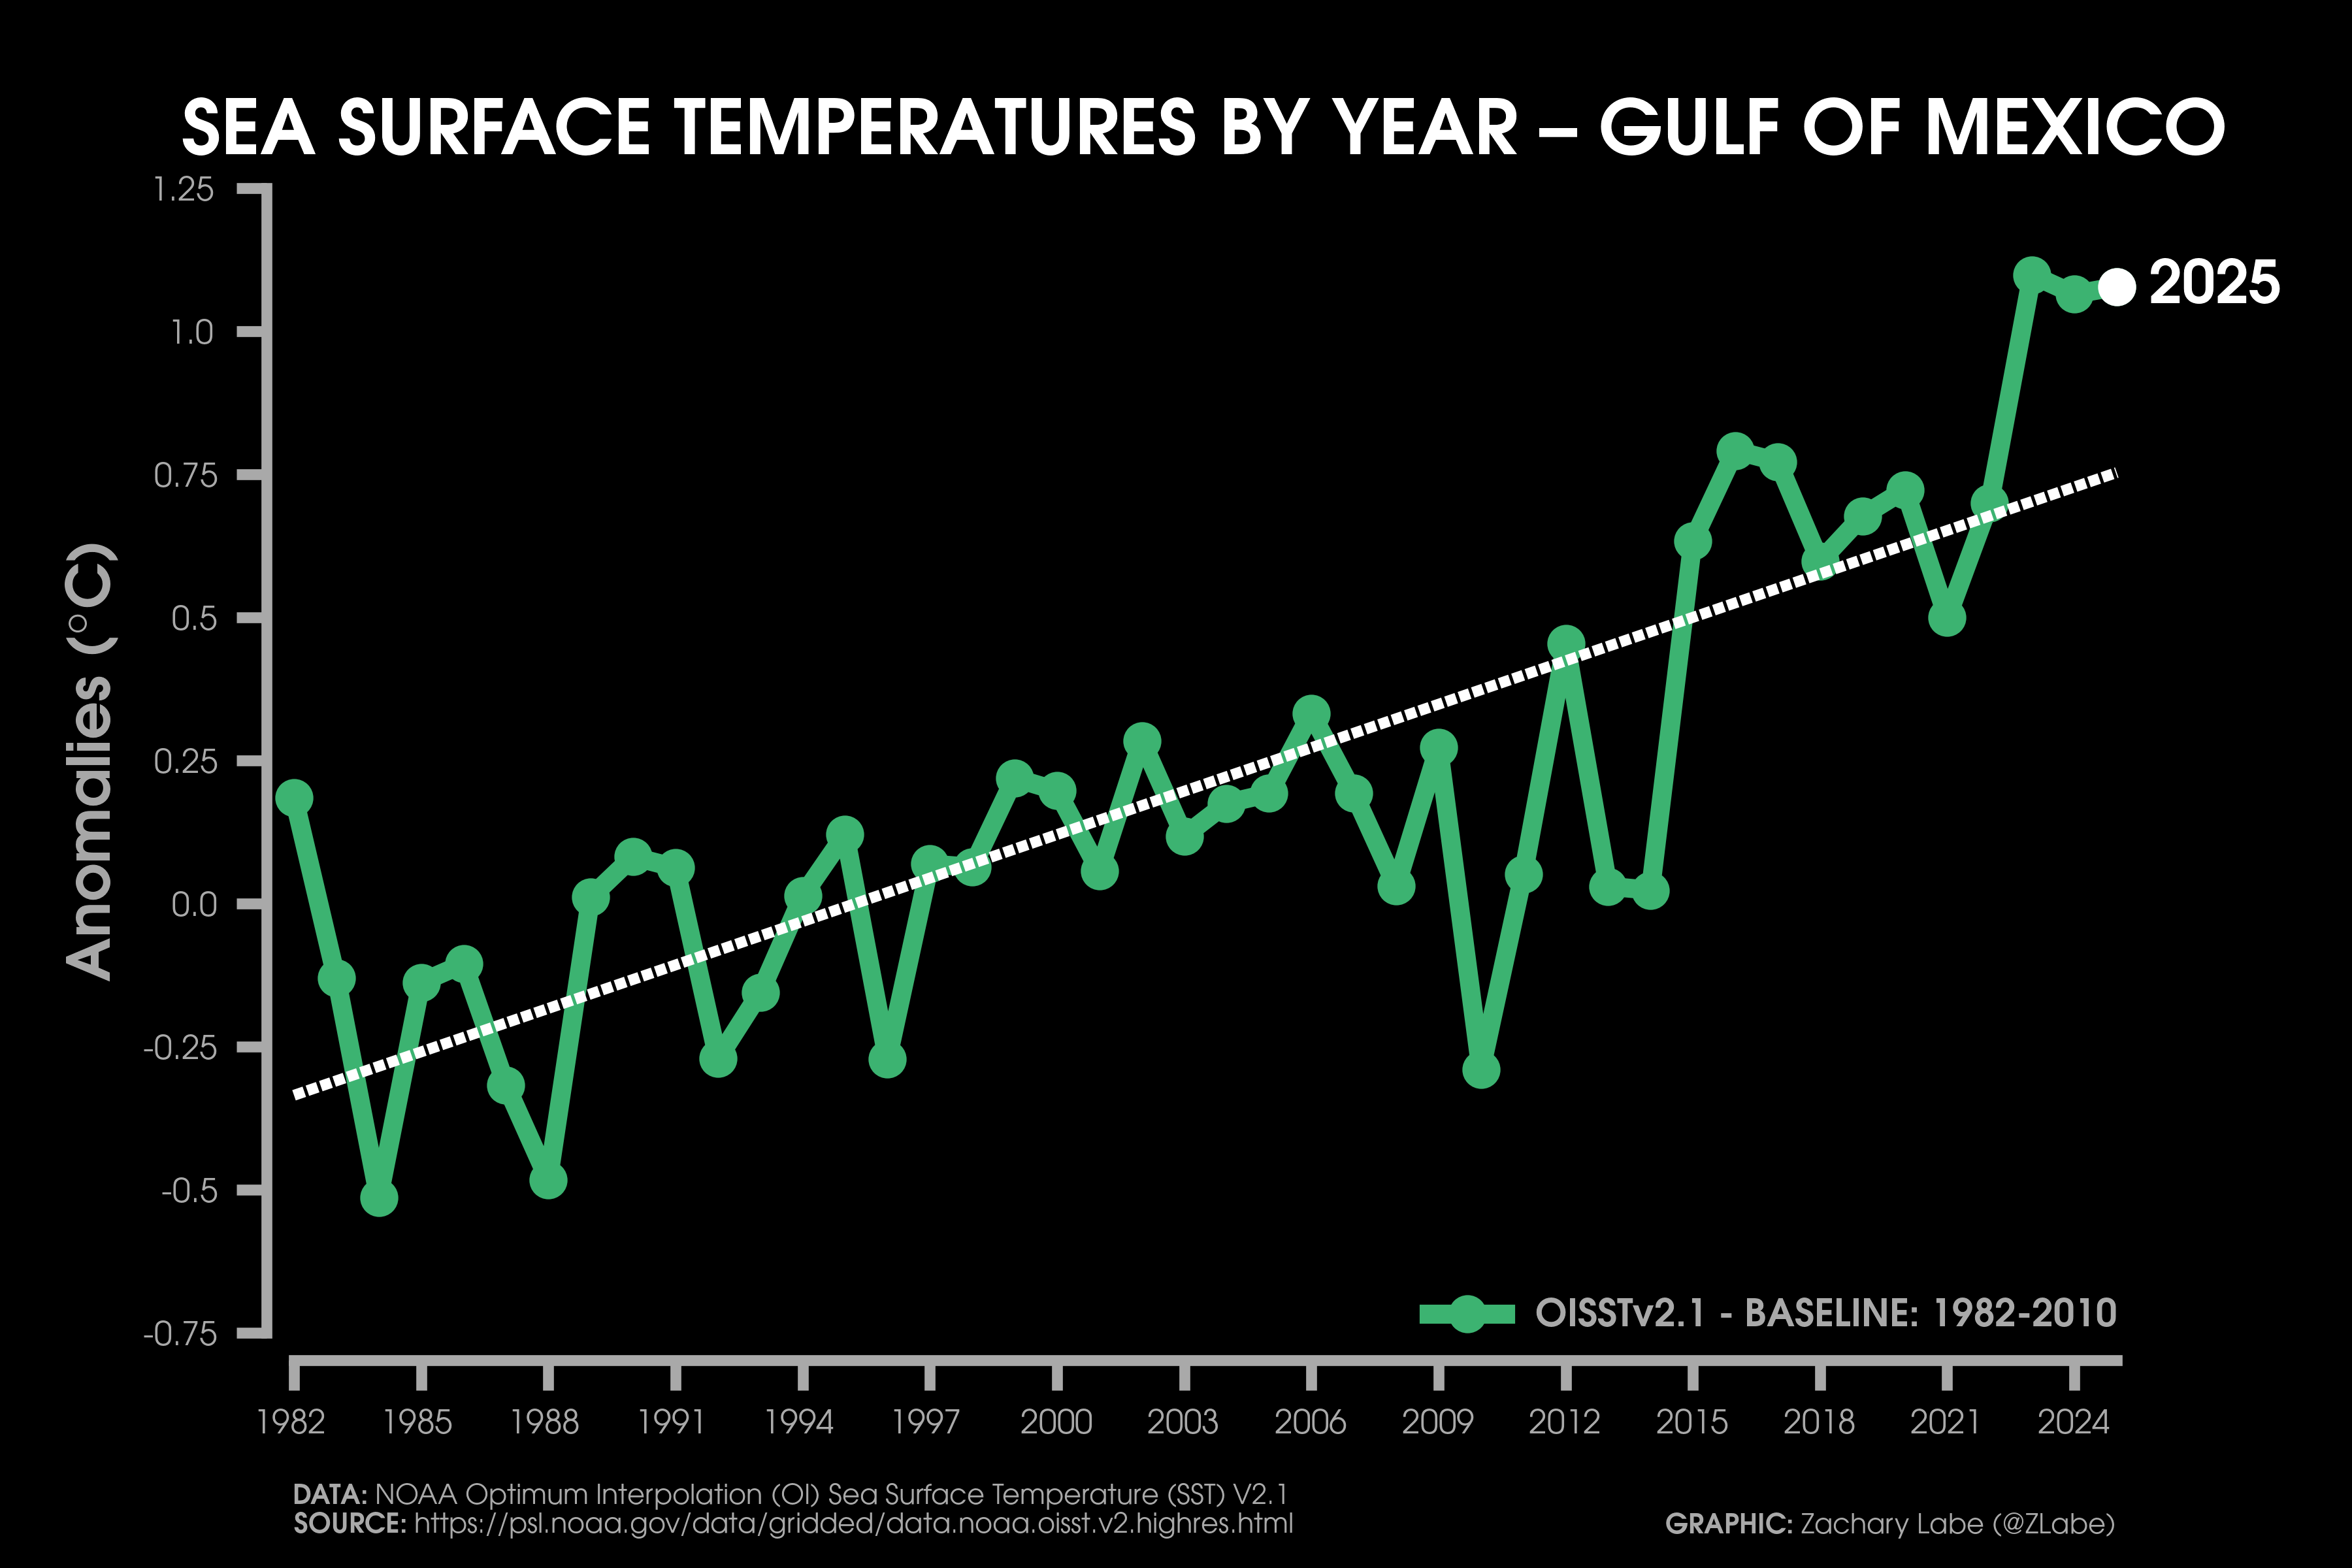
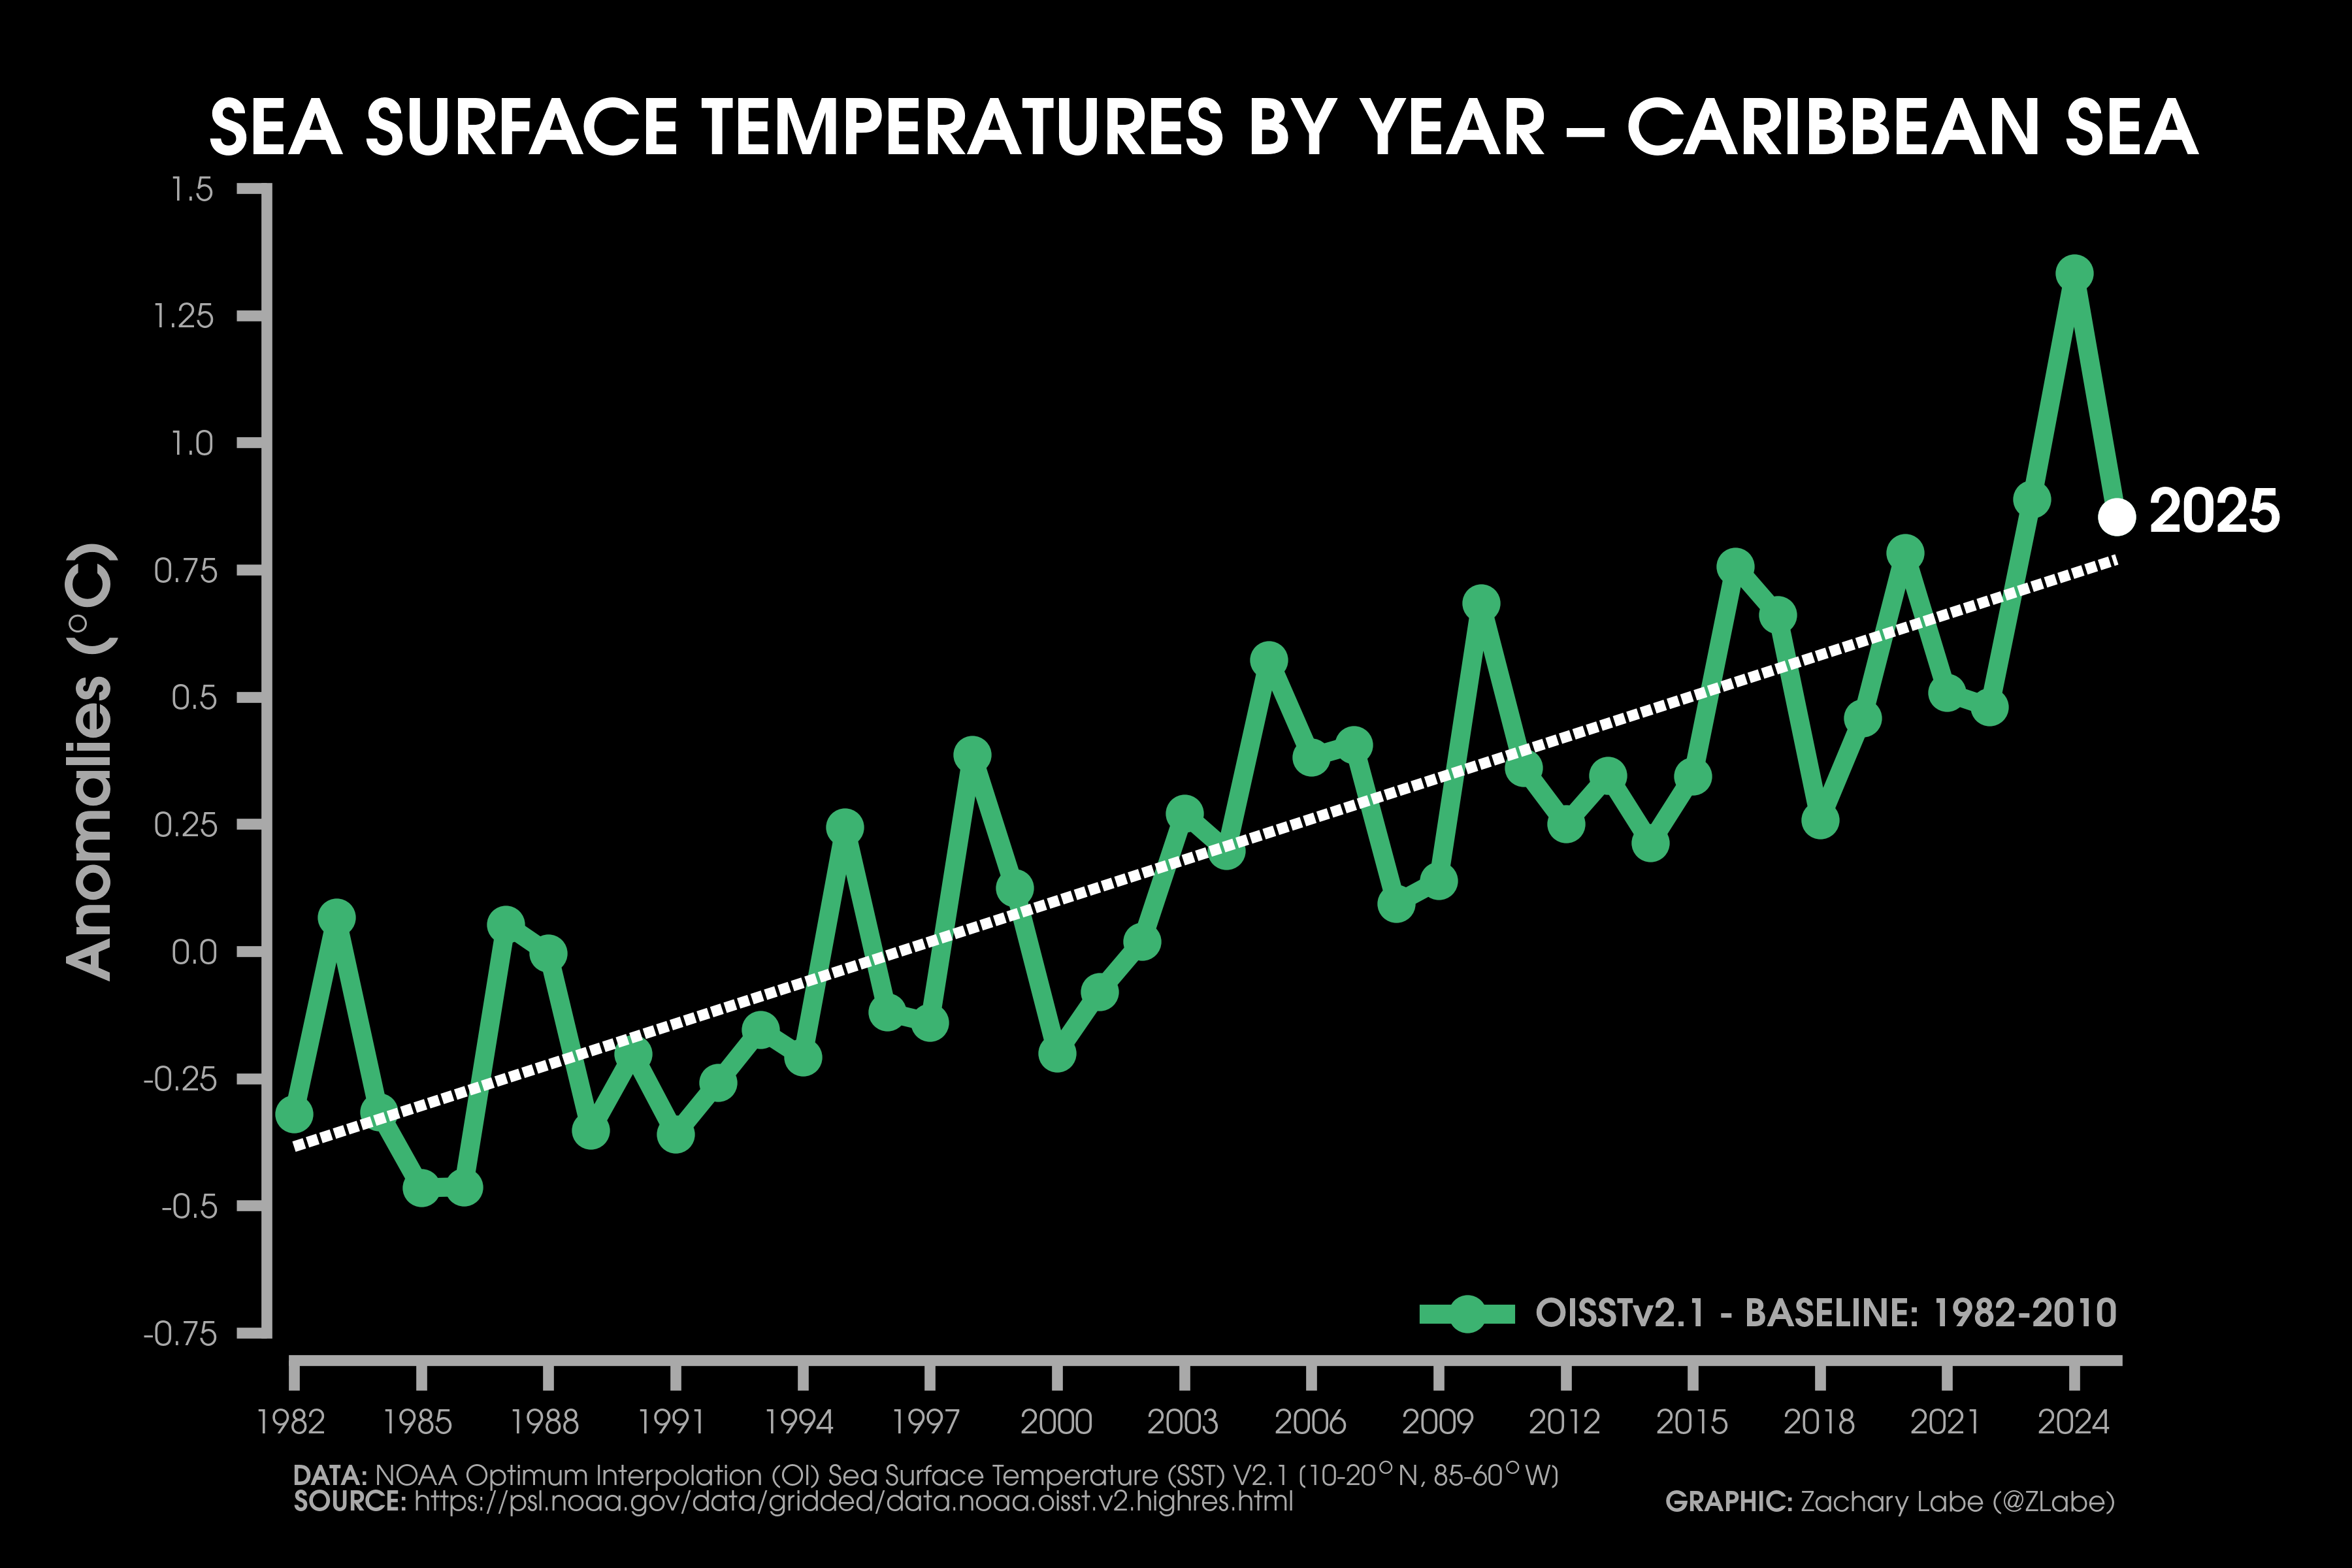
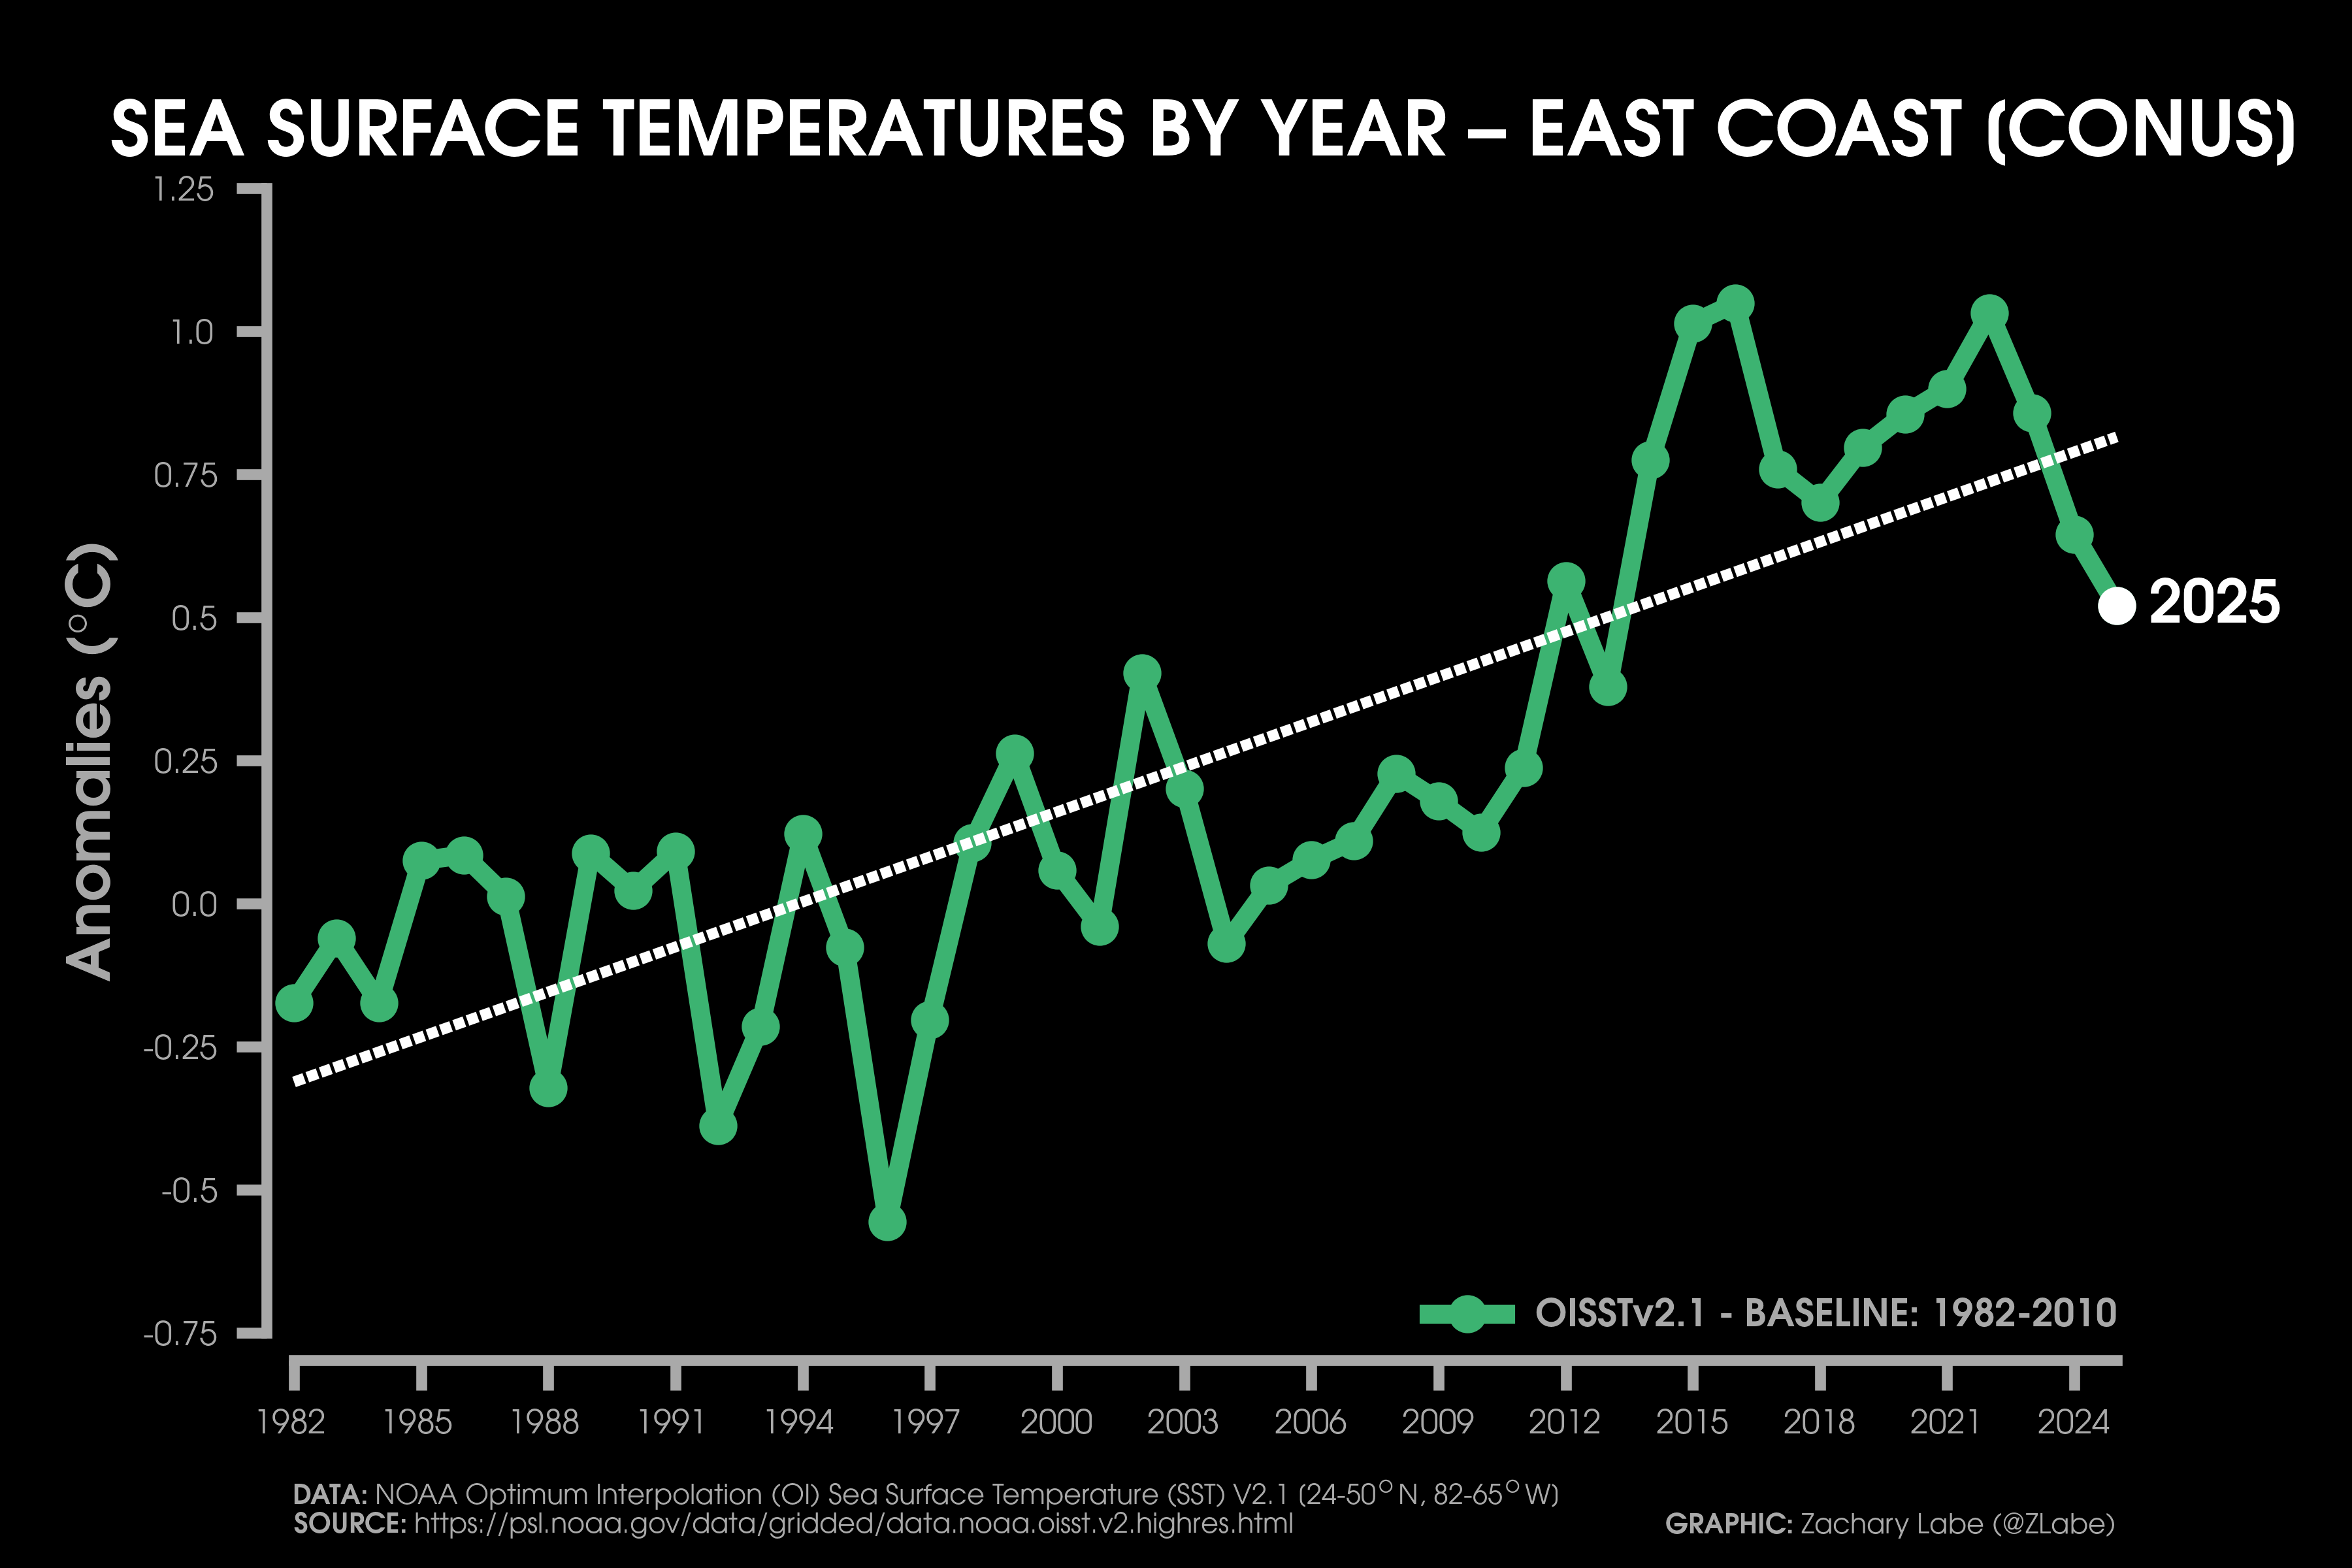
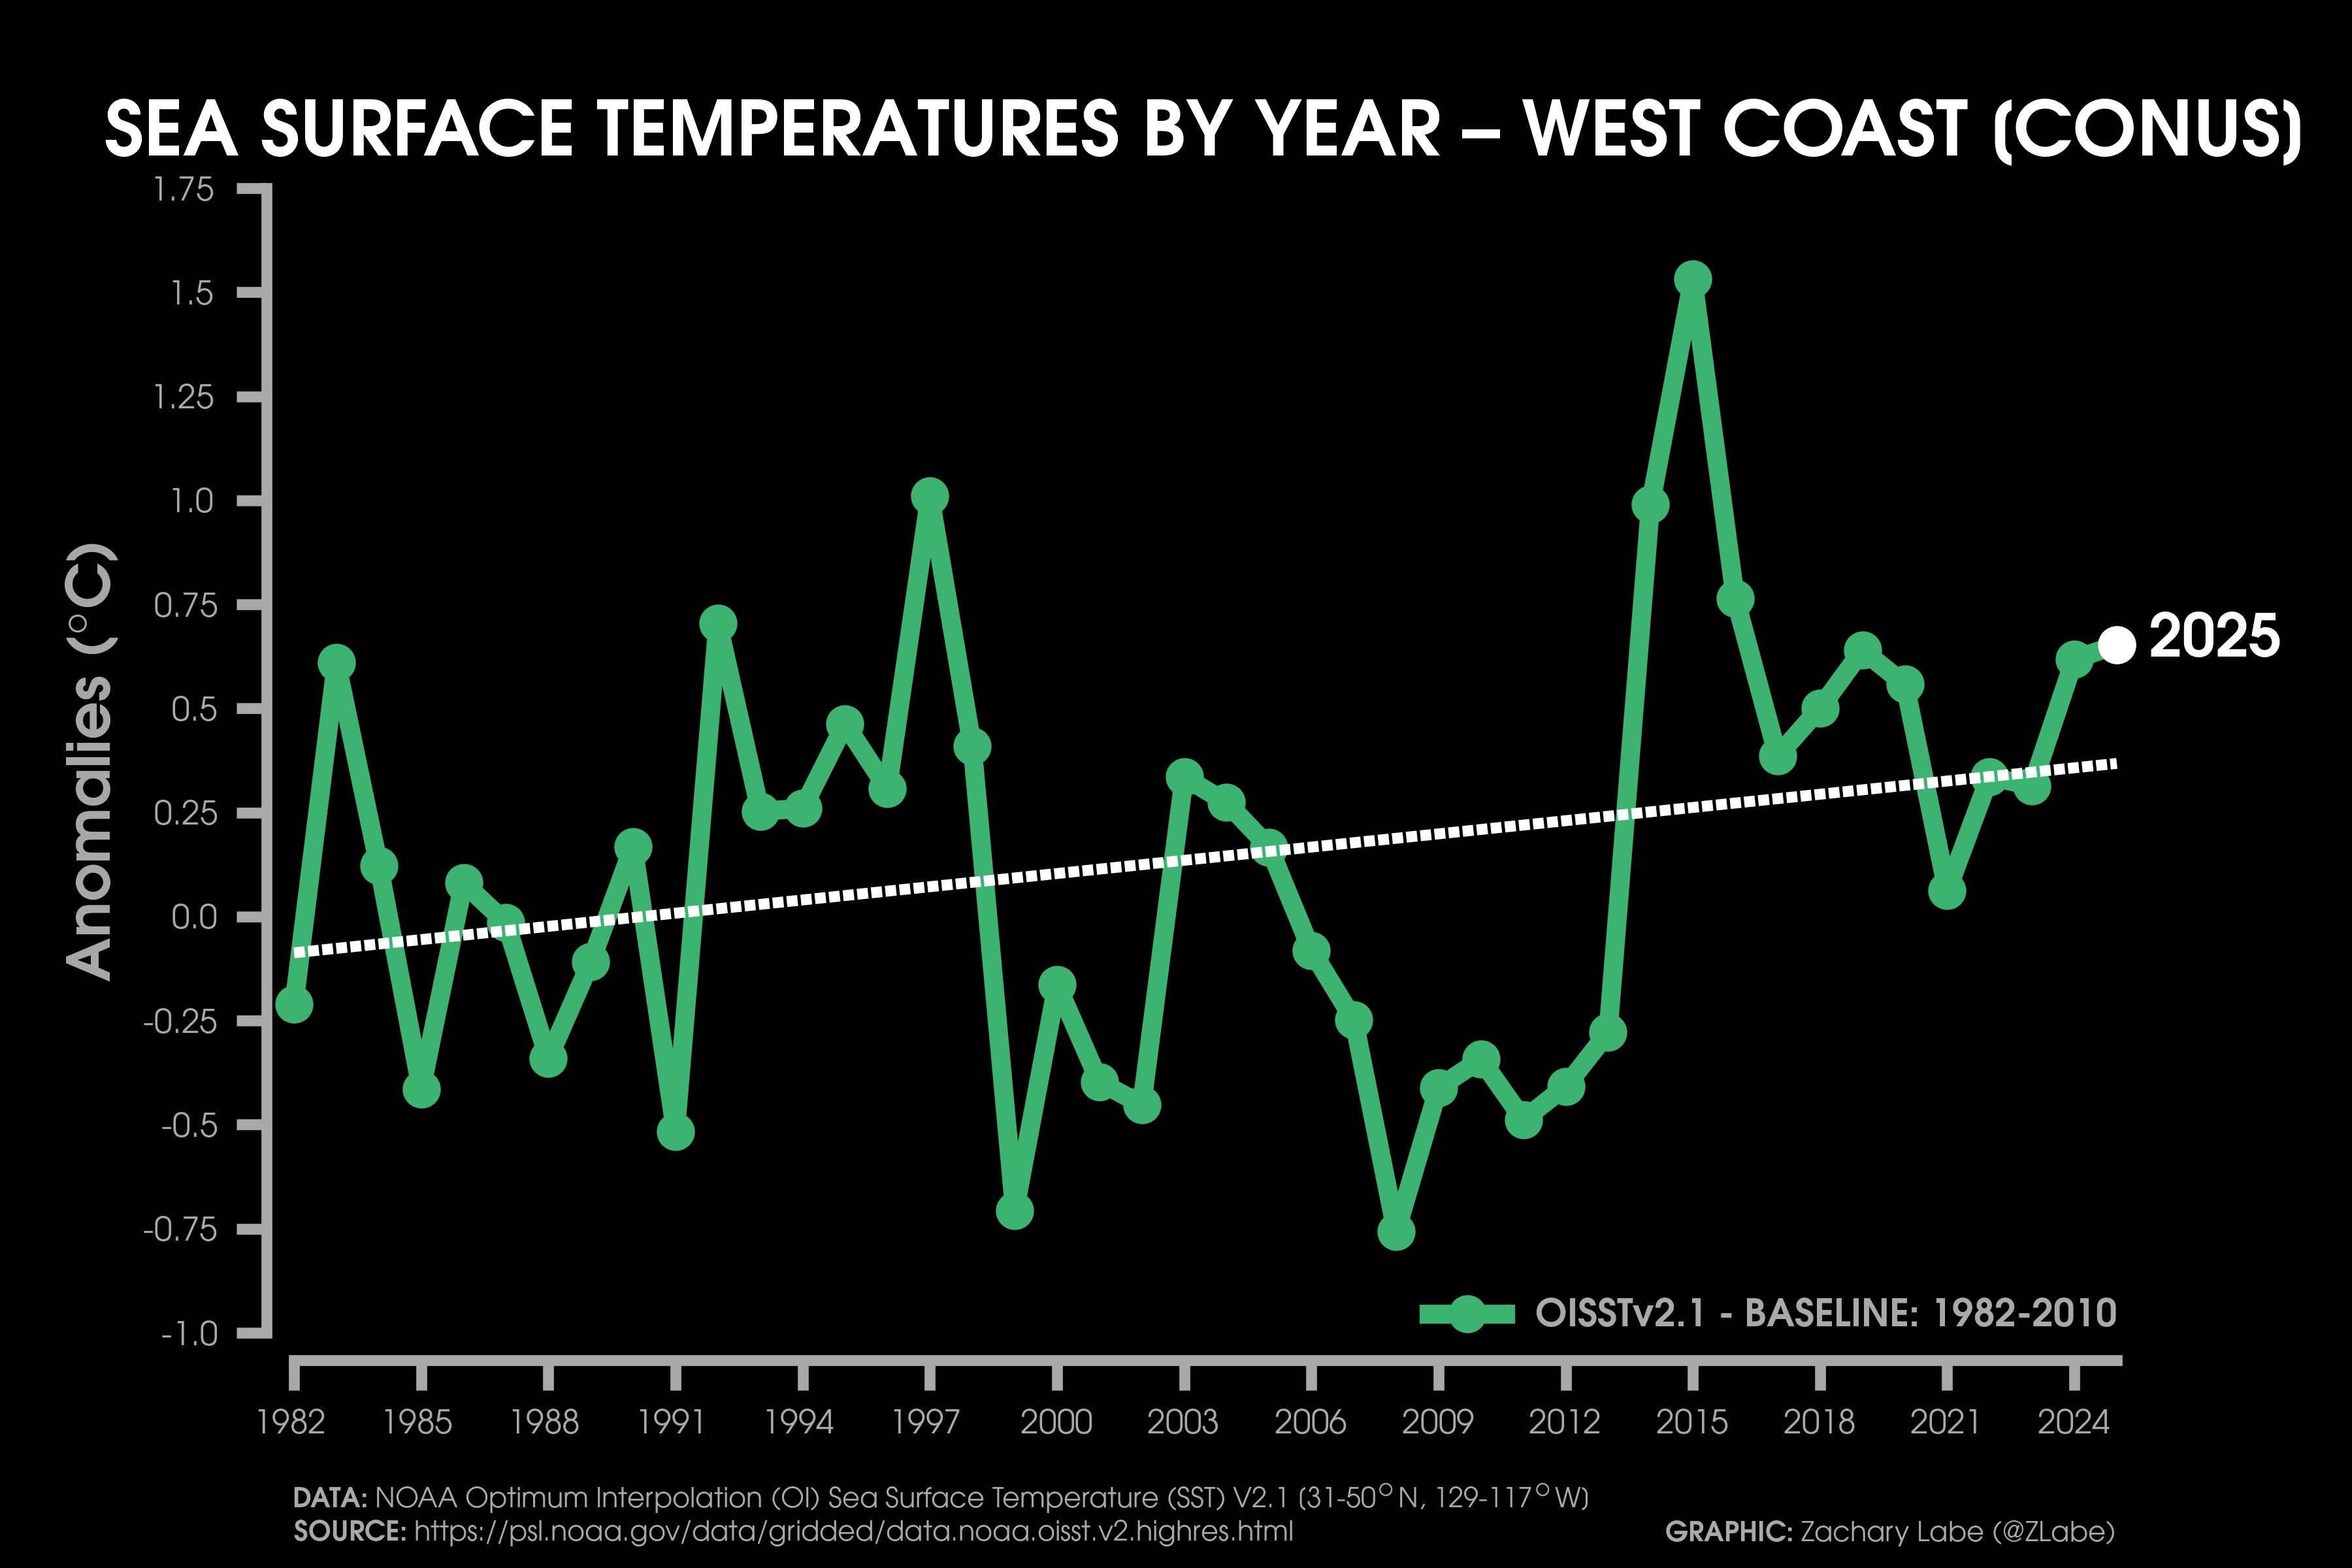
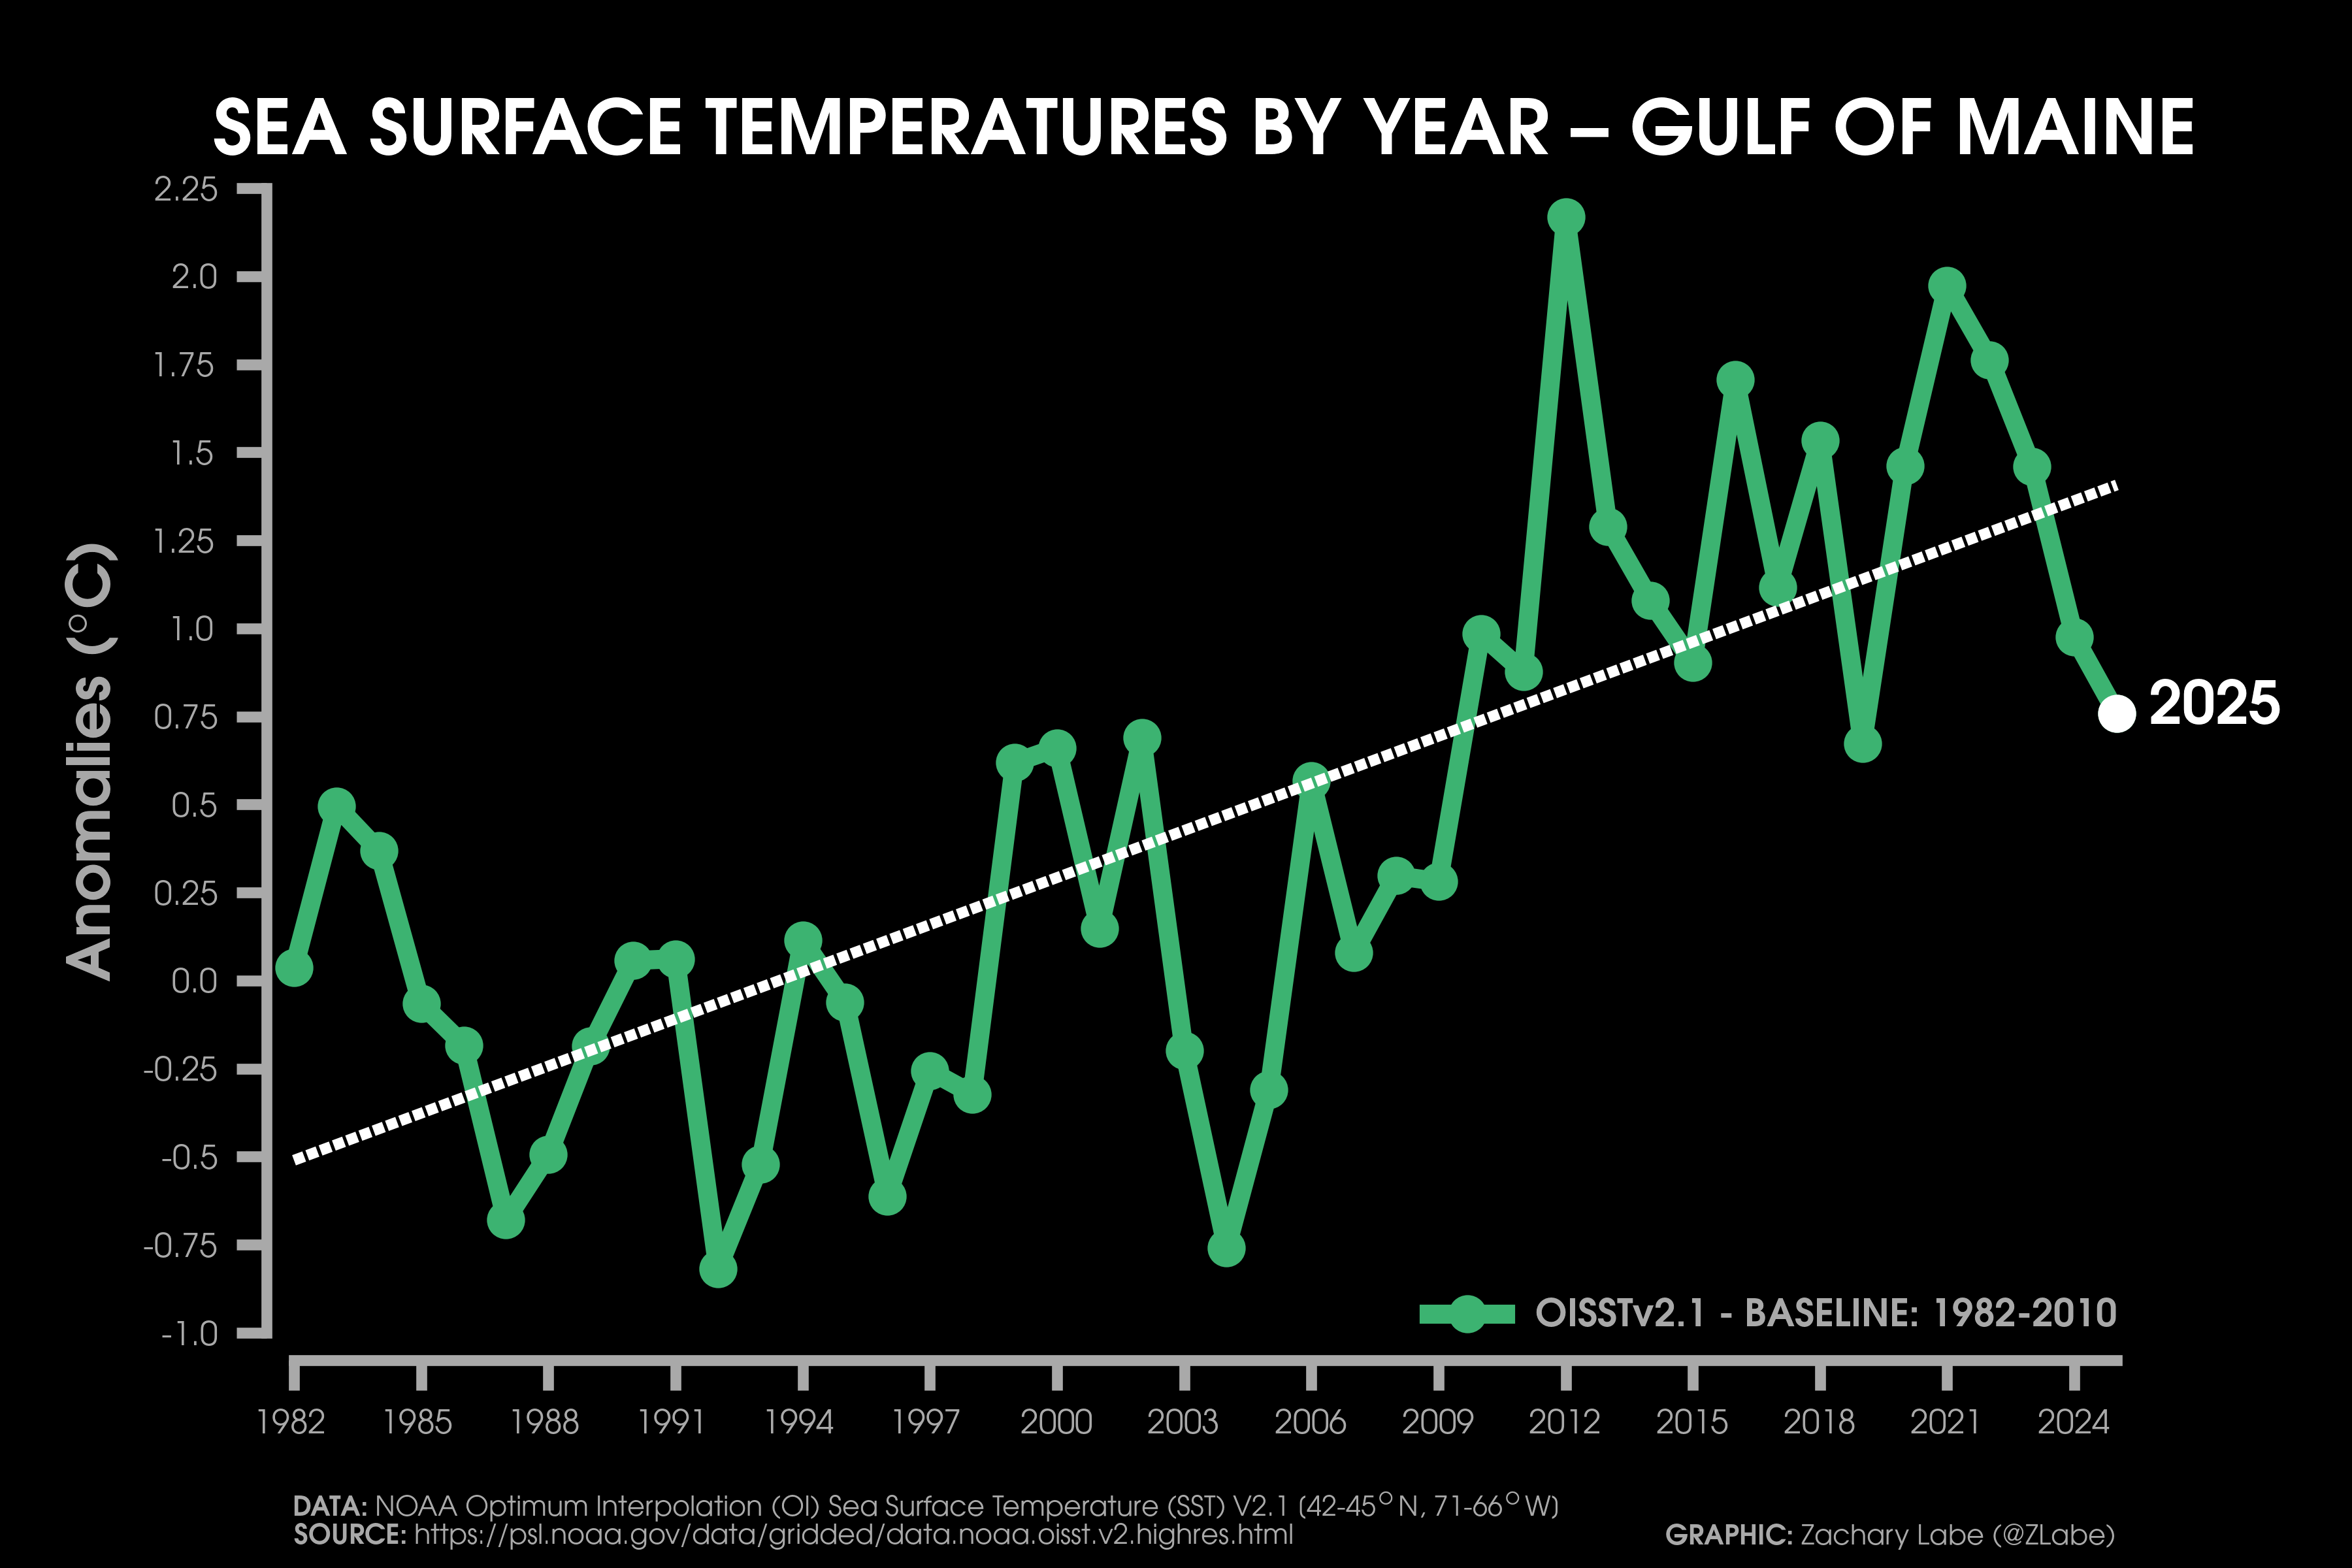
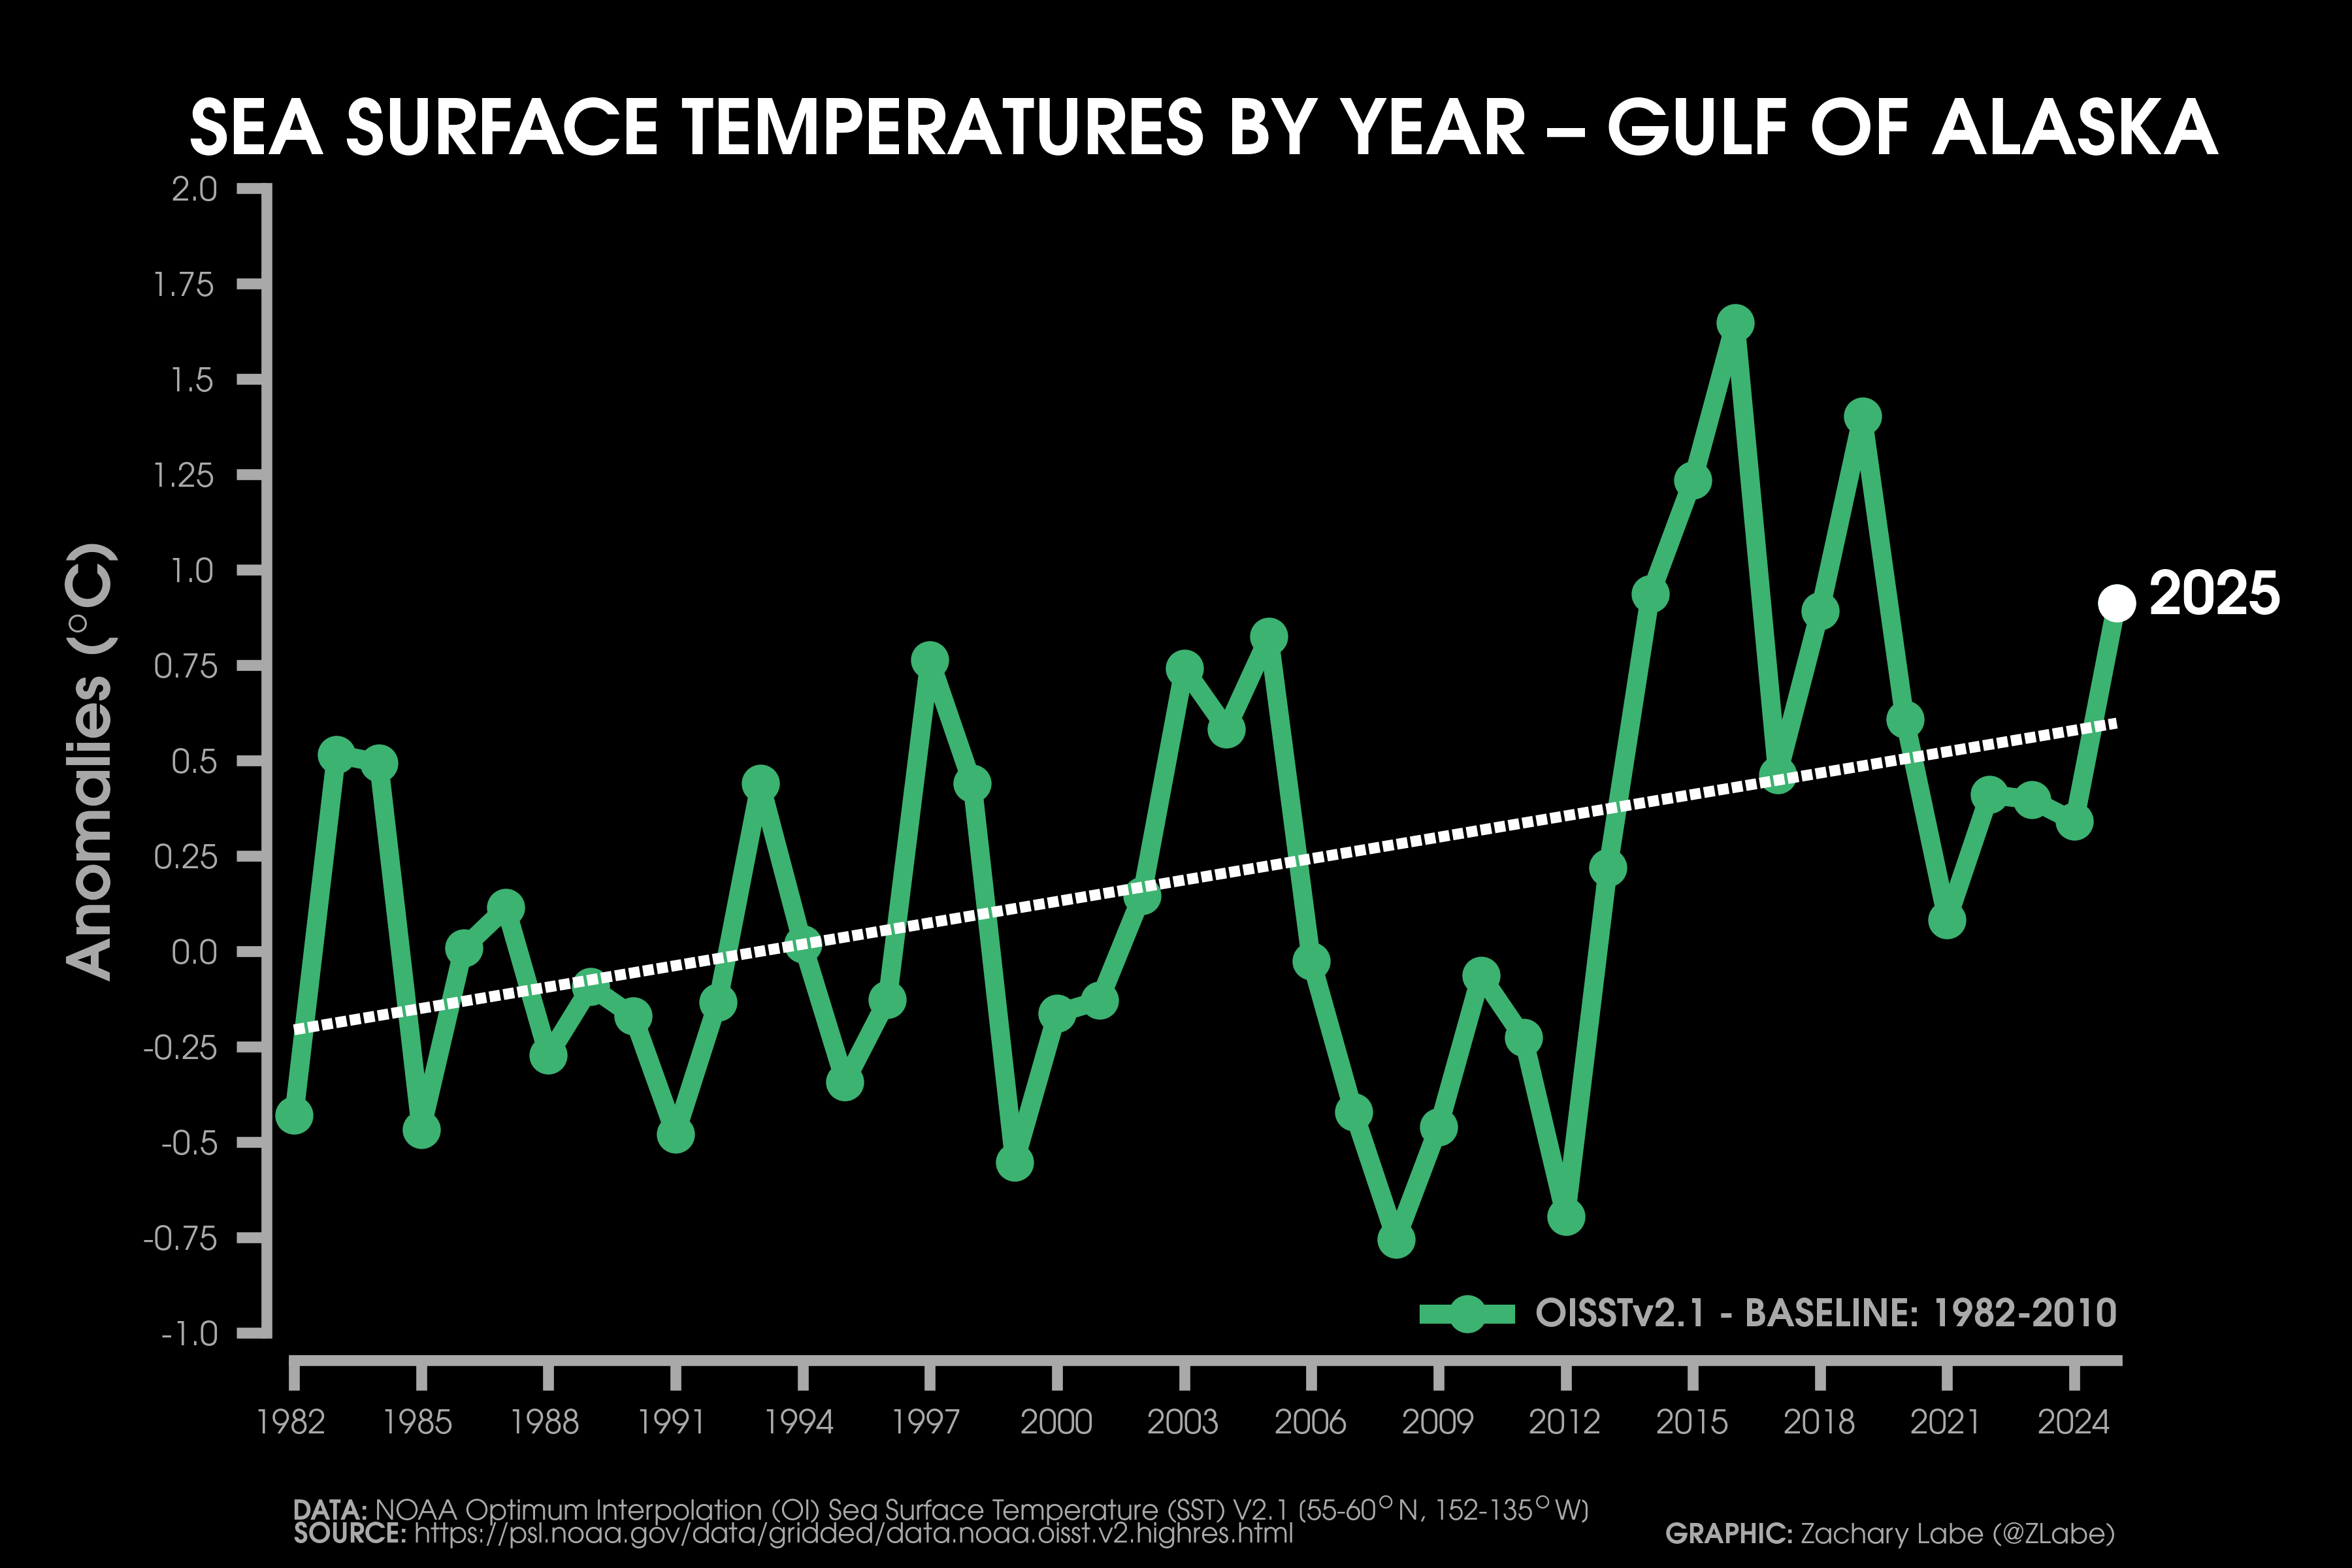
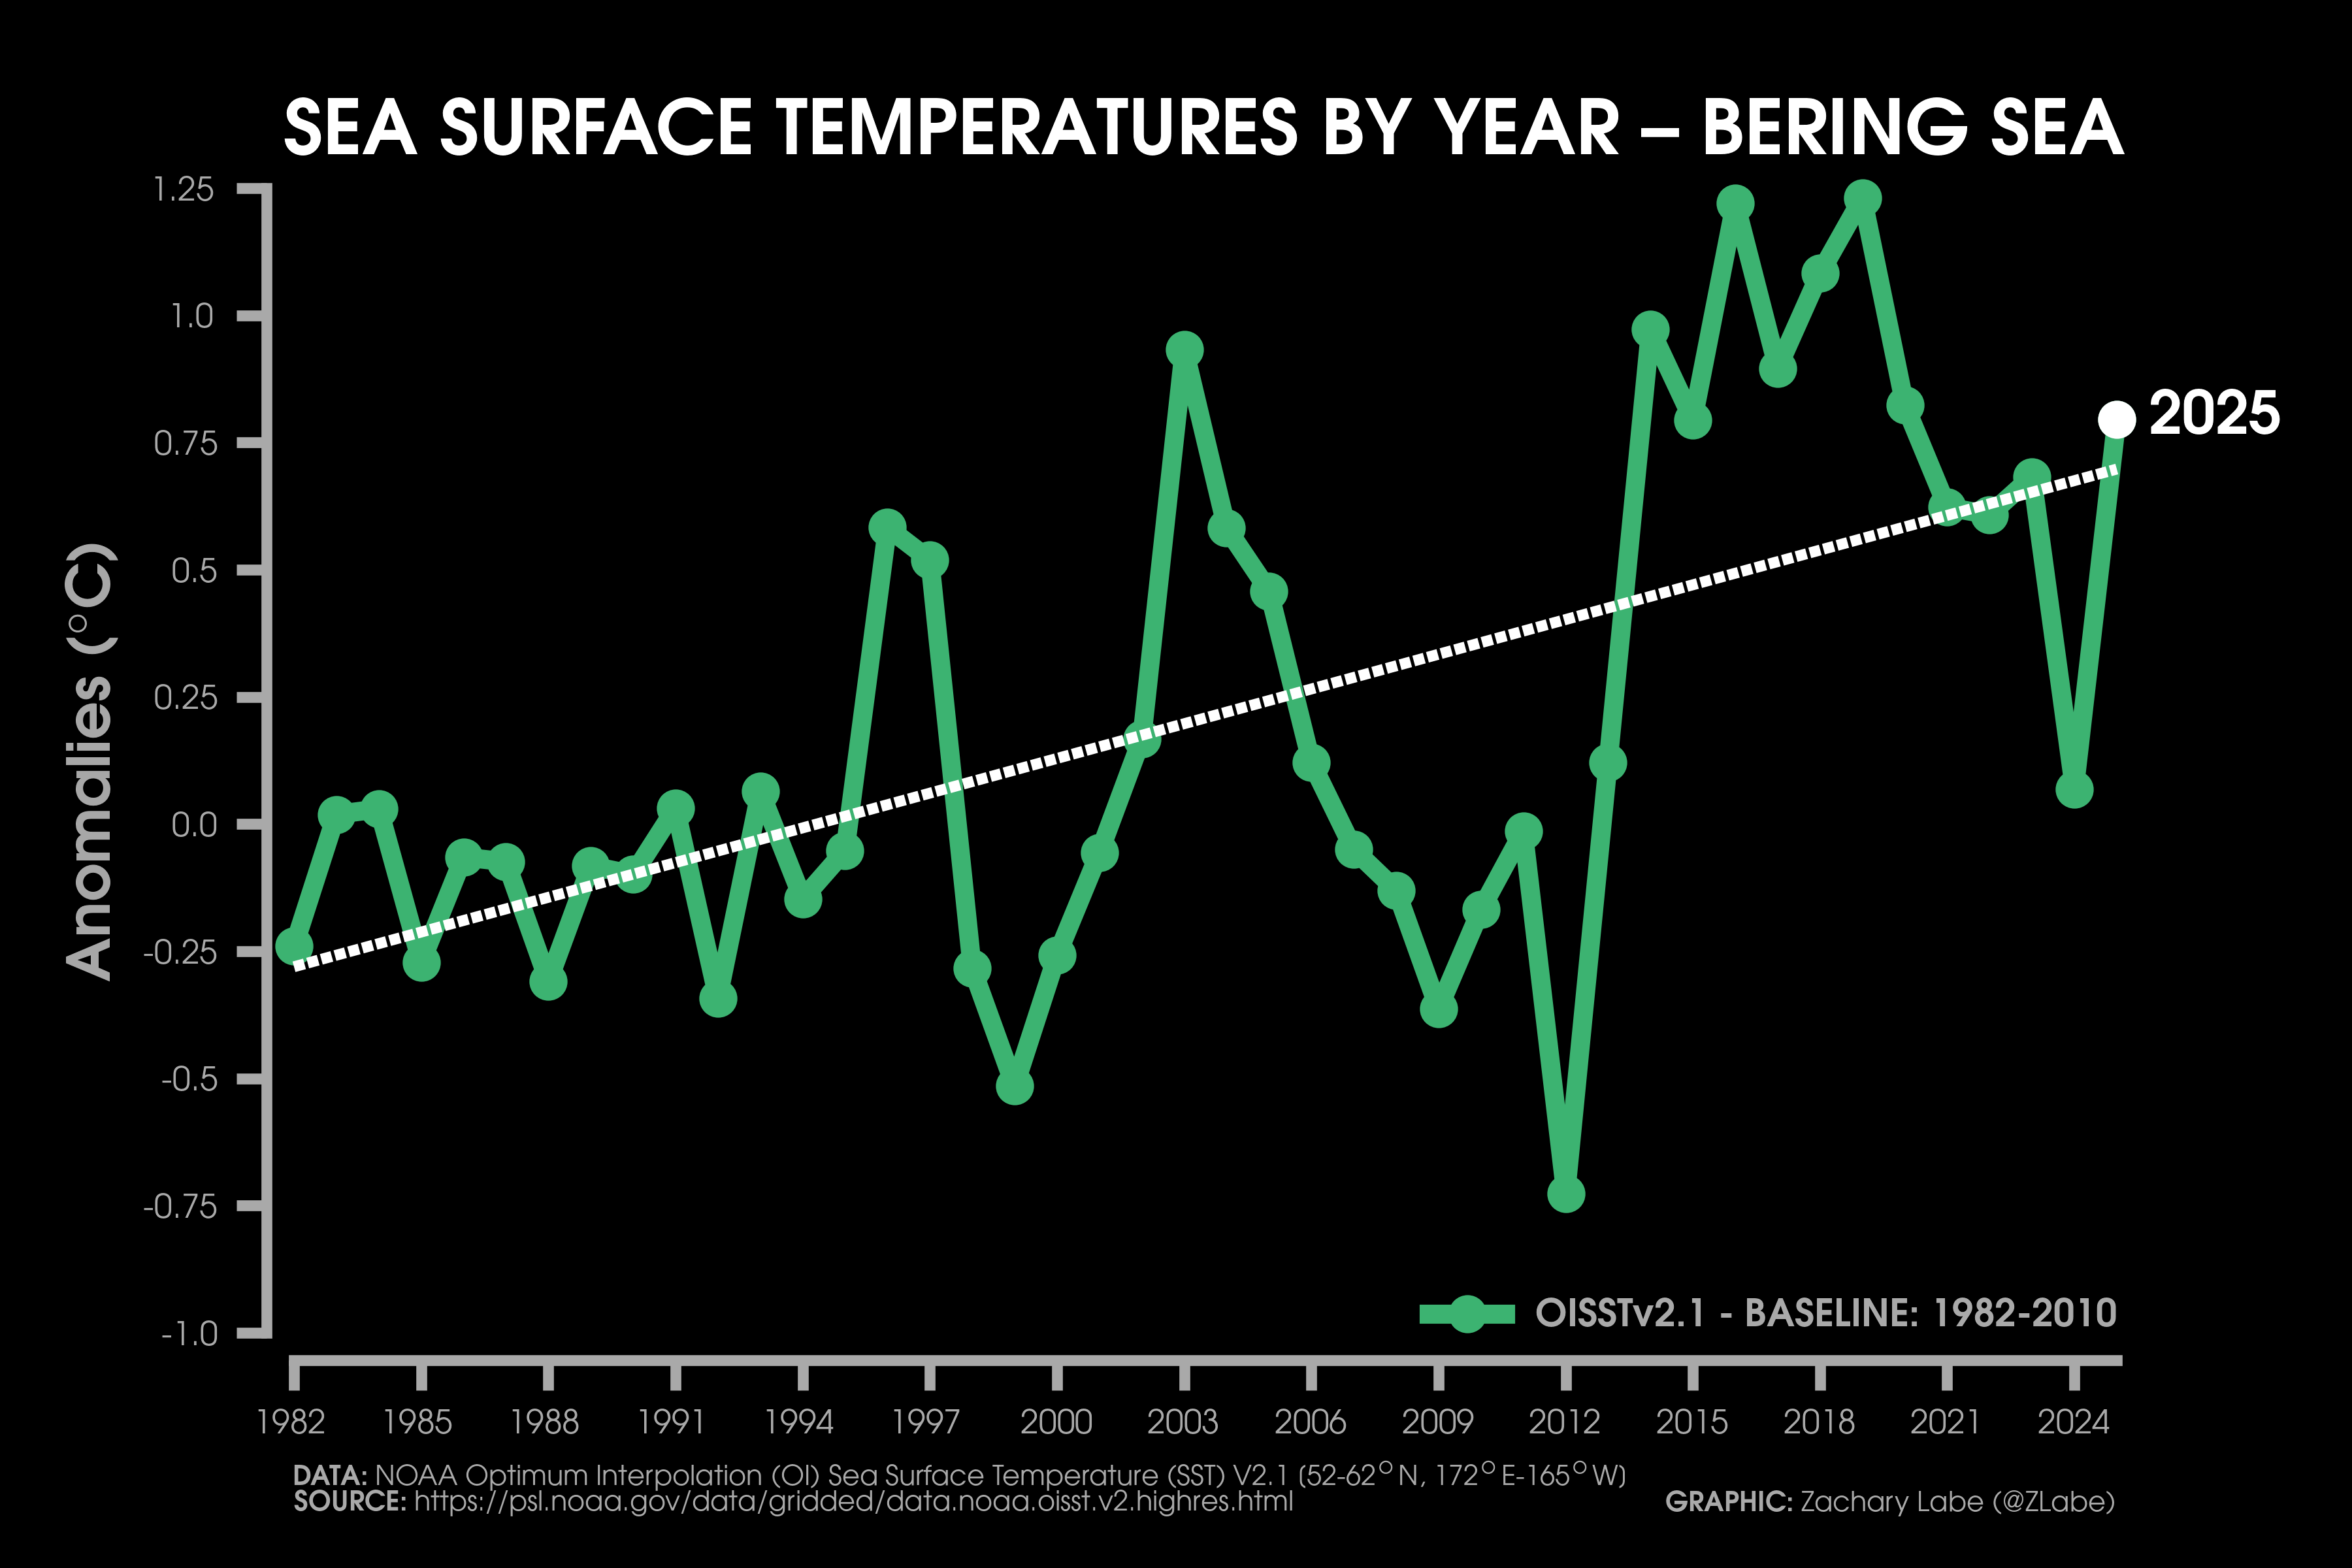
Sea Surface Temperature Time SeriesLine graph showing the annual mean sea surface temperature anomaly for each year from 1982 to 2025 for the Gulf of Mexico. Anomalies are calculated relative to a 1982-2010 reference period. Data is from NOAA Optimum Interpolation Sea Surface Temperature (V2.1; OISSTv21; https://psl.noaa.gov/data/gridded/data.noaa.oisst.v2.highres.html). The linear least squares trend line is also displayed over this period. Graphic was updated on 1/4/2026.Line graph showing the annual mean sea surface temperature anomaly for each year from 1982 to 2025 for the Caribbean Sea. Anomalies are calculated relative to a 1982-2010 reference period. Data is from NOAA Optimum Interpolation Sea Surface Temperature (V2.1; OISSTv21; https://psl.noaa.gov/data/gridded/data.noaa.oisst.v2.highres.html). The linear least squares trend line is also displayed over this period. Graphic was updated on 1/18/2026.Line graph showing the annual mean sea surface temperature anomaly for each year from 1982 to 2025 for around the East Coast of the contiguous United States (CONUS). Anomalies are calculated relative to a 1982-2010 reference period. Data is from NOAA Optimum Interpolation Sea Surface Temperature (V2.1; OISSTv21; https://psl.noaa.gov/data/gridded/data.noaa.oisst.v2.highres.html). The linear least squares trend line is also displayed over this period. Graphic was updated on 1/18/2026.Line graph showing the annual mean sea surface temperature anomaly for each year from 1982 to 2025 for around the West Coast of the contiguous United States (CONUS). Anomalies are calculated relative to a 1982-2010 reference period. Data is from NOAA Optimum Interpolation Sea Surface Temperature (V2.1; OISSTv21; https://psl.noaa.gov/data/gridded/data.noaa.oisst.v2.highres.html). The linear least squares trend line is also displayed over this period. Graphic was updated on 1/18/2026.Line graph showing the annual mean sea surface temperature anomaly for each year from 1982 to 2025 for the Gulf of Maine. Anomalies are calculated relative to a 1982-2010 reference period. Data is from NOAA Optimum Interpolation Sea Surface Temperature (V2.1; OISSTv21; https://psl.noaa.gov/data/gridded/data.noaa.oisst.v2.highres.html). The linear least squares trend line is also displayed over this period. Graphic was updated on 1/18/2026.Line graph showing the annual mean sea surface temperature anomaly for each year from 1982 to 2025 for the Gulf of Alaska. Anomalies are calculated relative to a 1982-2010 reference period. Data is from NOAA Optimum Interpolation Sea Surface Temperature (V2.1; OISSTv21; https://psl.noaa.gov/data/gridded/data.noaa.oisst.v2.highres.html). The linear least squares trend line is also displayed over this period. Graphic was updated on 1/18/2026.Line graph showing the annual mean sea surface temperature anomaly for each year from 1982 to 2025 for the Bering Sea. Anomalies are calculated relative to a 1982-2010 reference period. Data is from NOAA Optimum Interpolation Sea Surface Temperature (V2.1; OISSTv21; https://psl.noaa.gov/data/gridded/data.noaa.oisst.v2.highres.html). The linear least squares trend line is also displayed over this period. Graphic was updated on 1/18/2026.
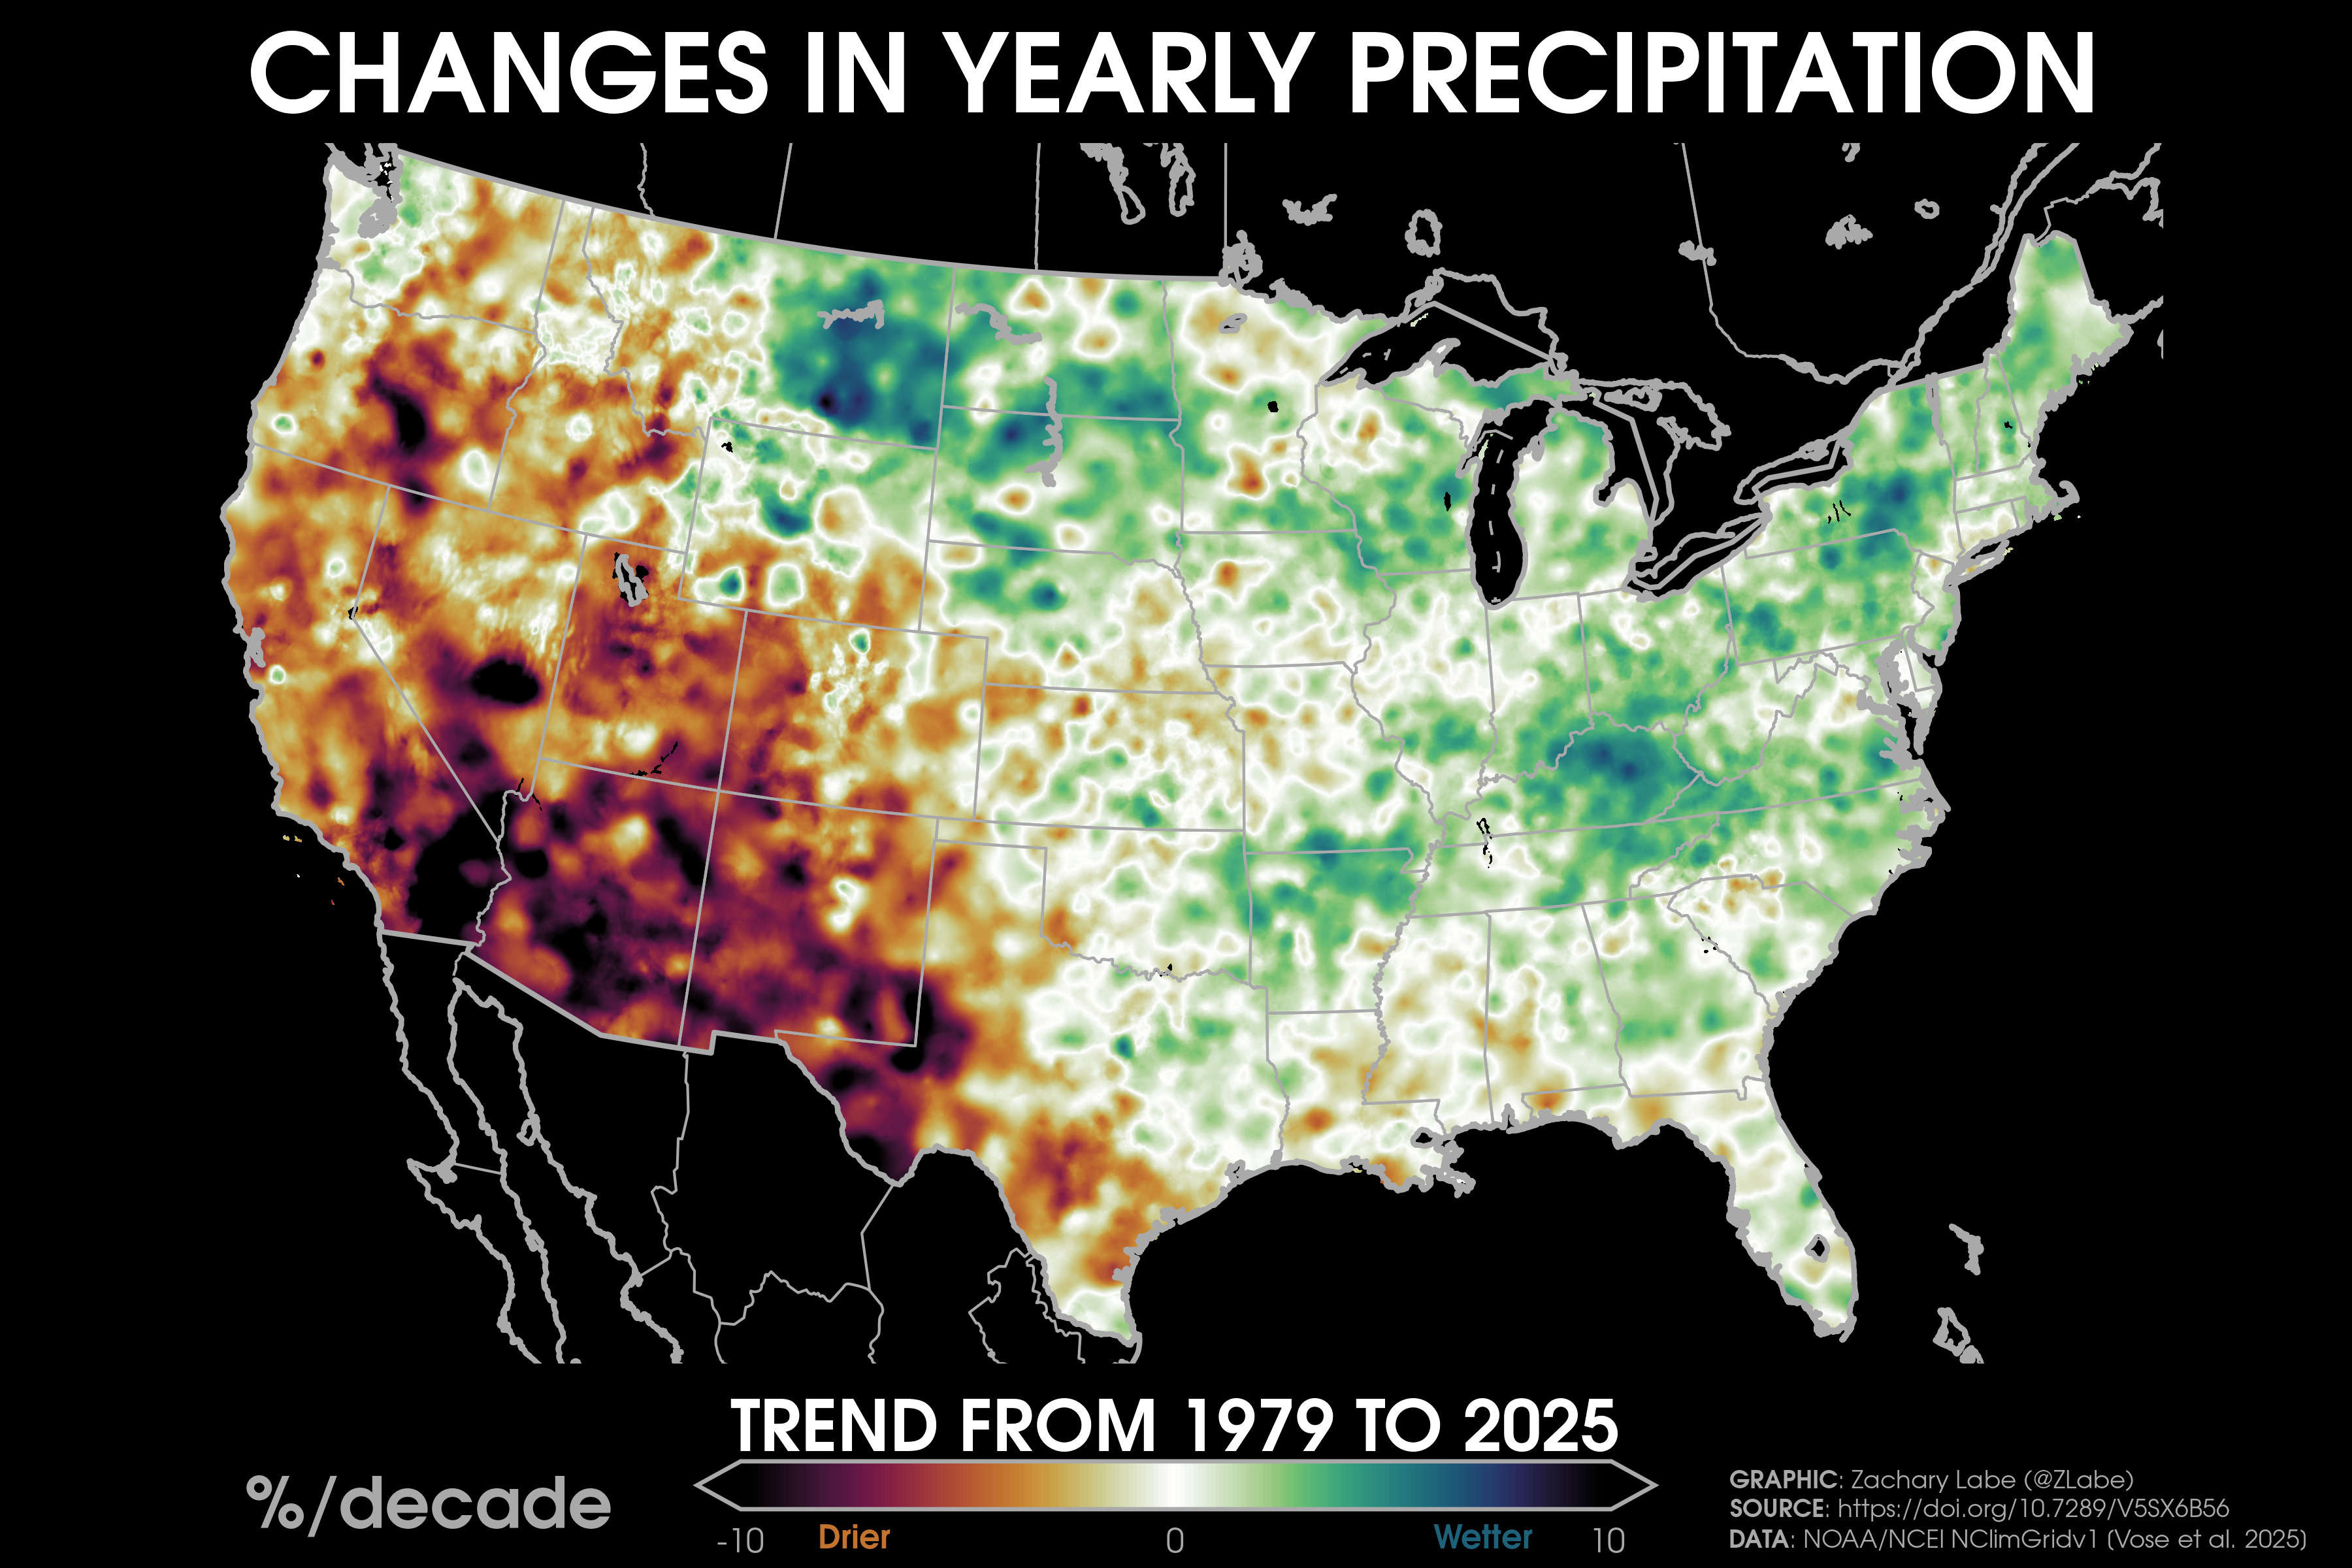
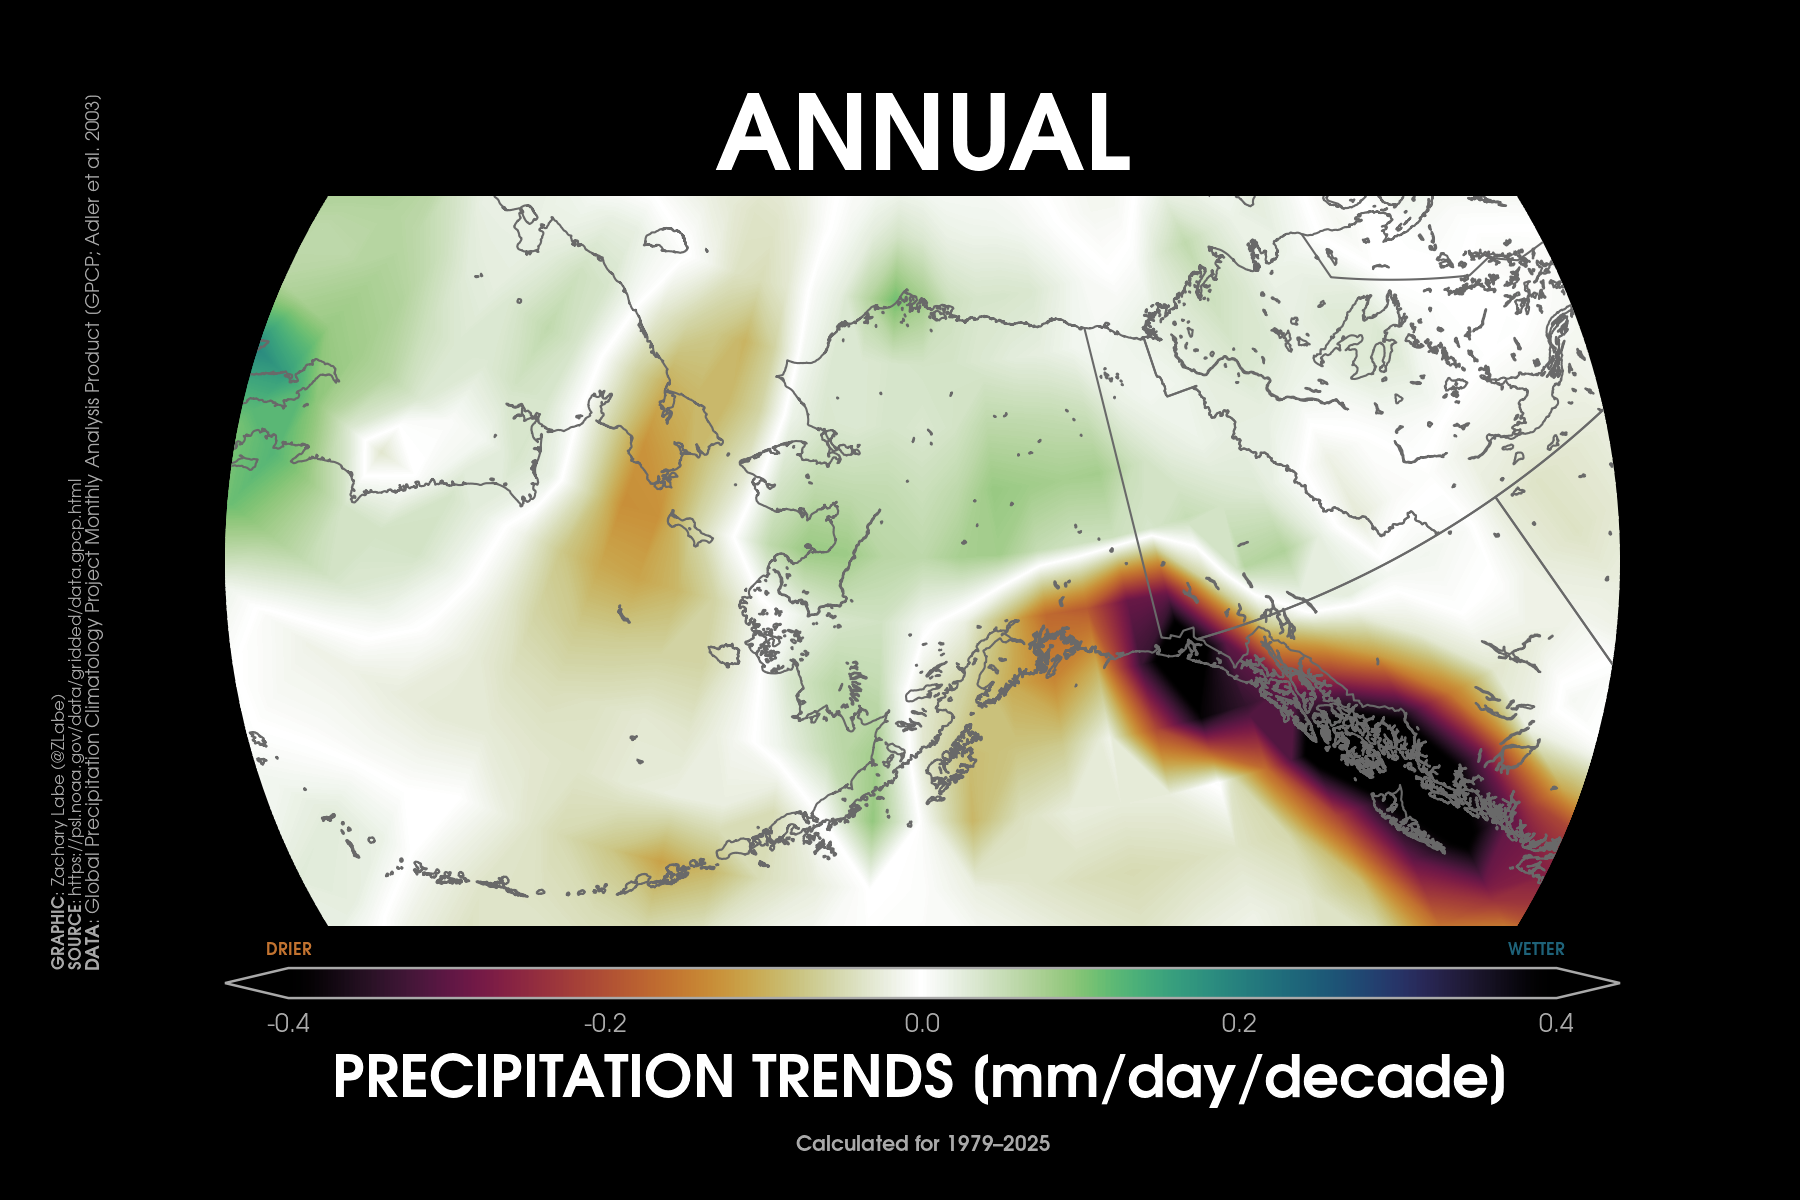
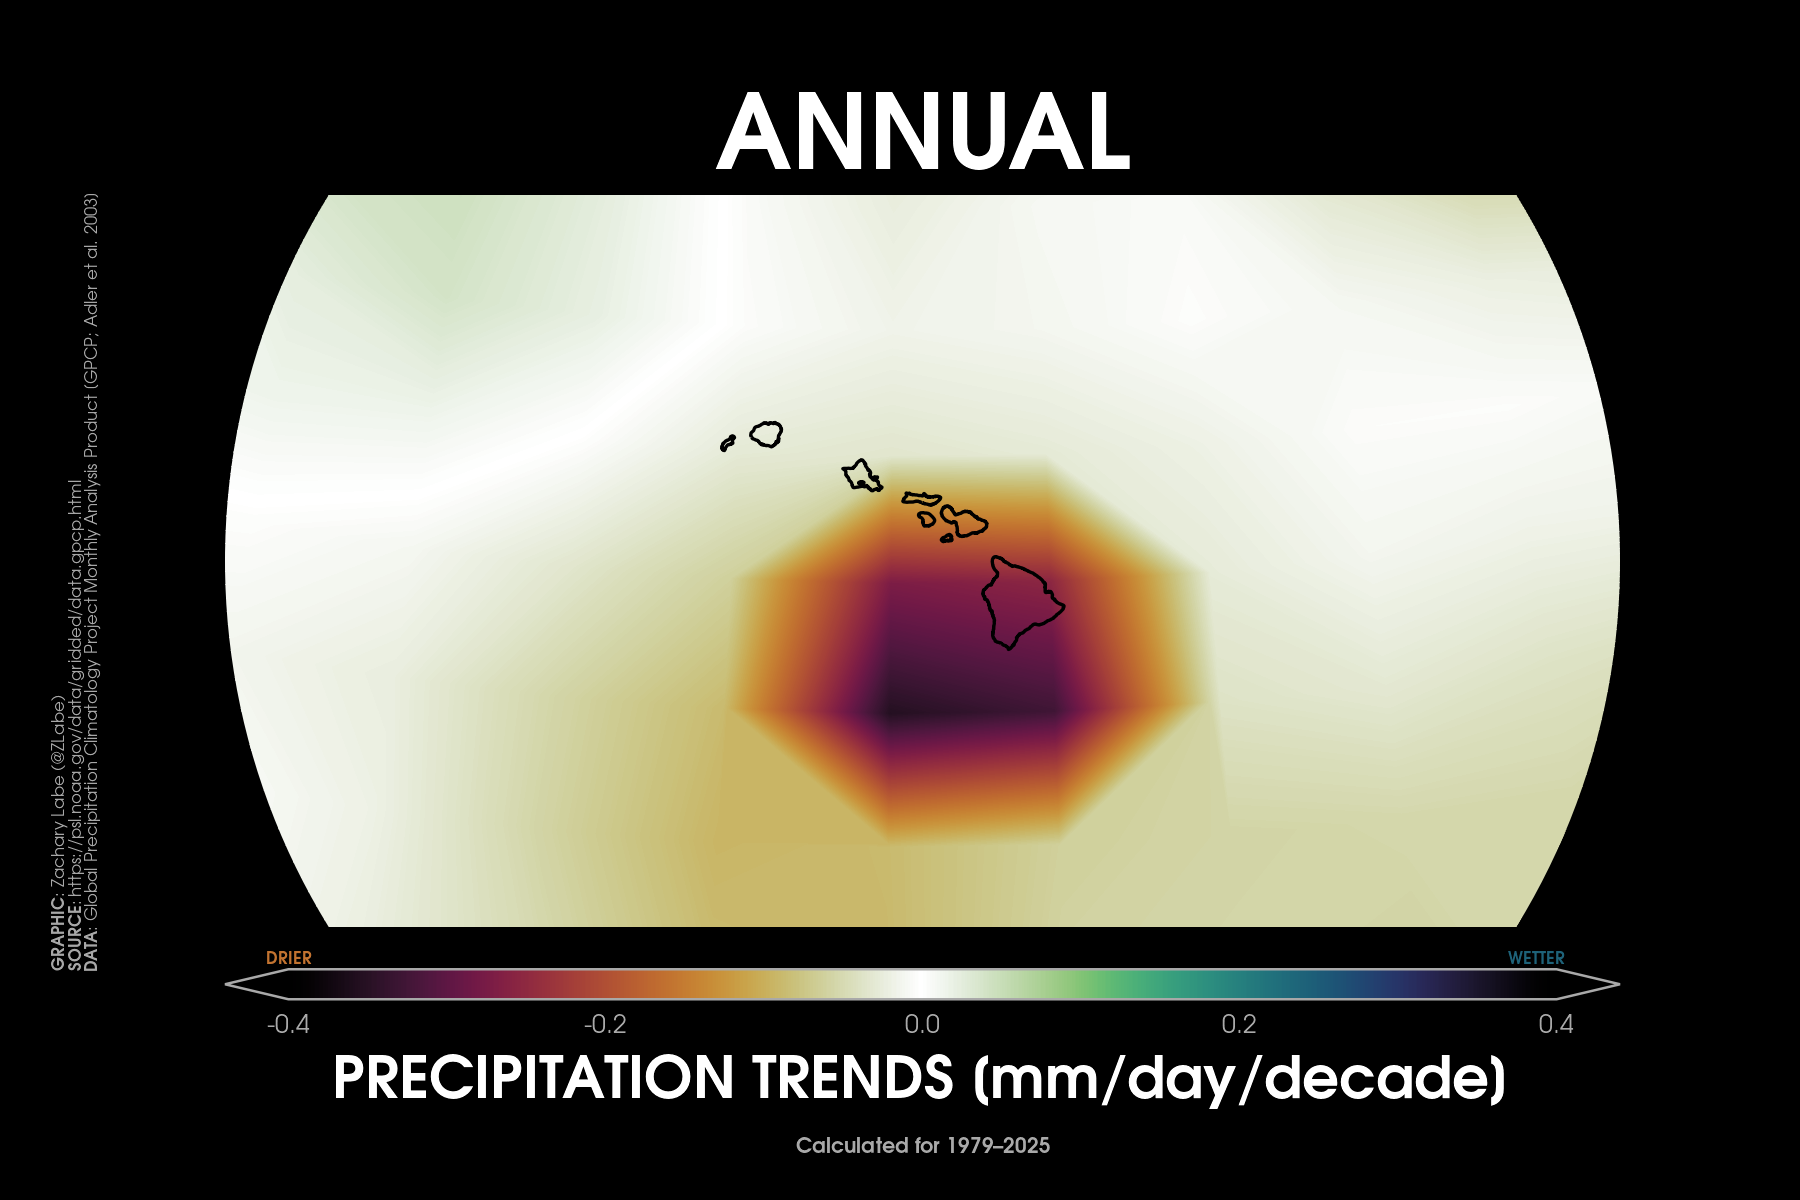
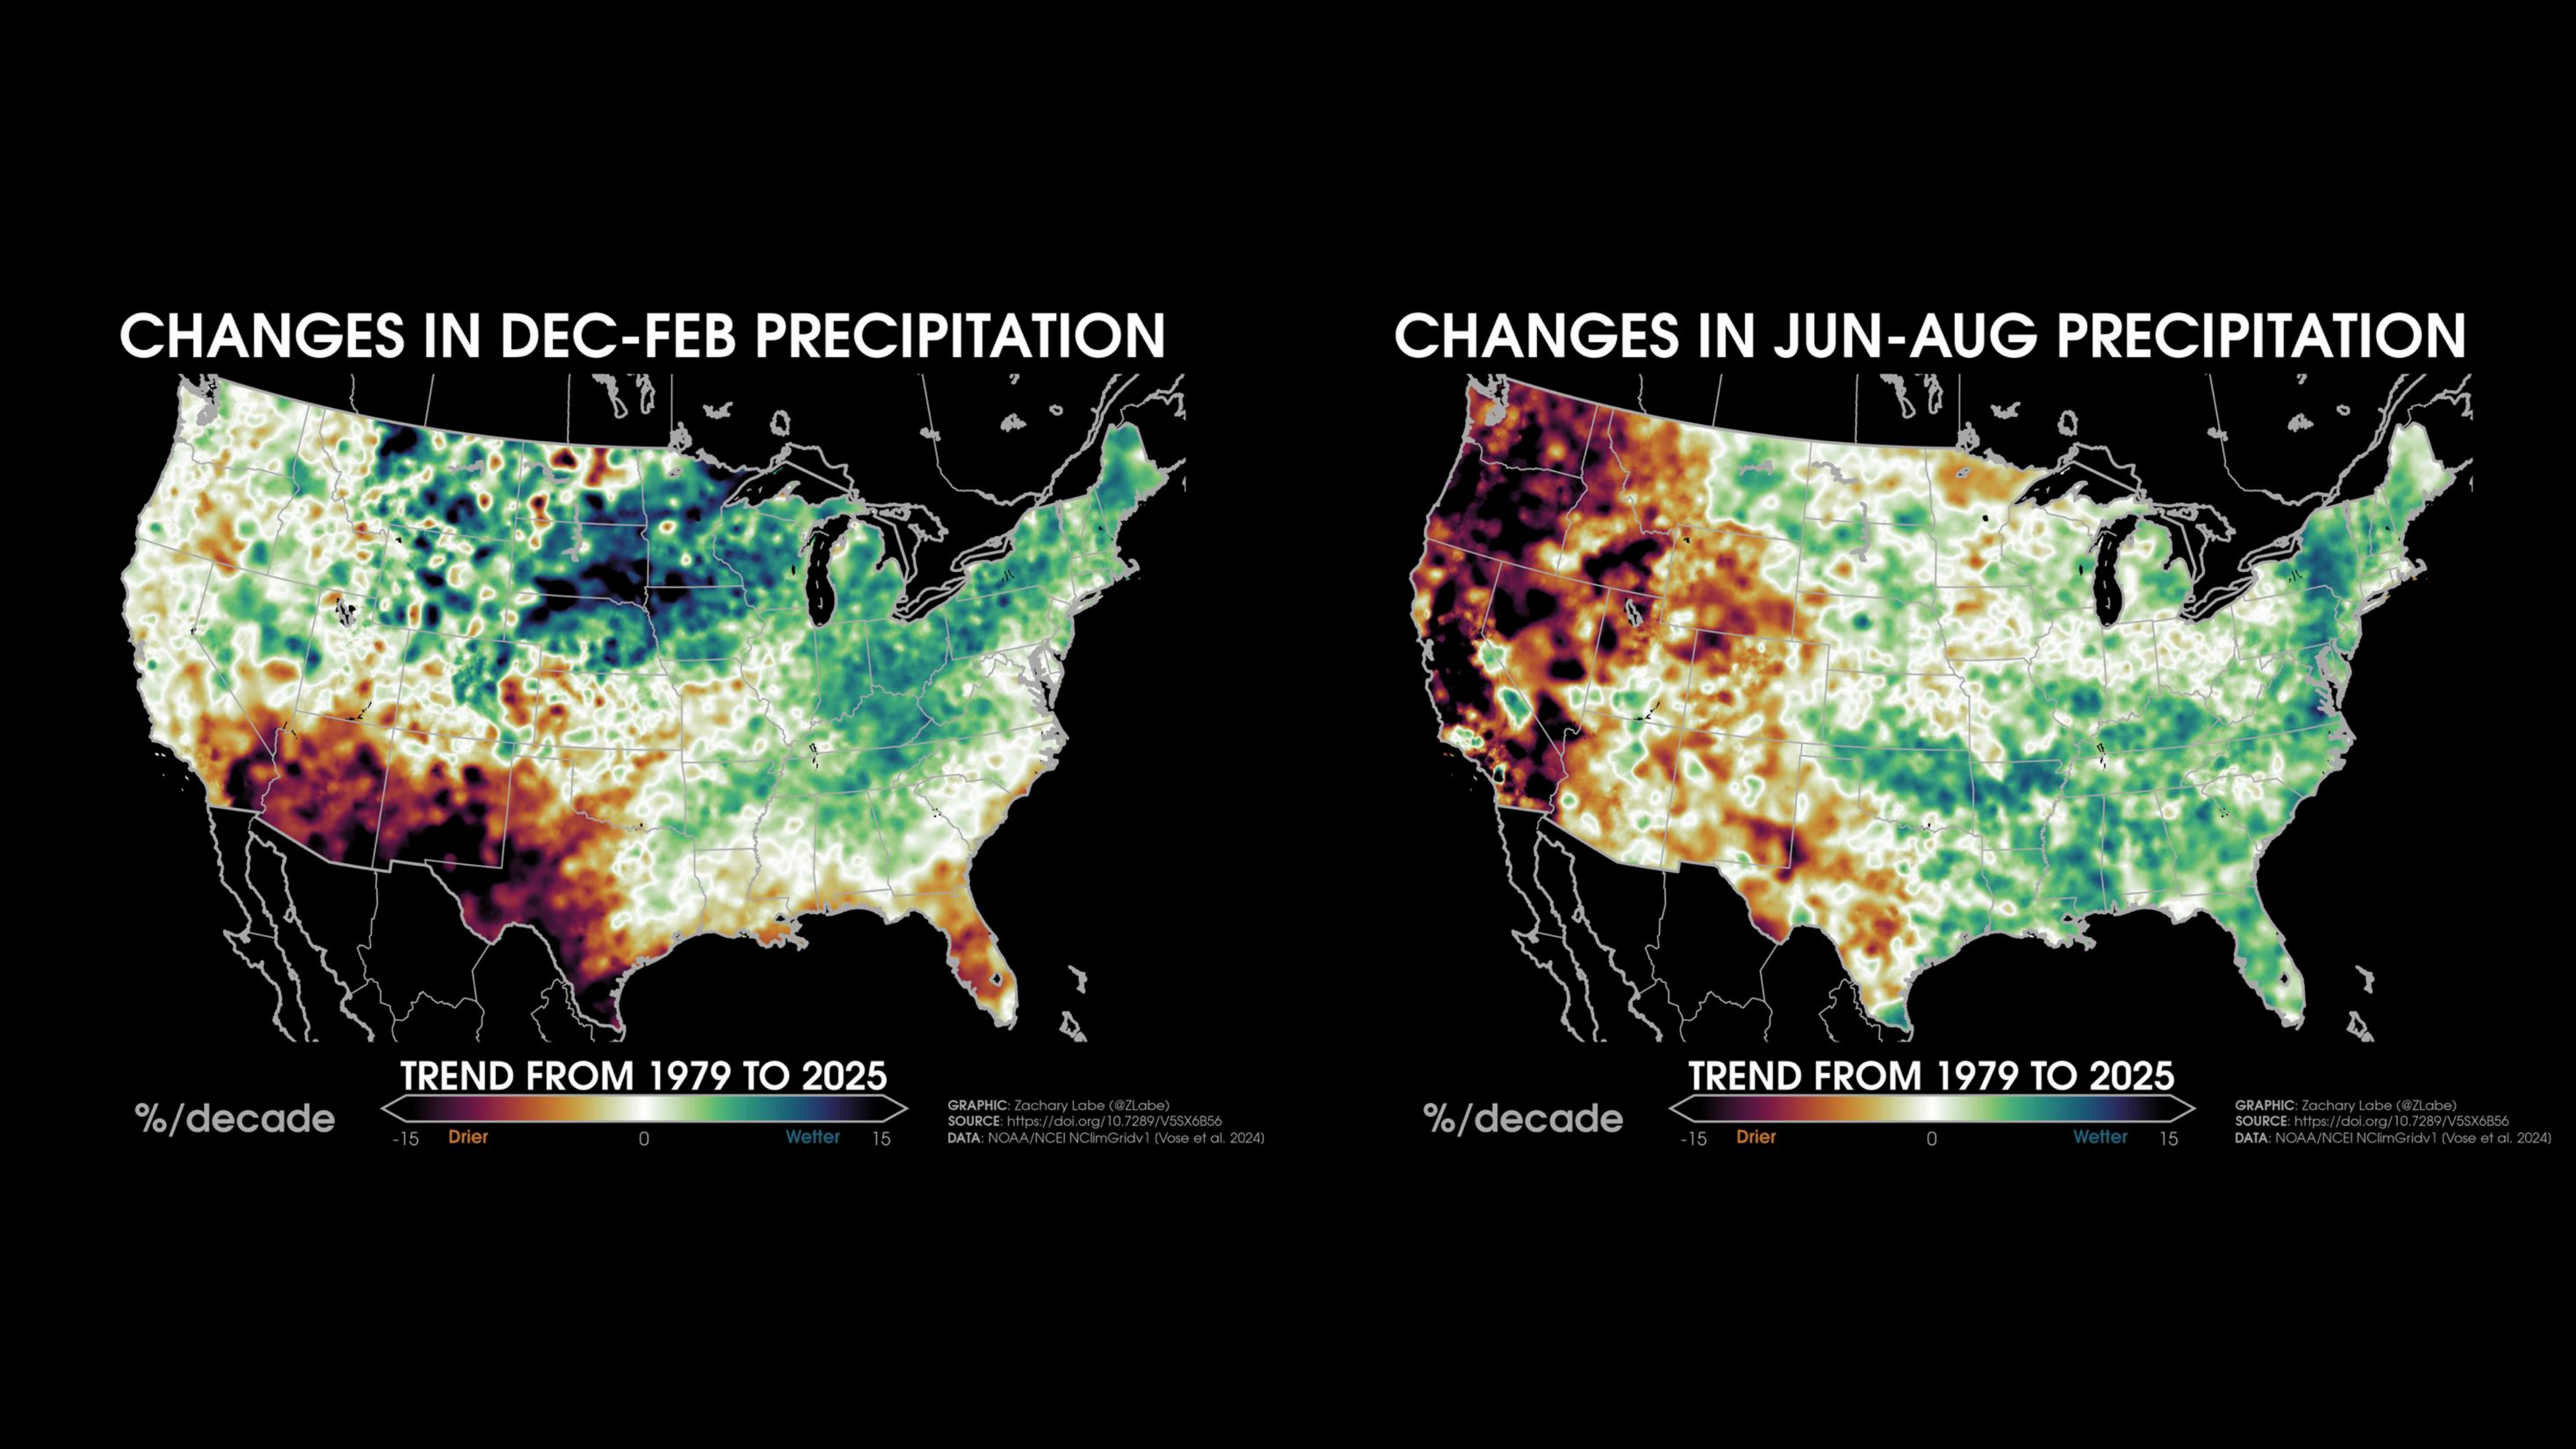
Precipitation TrendsTrends (% per decade) in annual mean precipitation over the contiguous United States (CONUS) from 1979 to 2025. Data is provided by NOAA/NCEI NClimGrid (https://doi.org/10.7289/V5SX6B56). Graphic was updated on 1/17/2026.Decadal trends (linear) in annual mean precipitation around Alaska from 1979 to 2025. Data are from GPCP (https://psl.noaa.gov/data/gridded/data.gpcp.html). Caution that there is large uncertainty in historical precipitation data, such as for the trends around southeastern Alaska. Graphic was updated on 1/20/2026Decadal trends (linear) in annual mean precipitation around Hawaii from 1979 to 2025. Data are from GPCP (https://psl.noaa.gov/data/gridded/data.gpcp.html). Caution that there is larger uncertainty in observational precipitation data. Graphic was updated on 1/20/2026.Trends (% per decade) in winter (December-January-February; left) and summer (June-July-August; right) precipitation over the contiguous United States (CONUS) from 1979 to 2025. Data is provided by NOAA/NCEI NClimGrid (https://doi.org/10.7289/V5SX6B56). Graphic was updated on 1/19/2026.
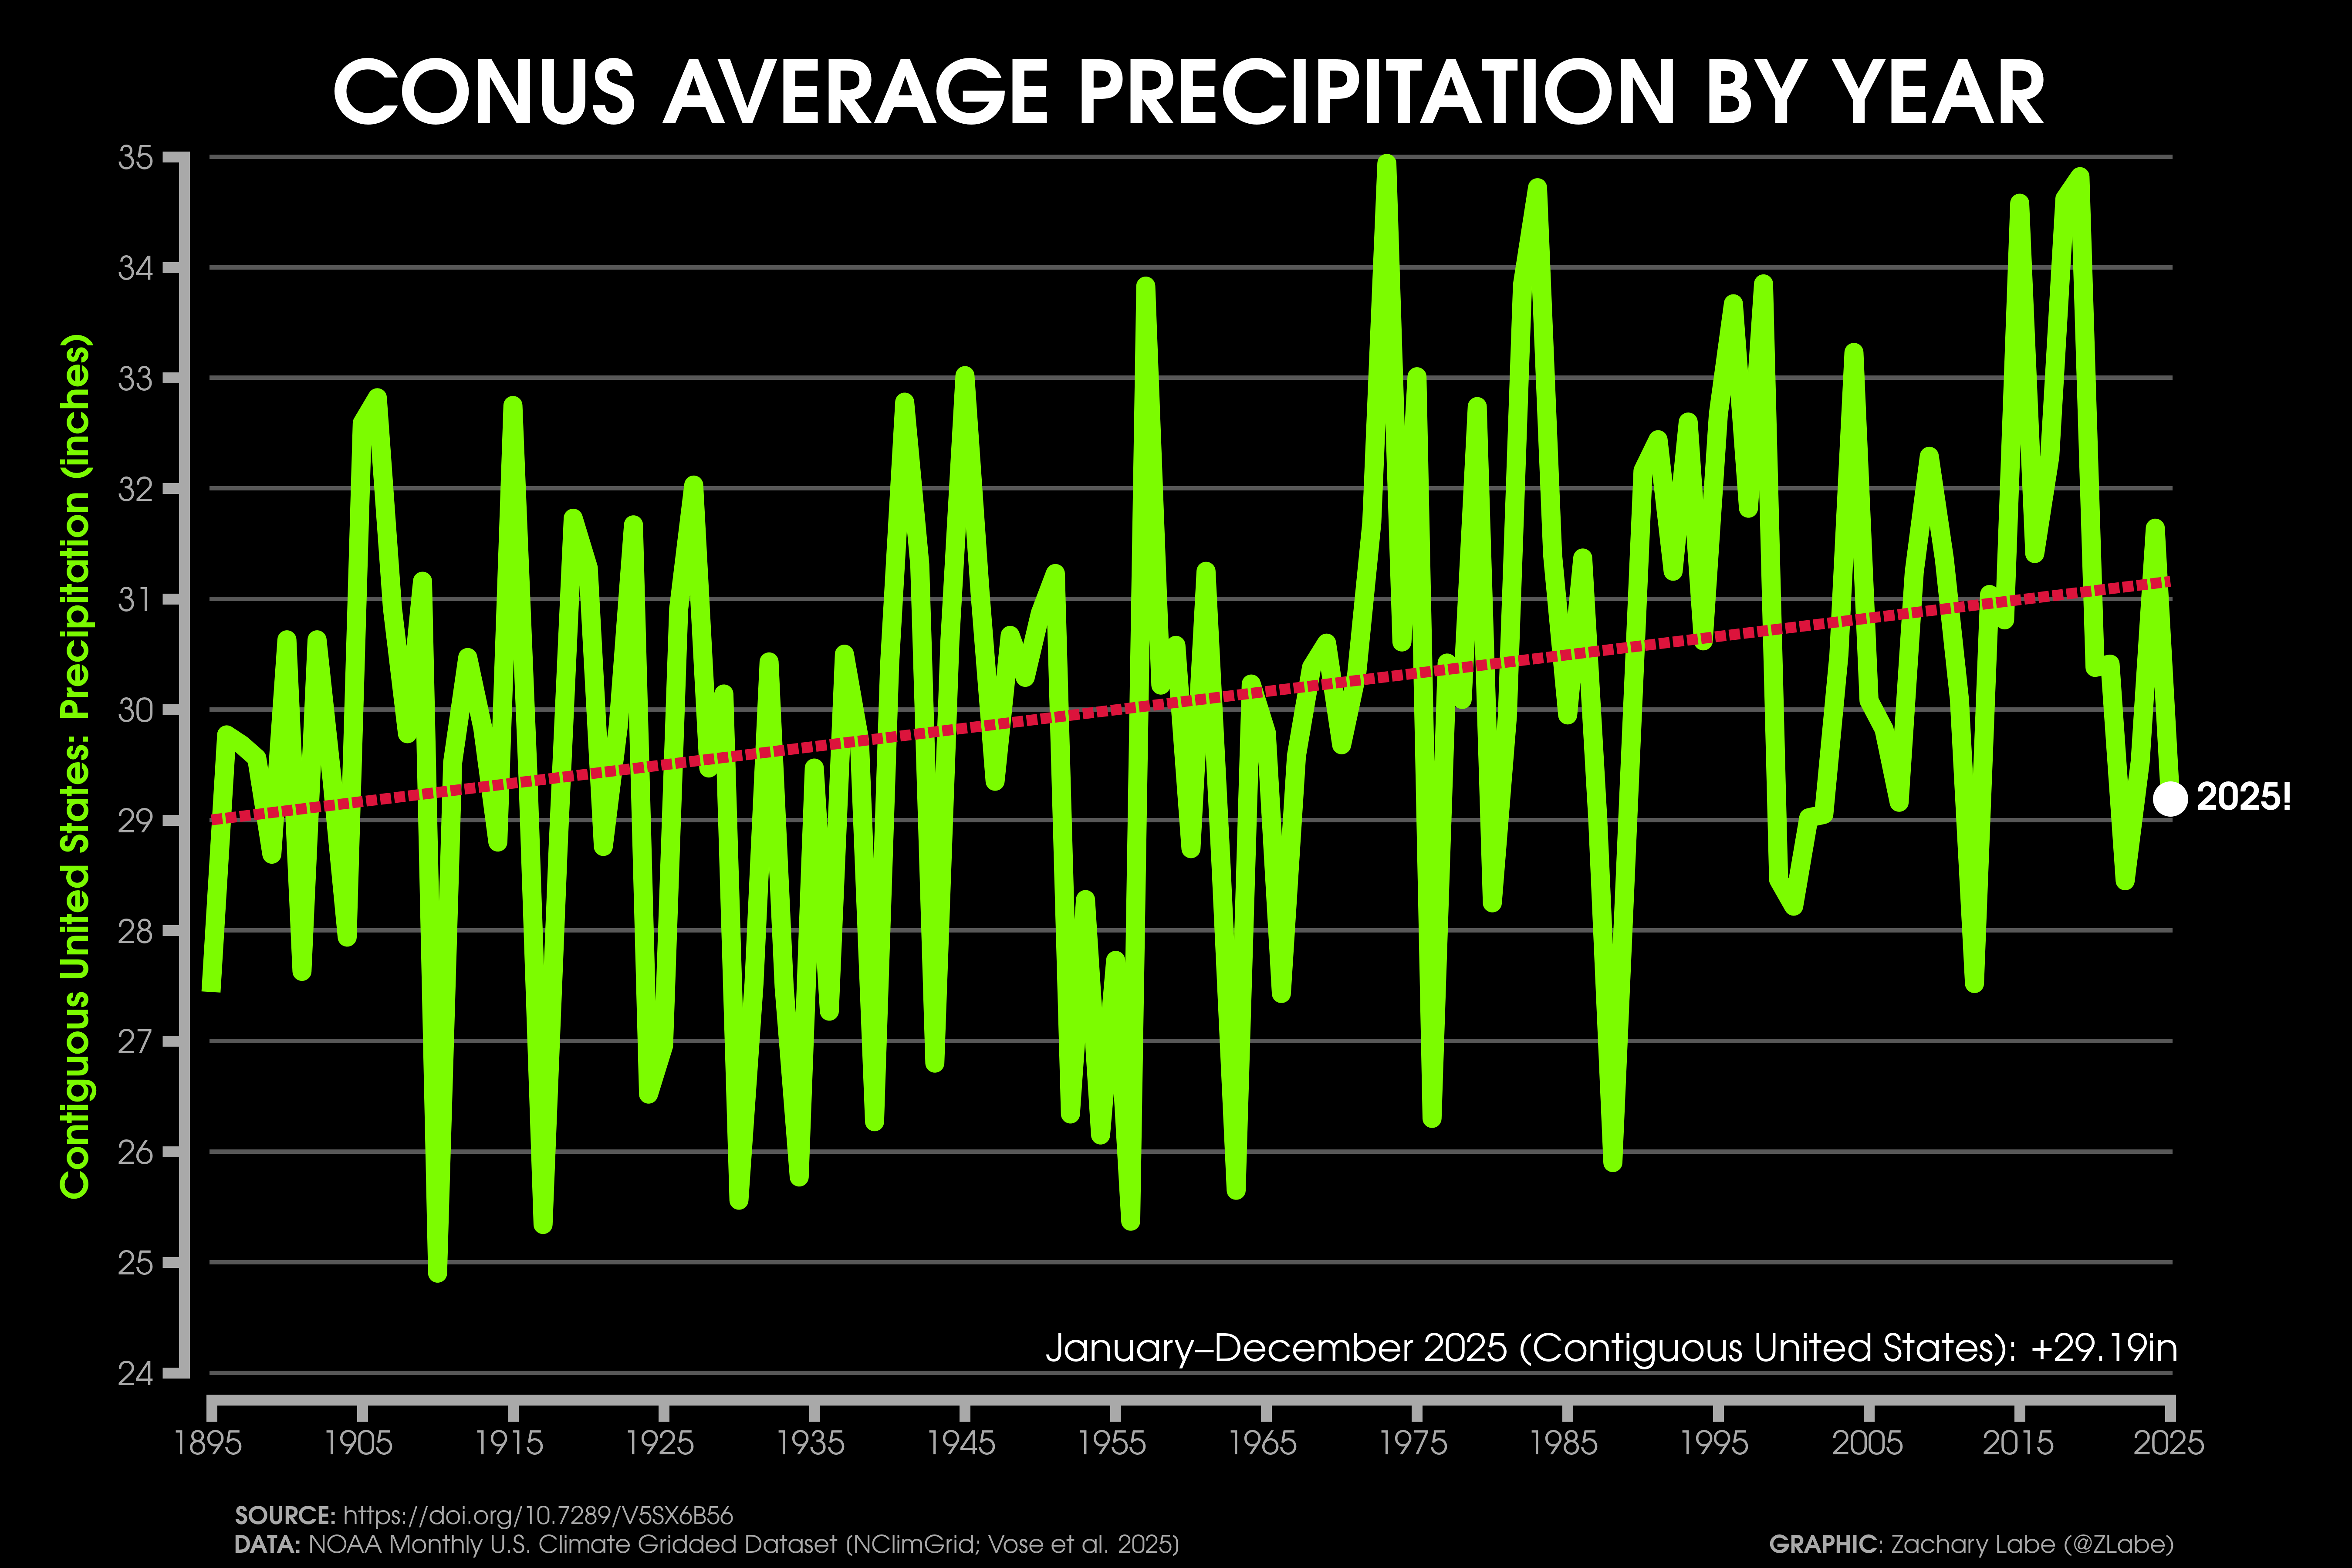
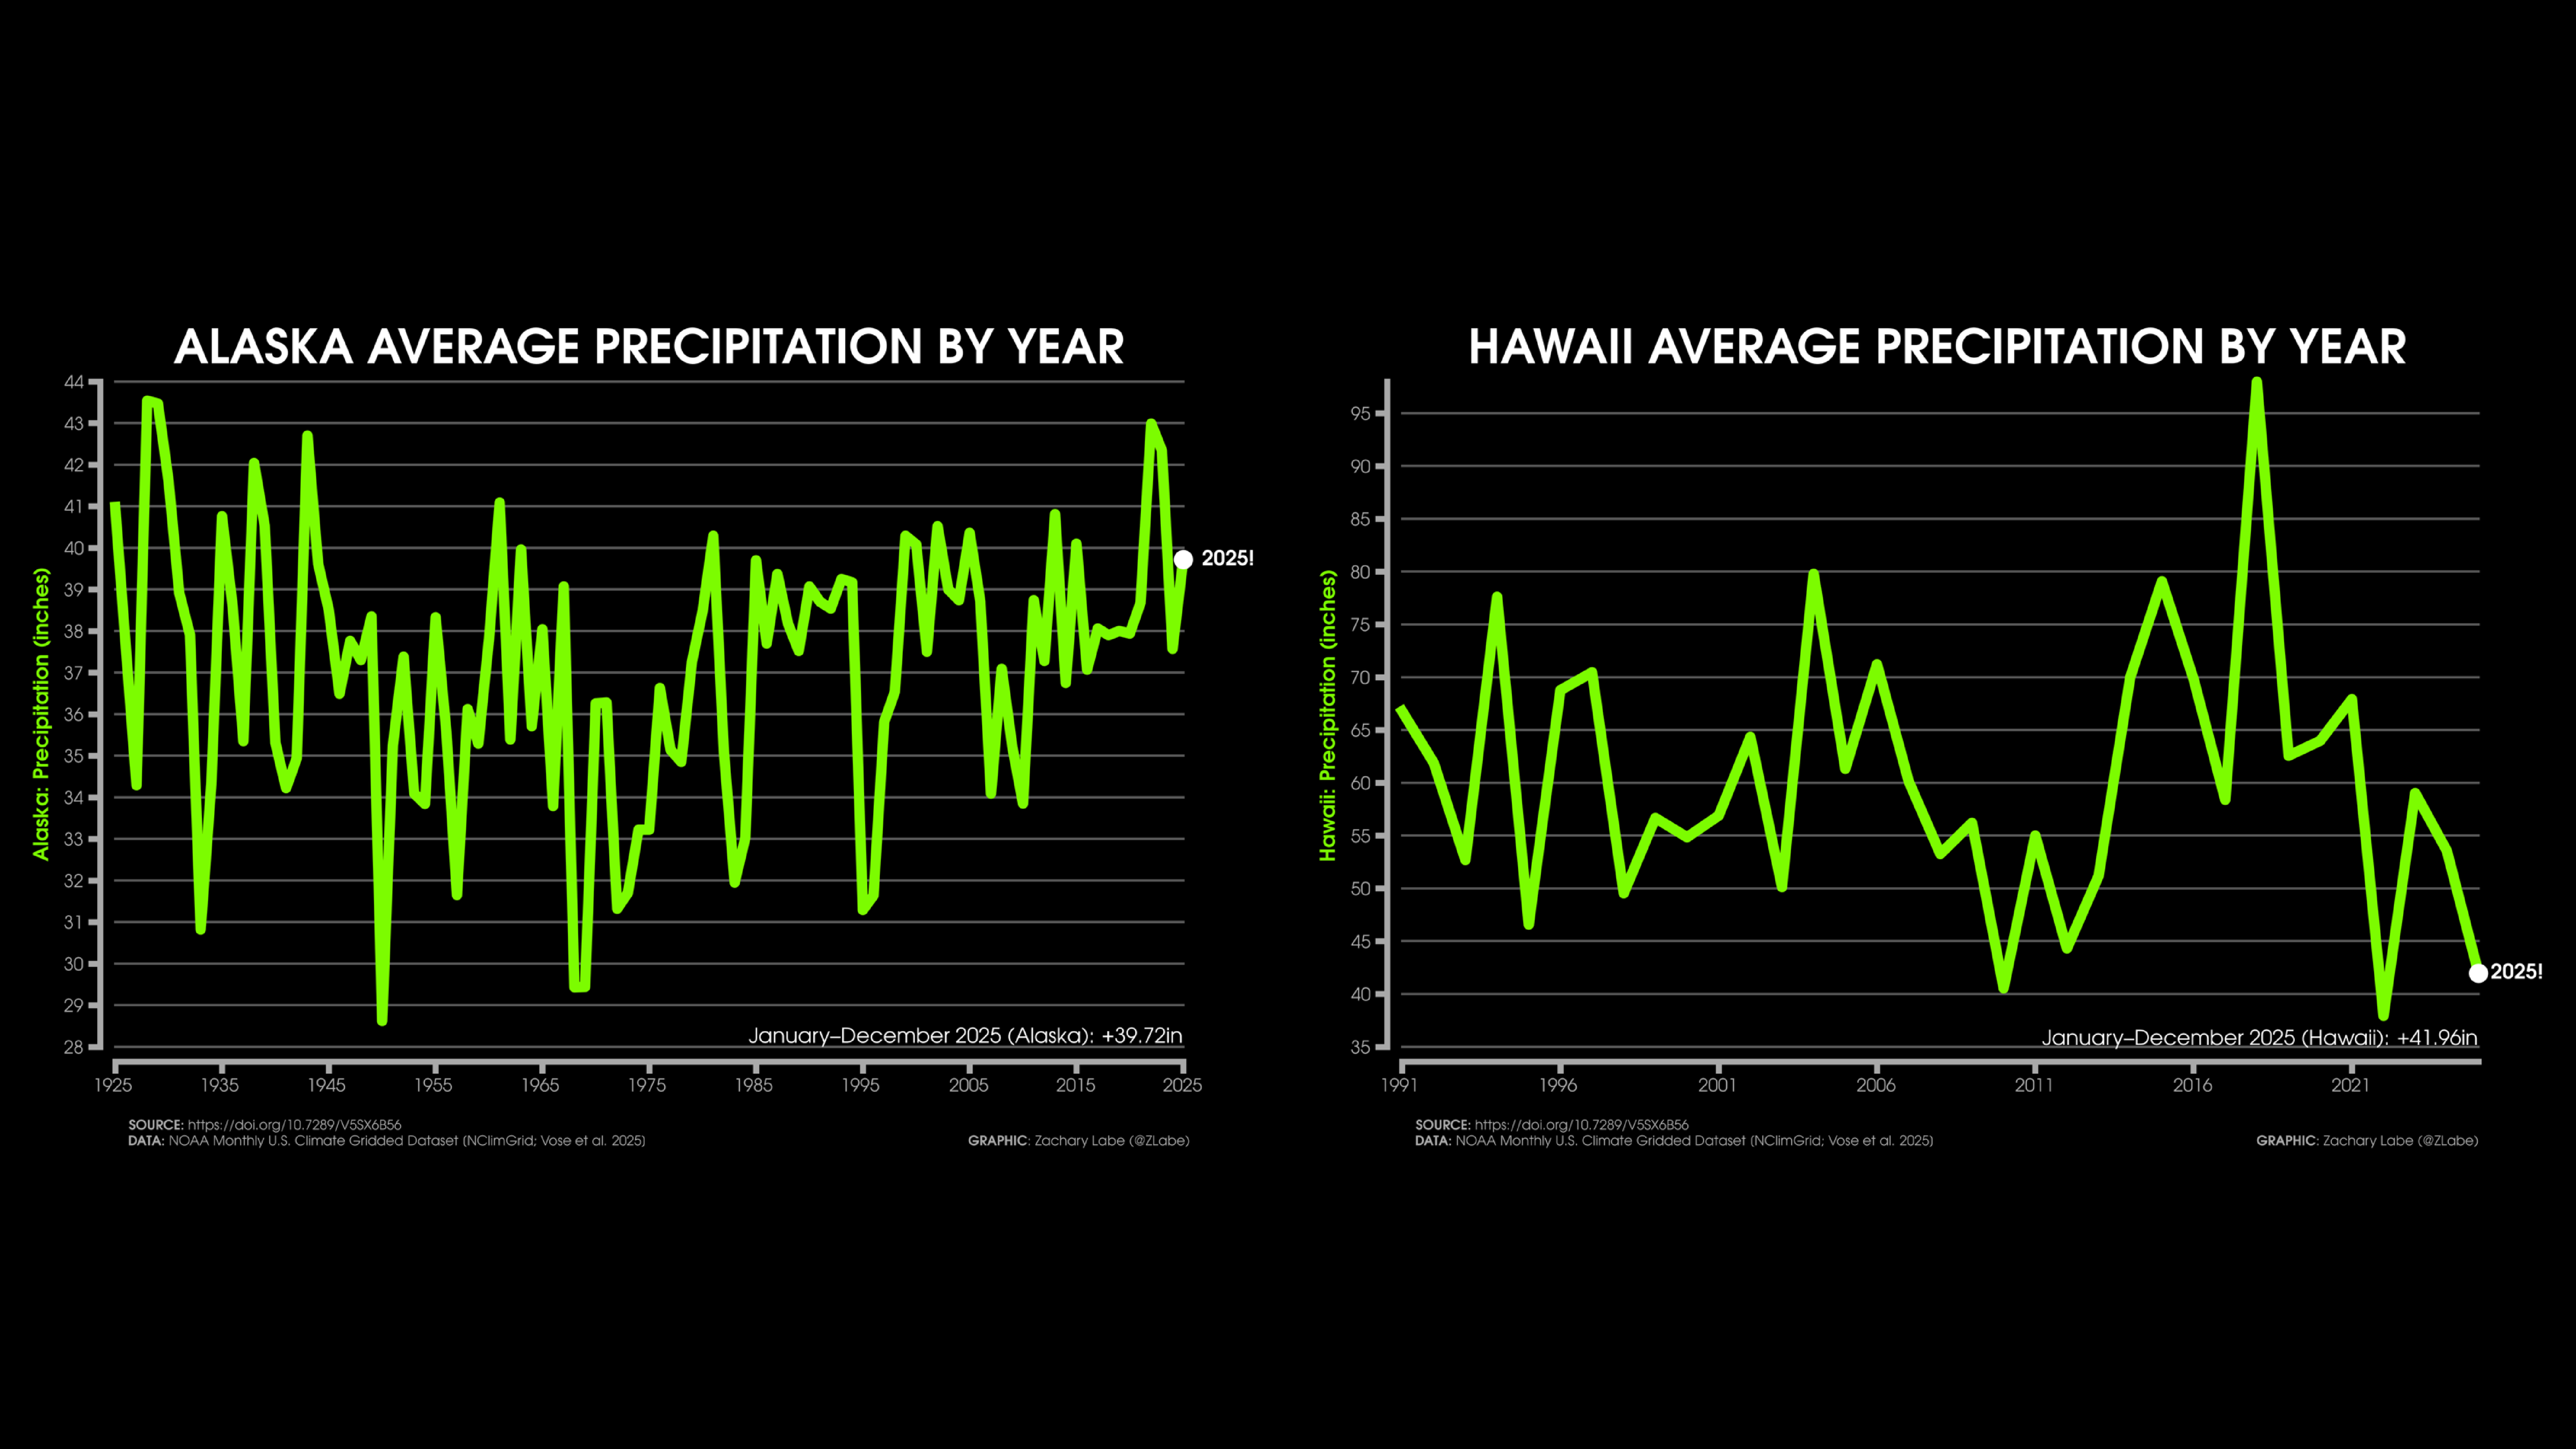
Precipitation Time SeriesGraph showing the mean precipitation (inches) across the contiguous United States (CONUS) and averaged for each year from 1895 to 2025. The actual mean CONUS precipitation average in 2025 was 29.19 inches. Data is provided by NOAA/NCEI NClimGrid (https://doi.org/10.7289/V5SX6B56). Graphic was updated on 1/17/2026.Graph showing the mean precipitation (inches) across Alaska (left) and Hawaii (right). The time series for each state is averaged for each year. Differences in the length of the record is due to data availability. Data is provided by NOAA/NCEI NClimGrid (https://doi.org/10.7289/V5SX6B56). Graphic was updated on 1/17/2026.
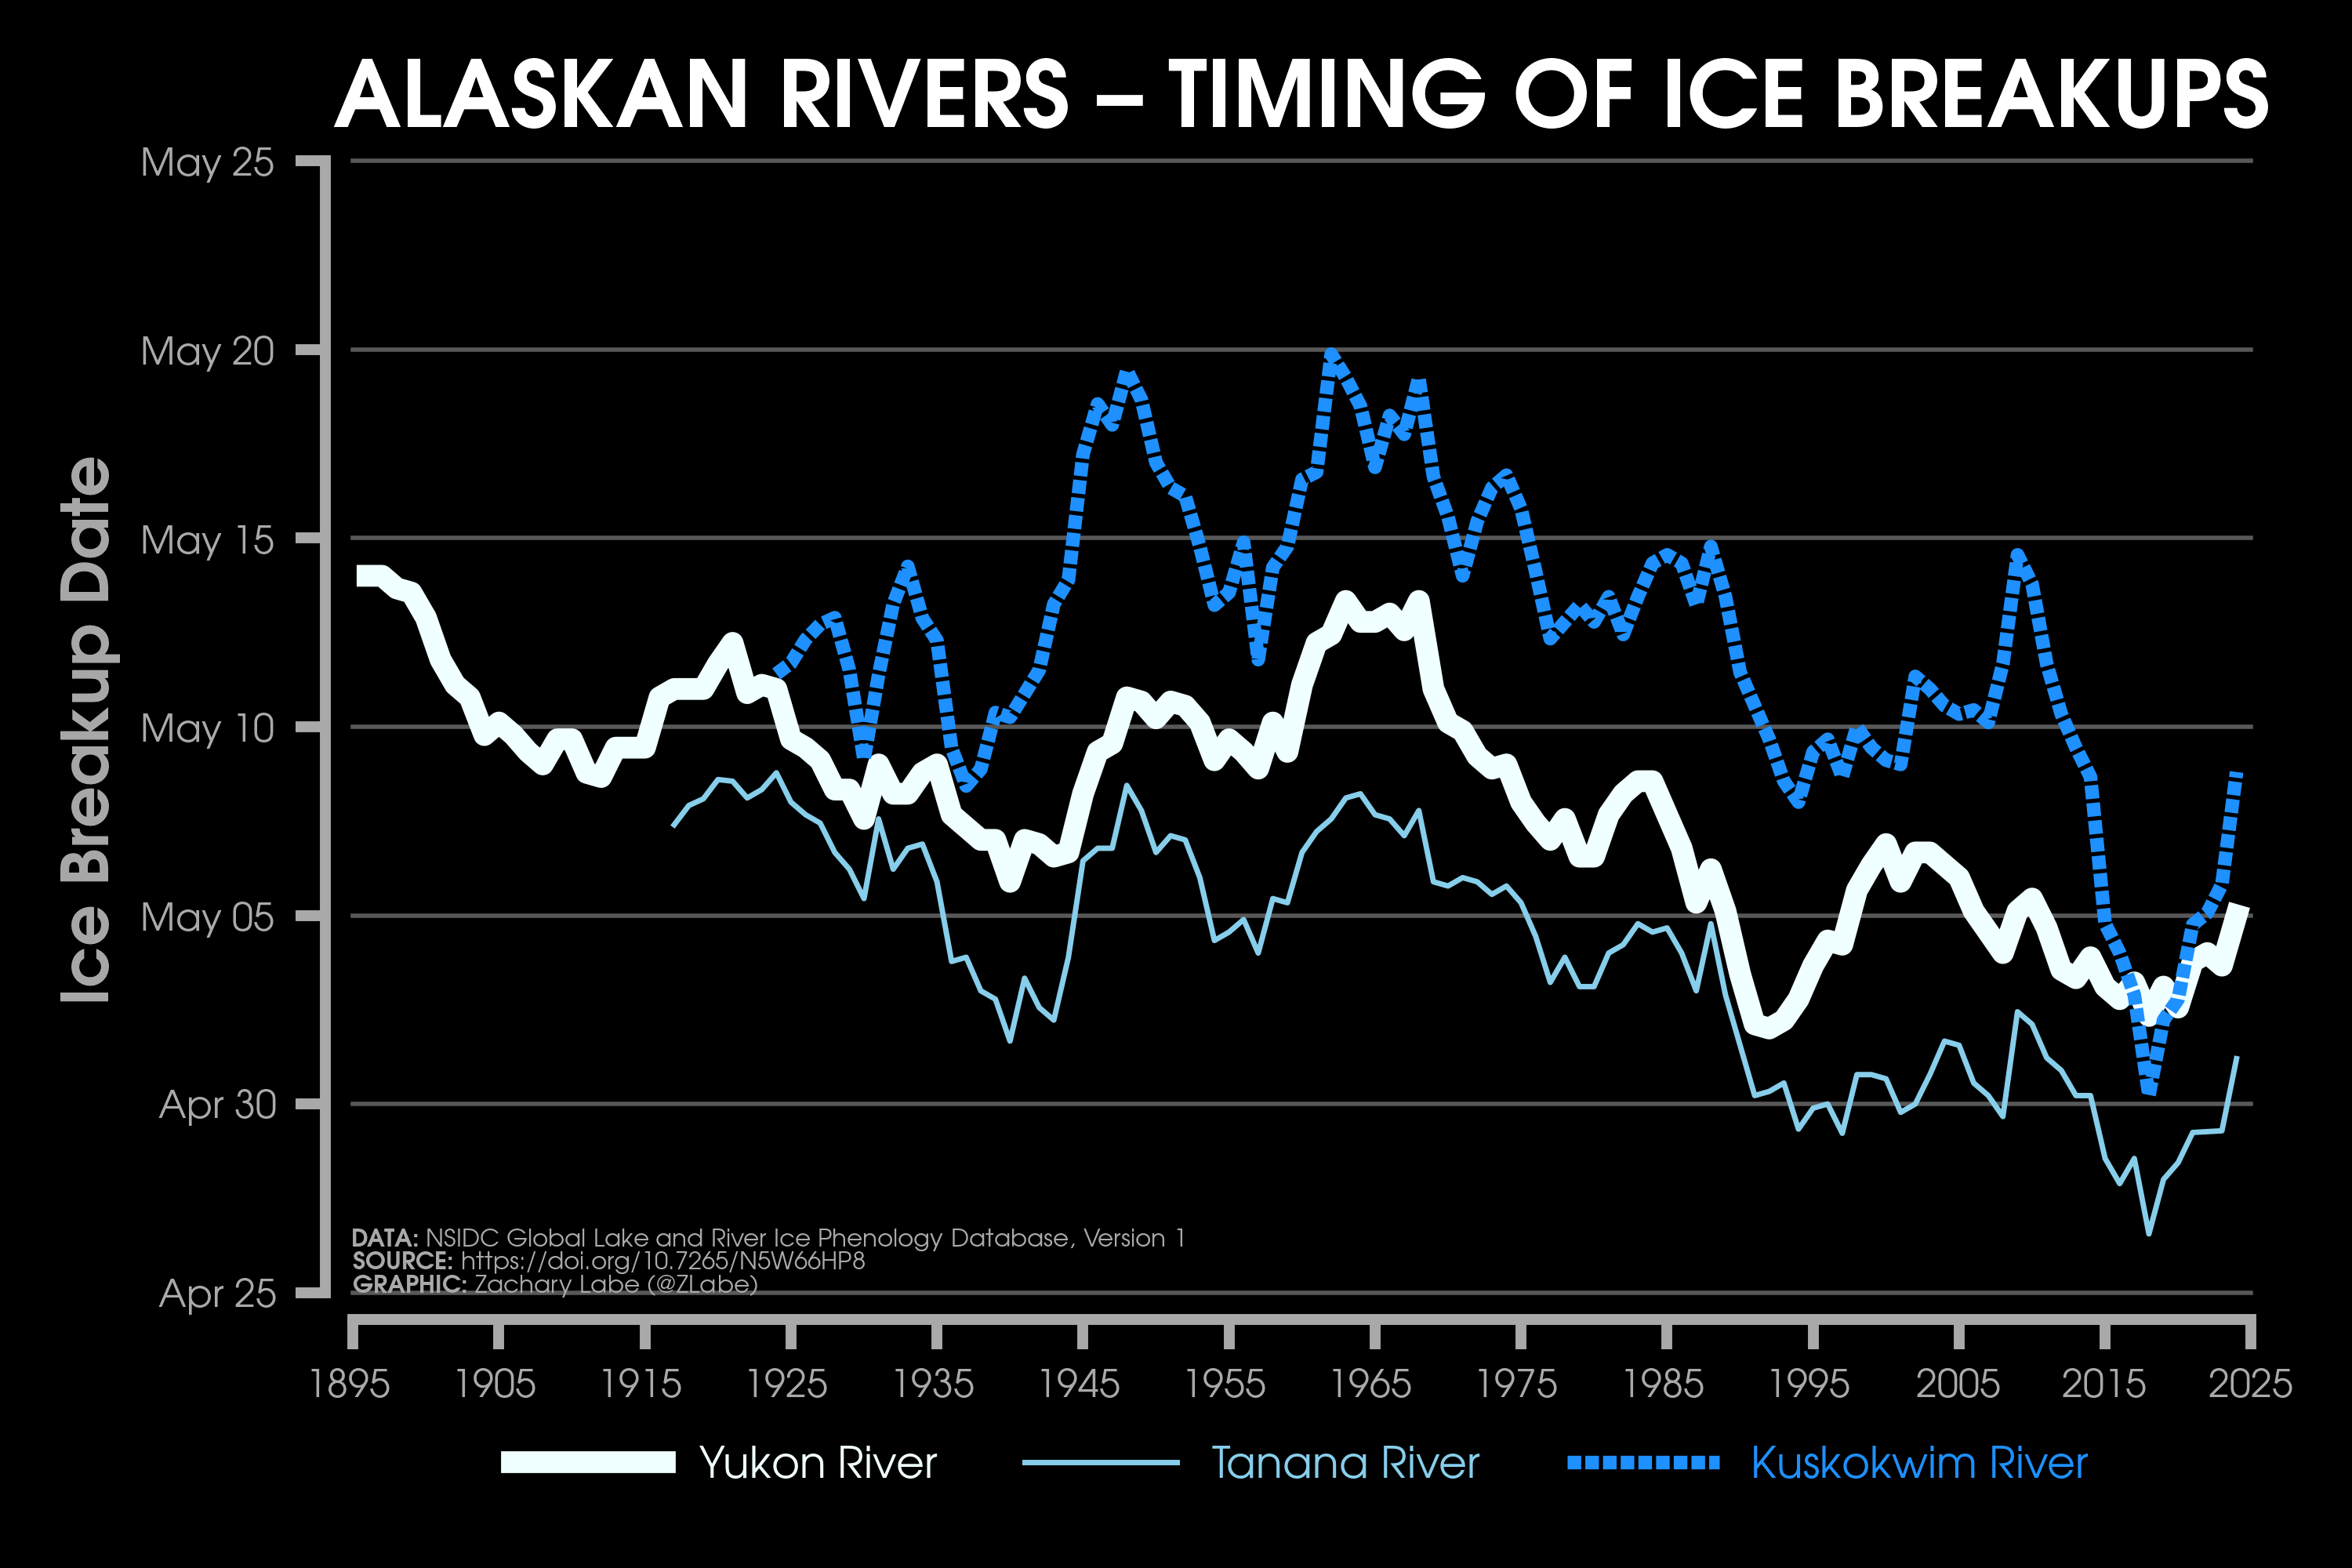
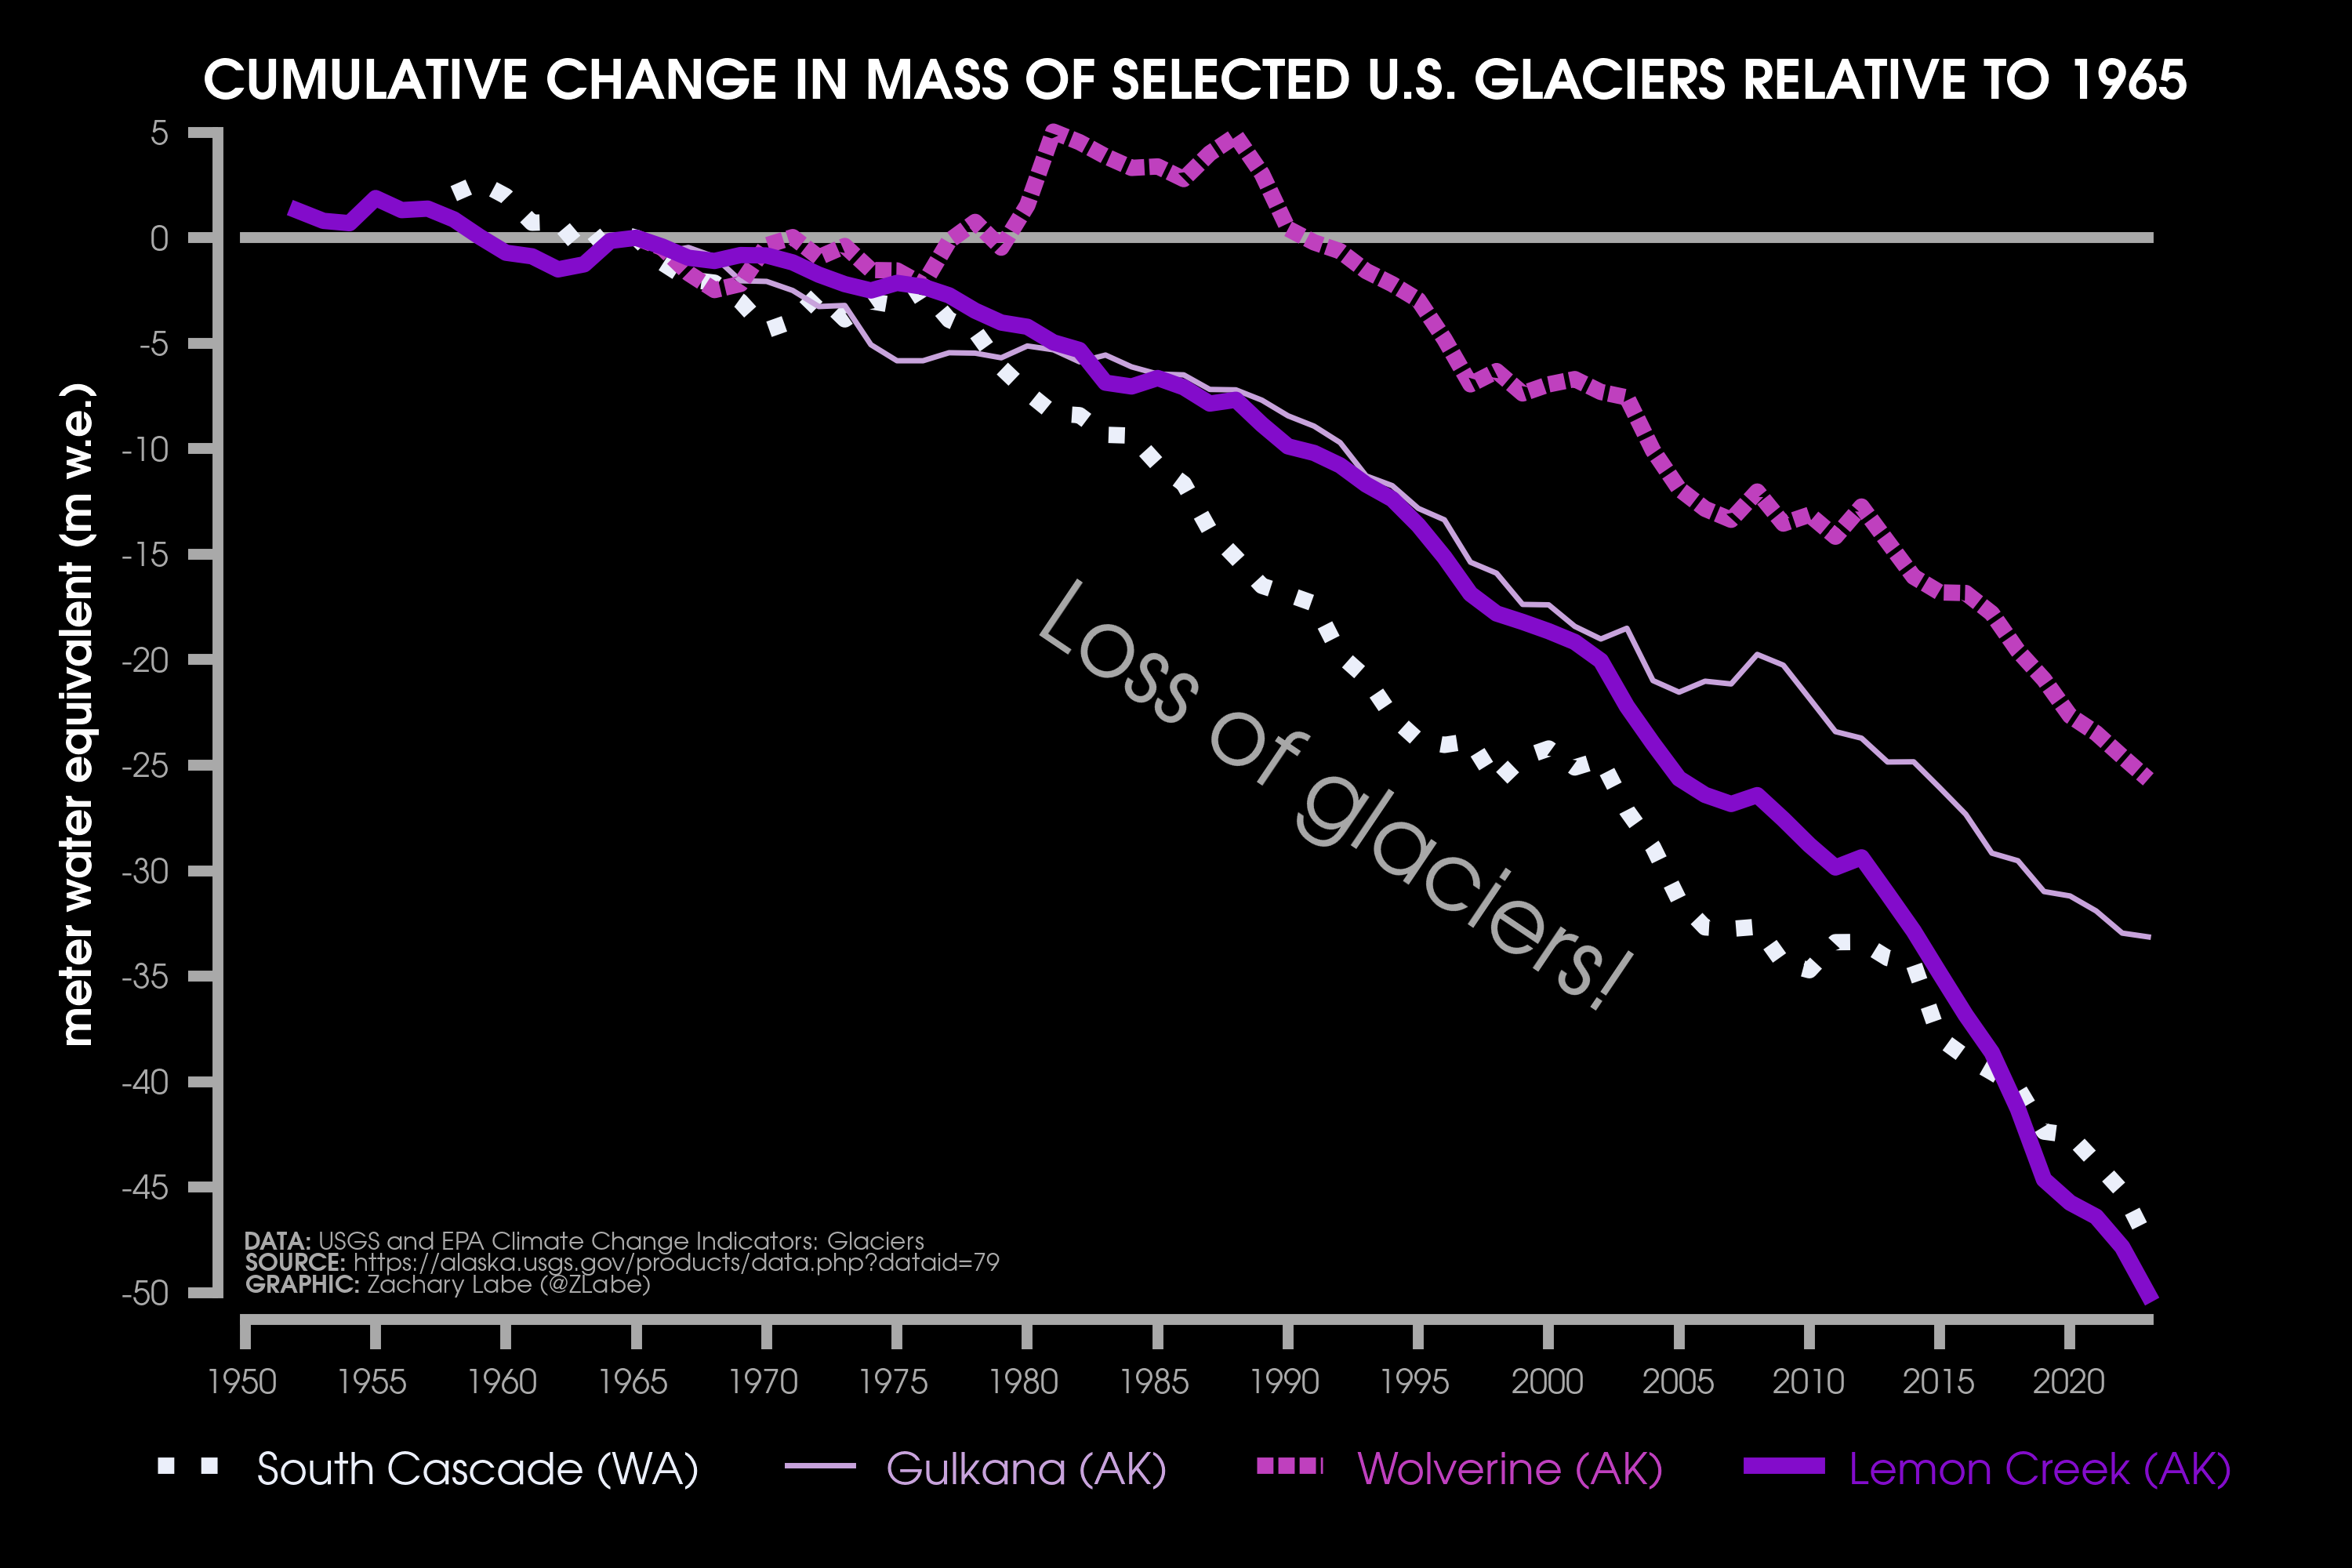
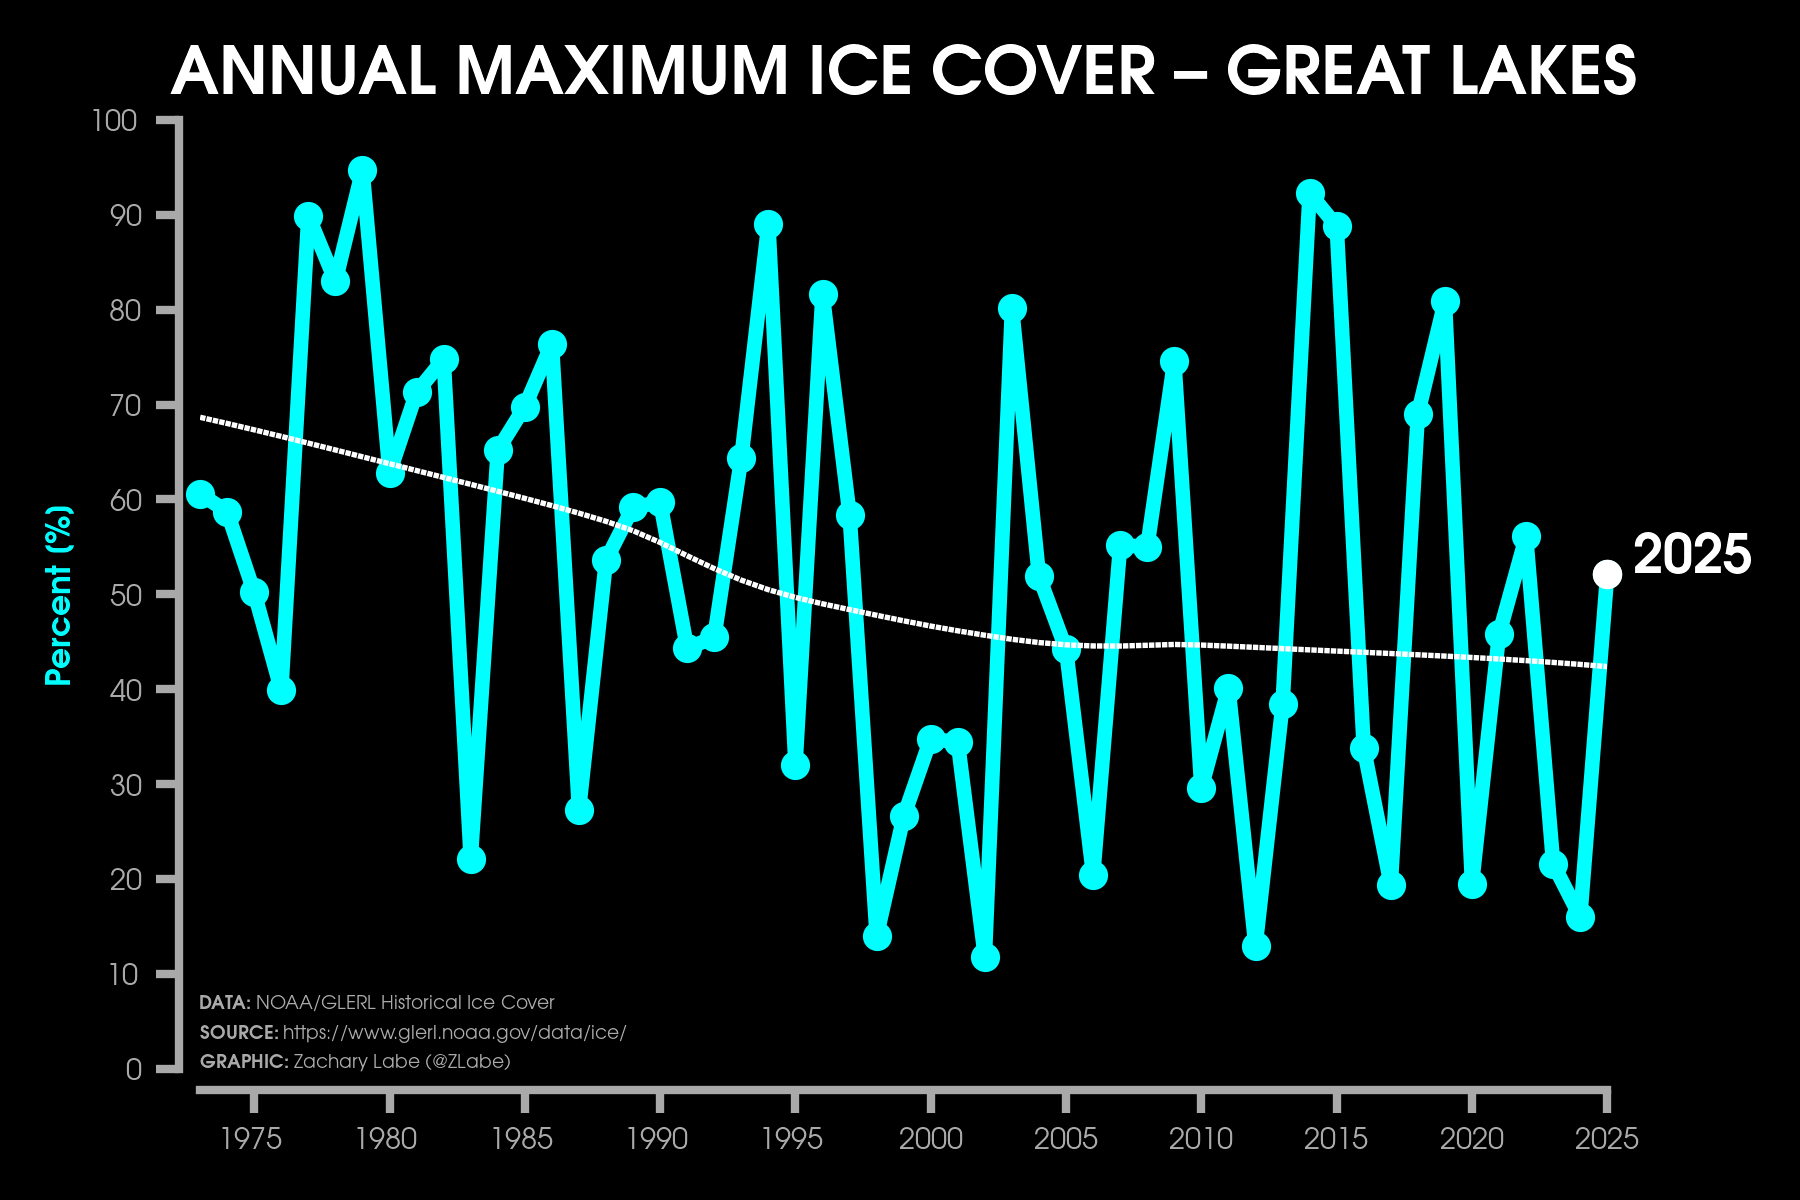
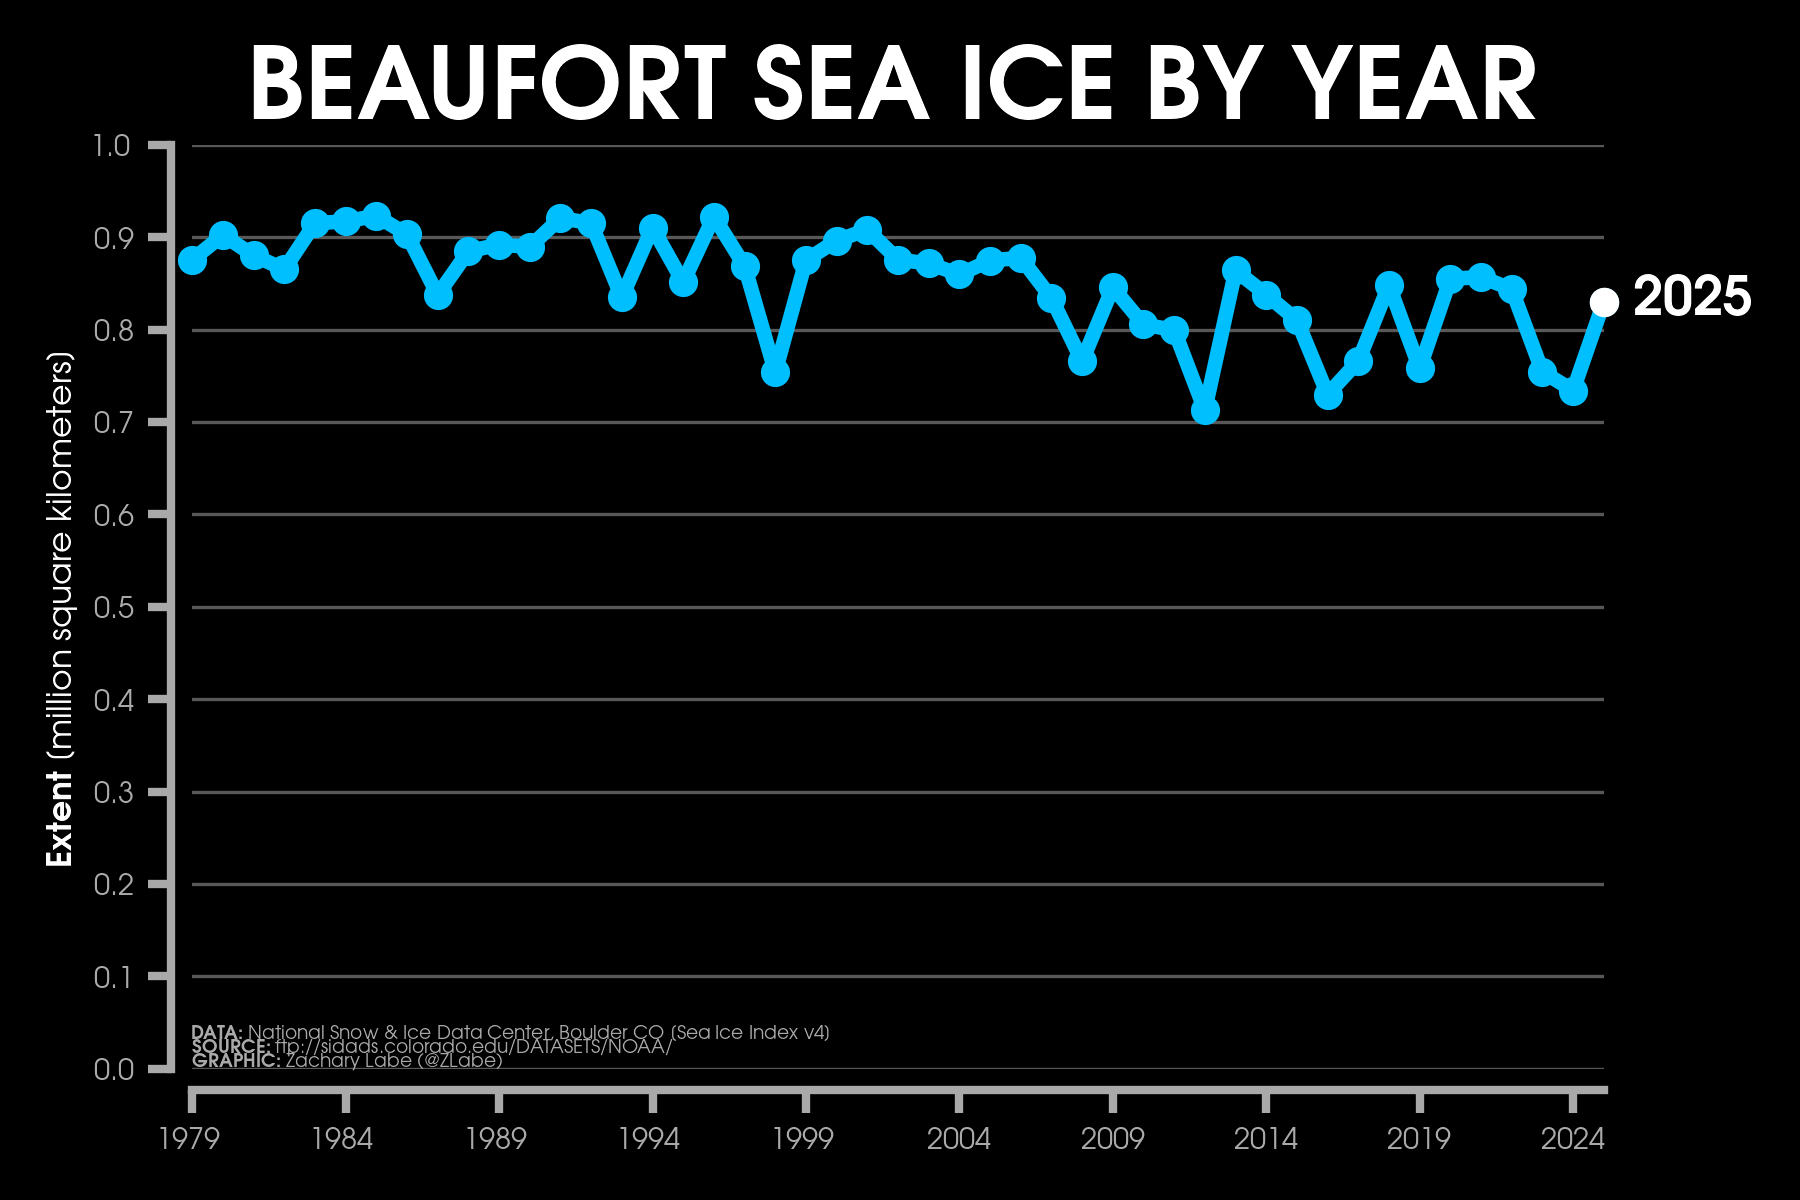
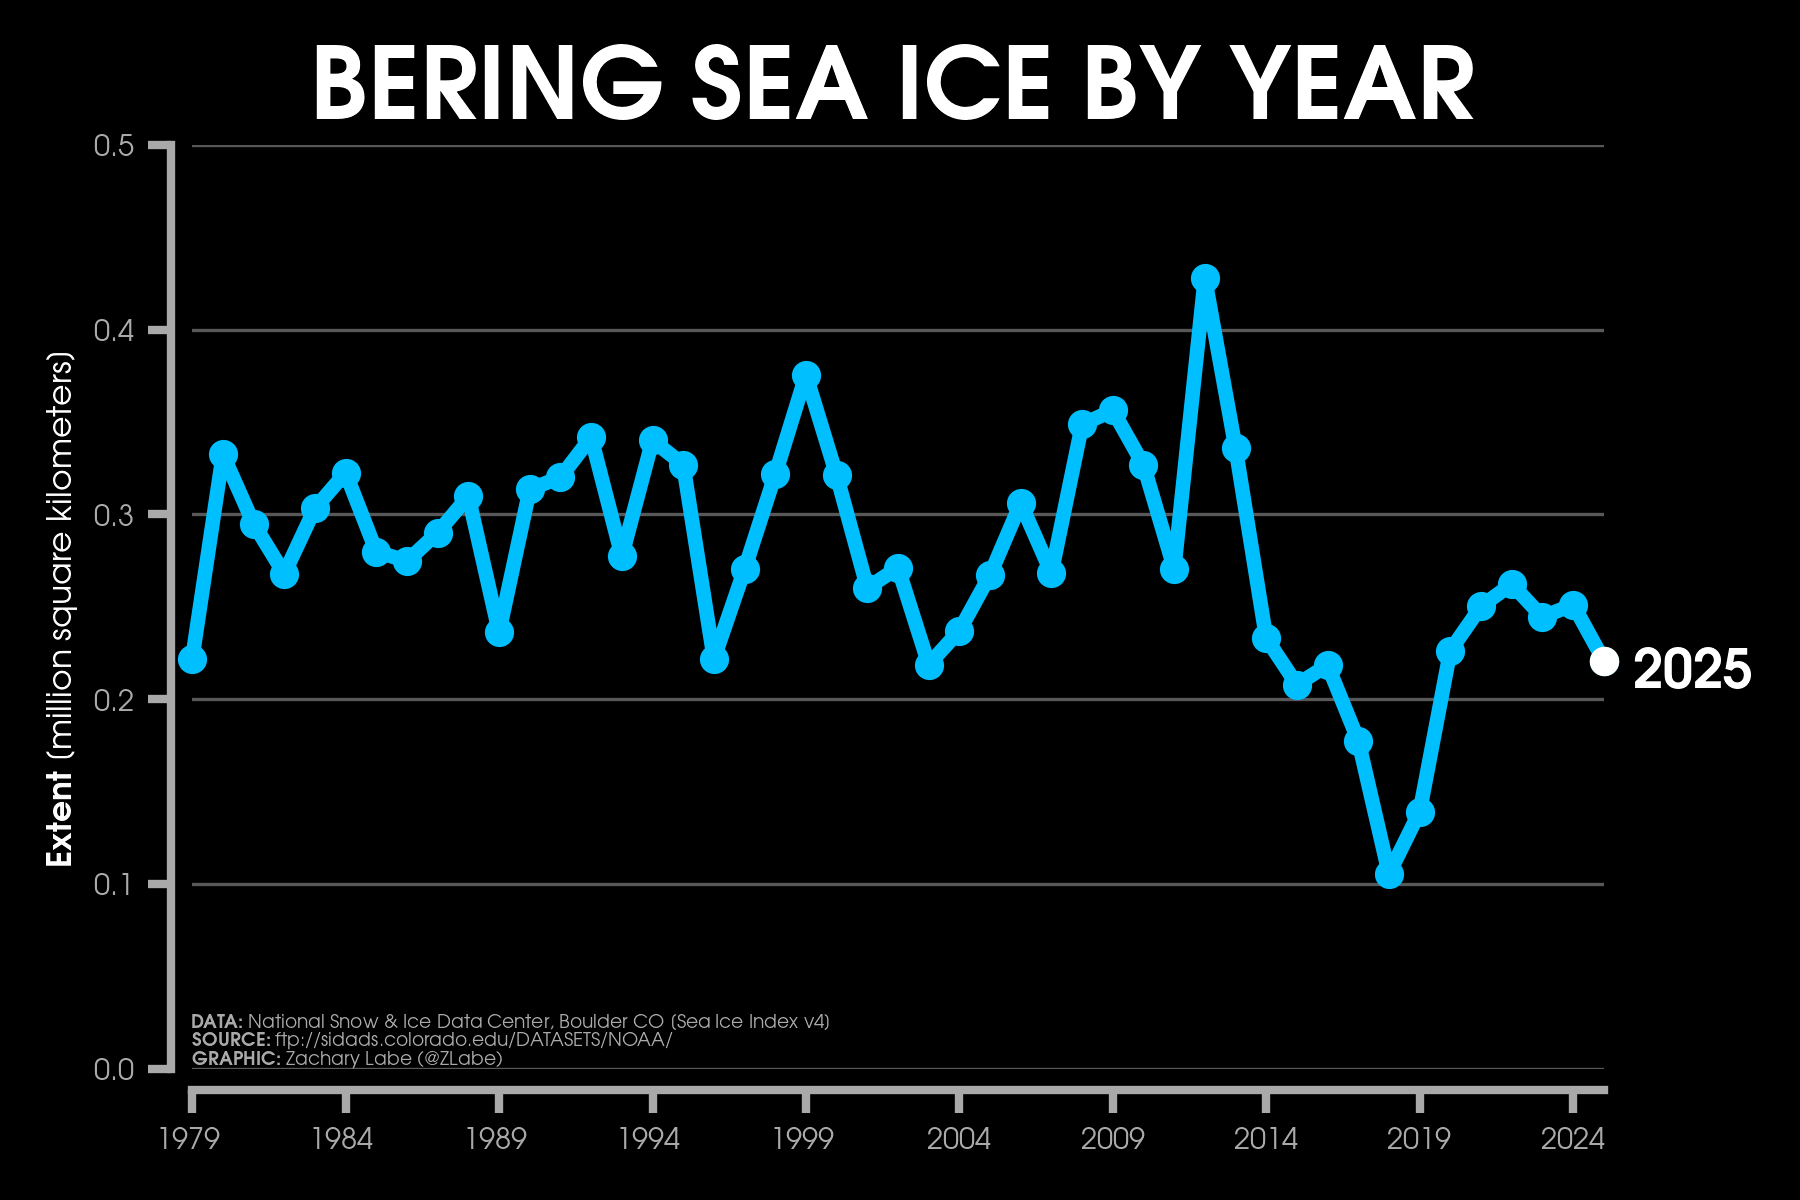
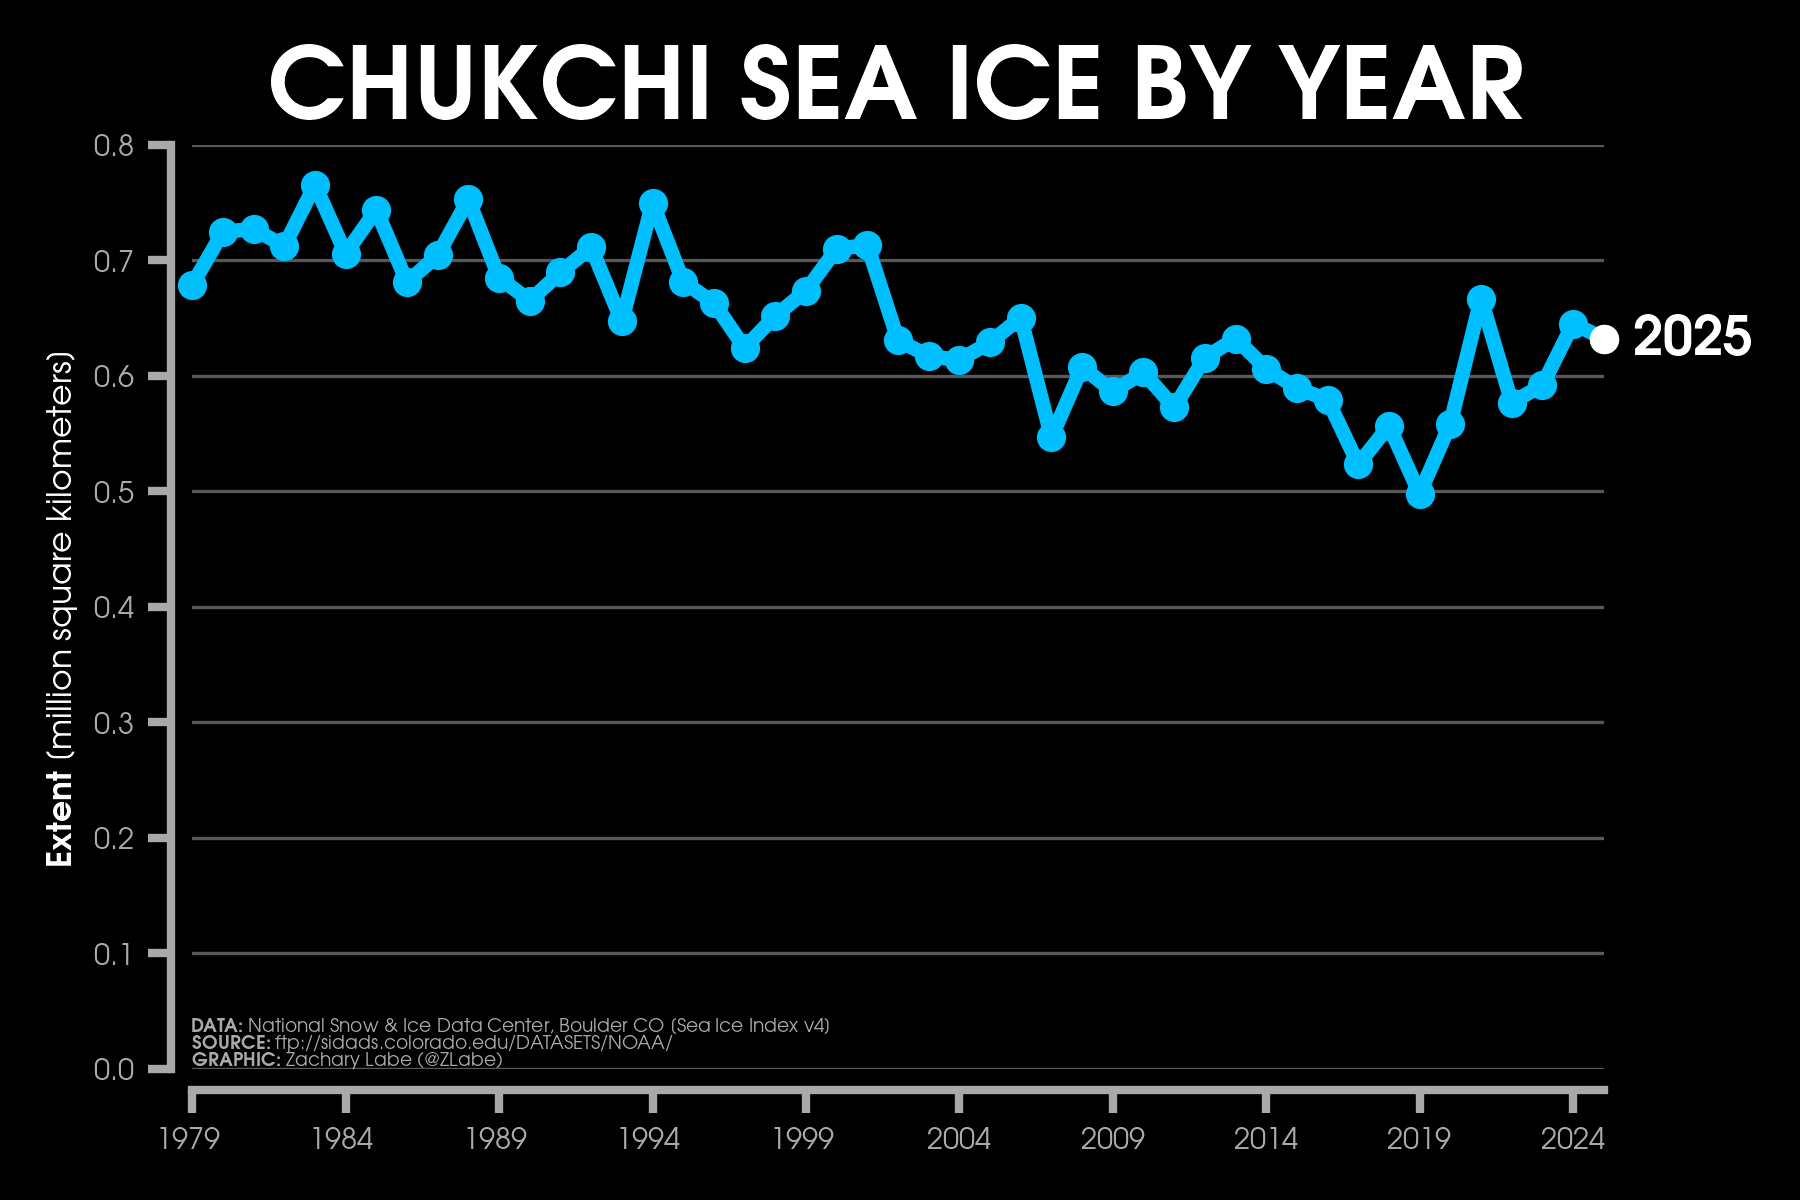
Ice Cover MetricsLine graph showing changes in the timing of the river ice breakup in Alaska for the Yukon, Tanana, and Kuskokwim Rivers from 1895 to 2024. Data and more background information is provided at https://www.epa.gov/climate-indicators/alaskan-rivers. Graphic updated on 8/10/2025.Line graph showing the net loss of ice mass for four different reference glaciers in the United States since the 1950s/1960s (states of Alaska and Washington). The change in mass in standardized in units of meters of water equivalent relative to the year 1965. Data and more background information is provided at https://www.epa.gov/climate-indicators/climate-change-indicators-glaciers.Line graph showing the annual percent of maximum ice cover across the Great Lakes from 1973 through 2025. Data is provided by the NOAA Great Lakes Environmental Research Laboratory (GLERL; https://www.glerl.noaa.gov/data/ice/#historical). A lowess smoothing fit is also shown for this time series (thin dashed white line) .Graphic was updated on 7/8/2025.Line graph showing annual mean Arctic sea-ice extent in the Beaufort Sea during the satellite era (1979-2025). Plot updated 1/4/2026 using NSIDC Sea Ice Index v4 (DMSP SSM/I-SSMIS, AMSR2).Line graph showing annual mean Arctic sea-ice extent in the Bering Sea during the satellite era (1979-2025). Plot updated 1/4/2026 using NSIDC Sea Ice Index v4 (DMSP SSM/I-SSMIS, AMSR2).Line graph showing annual mean Arctic sea-ice extent in the Chukchi Sea during the satellite era (1979-2025). Plot updated 1/4/2026 using NSIDC Sea Ice Index v4 (DMSP SSM/I-SSMIS, AMSR2).
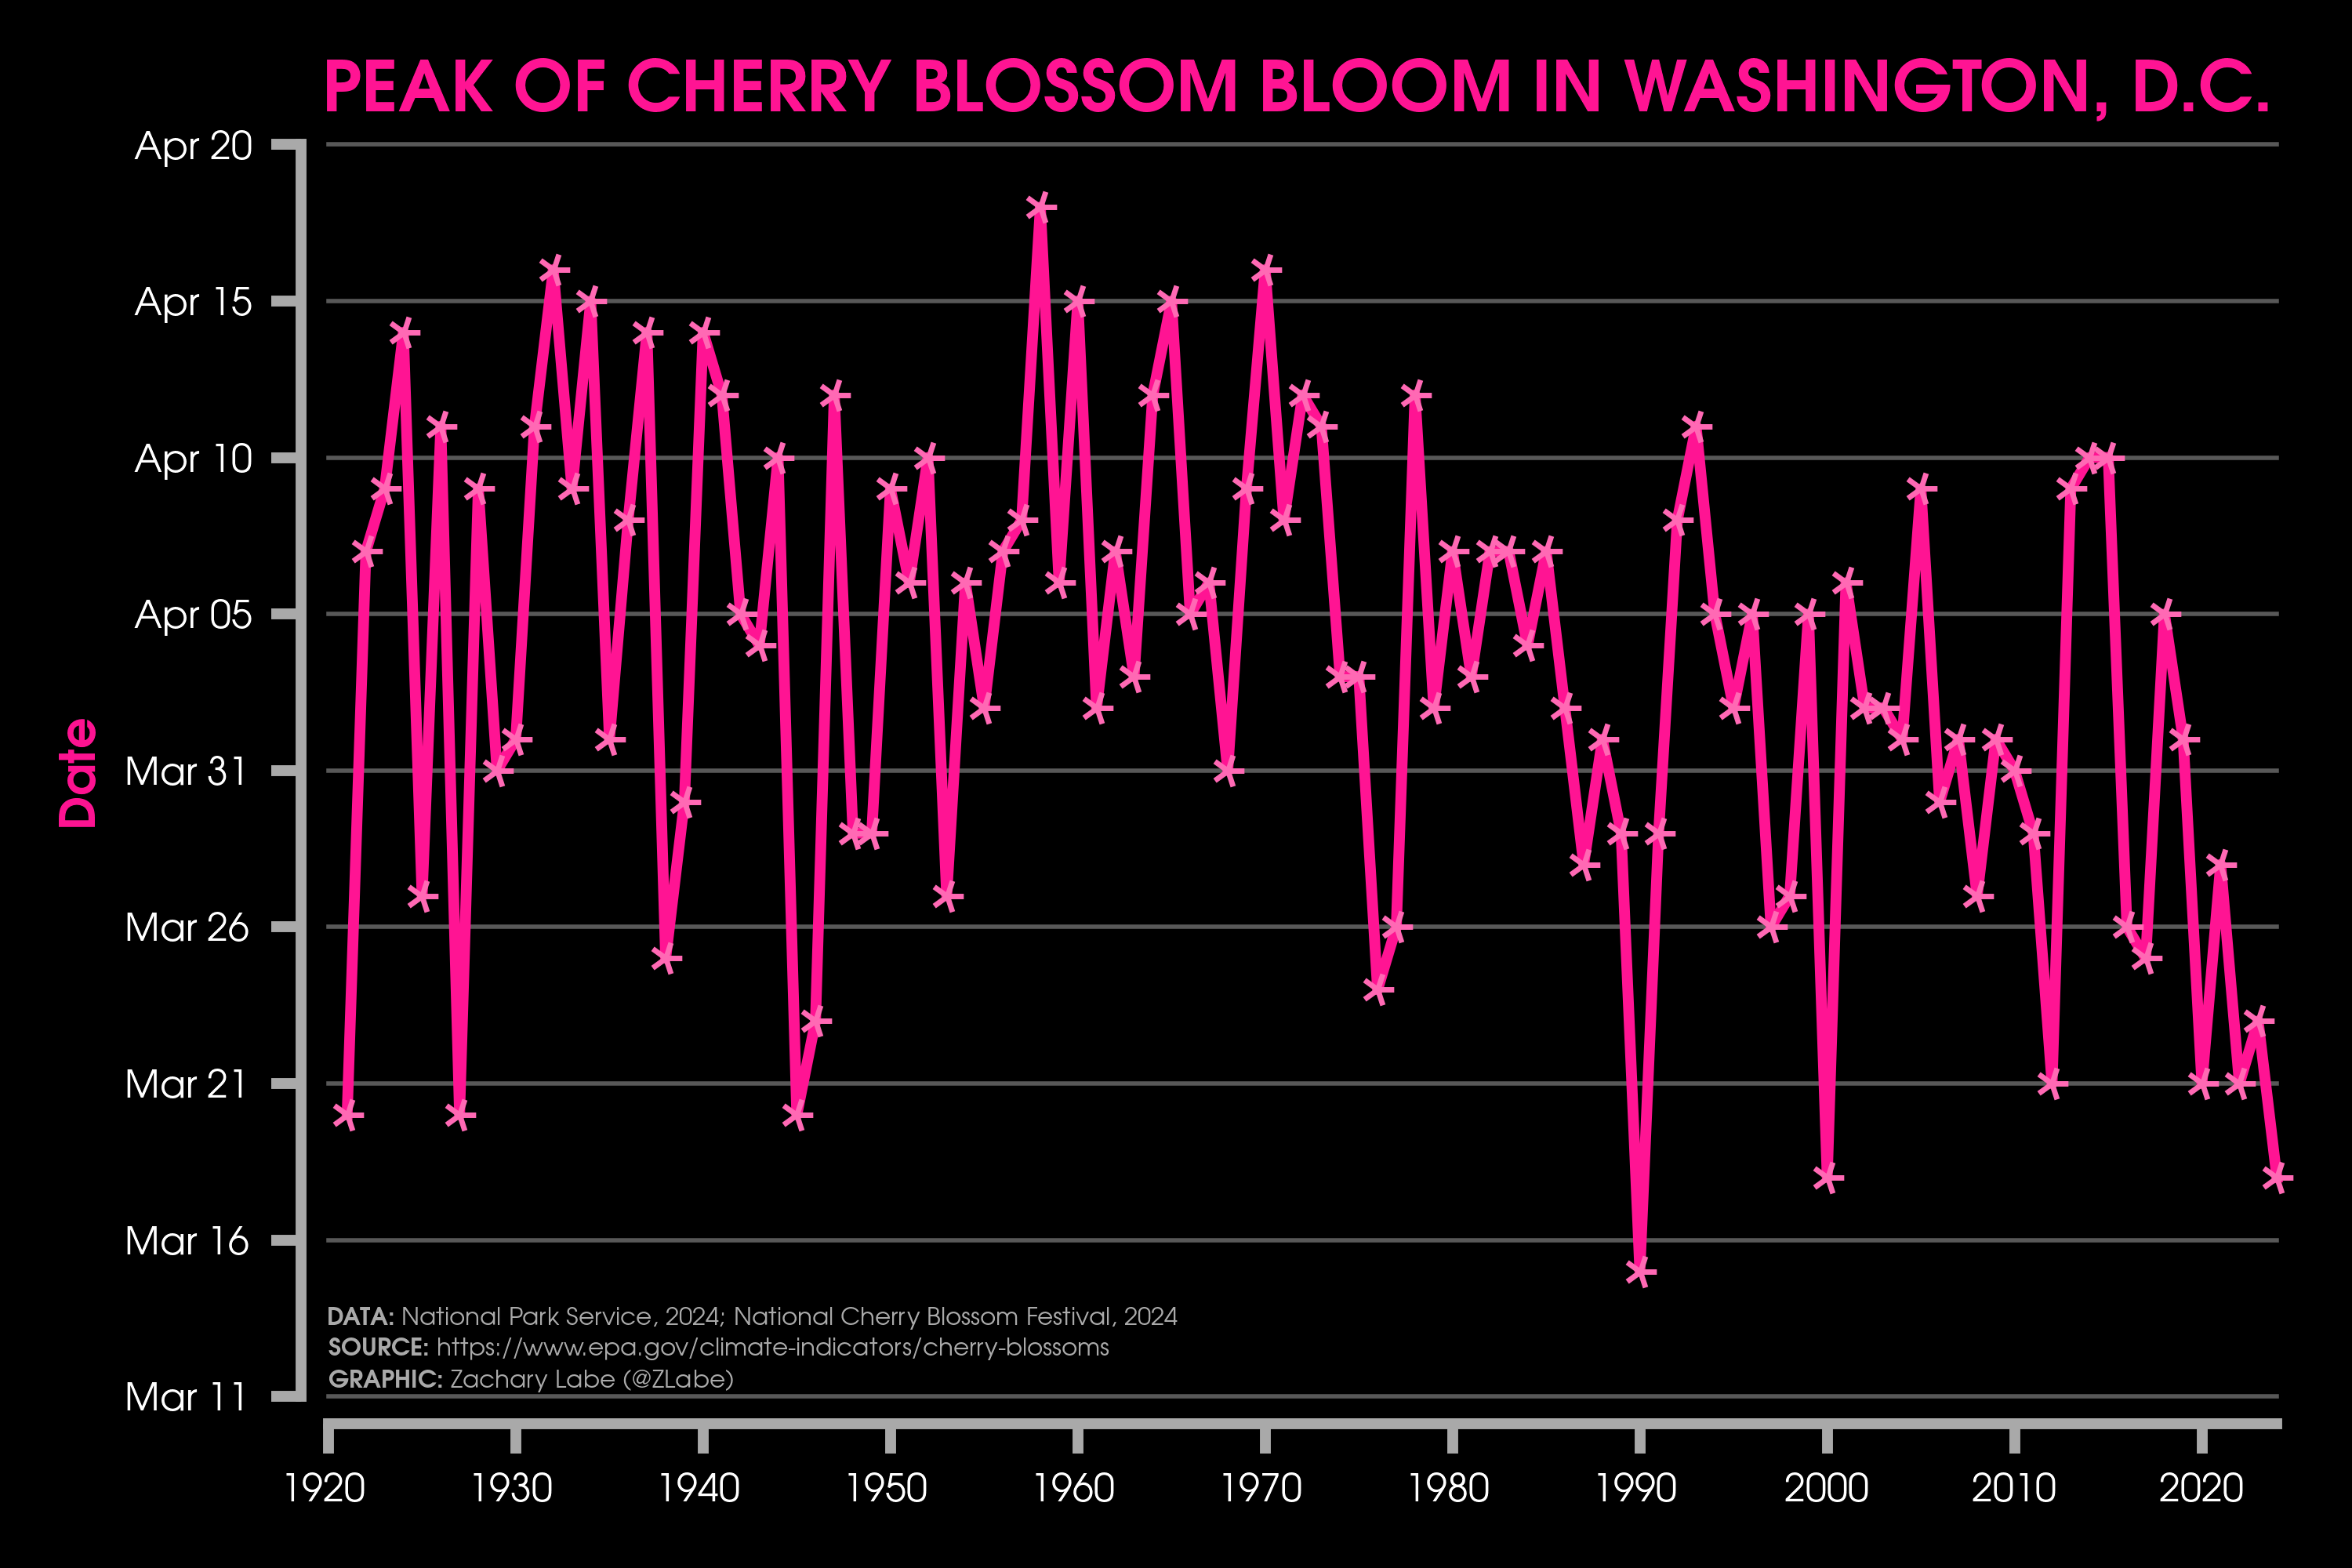
Ecological MetricsLine graph showing the timing of the peak bloom date of the cherry trees around Washington’s Tidal Basin (Yoshino variety, associated with the National Cherry Blossom Festival). Data from 1921 to 2024 provided by the National Park Service, and more background information is available at https://www.epa.gov/climate-indicators/cherry-blossoms. Graphic updated on 8/10/2025.
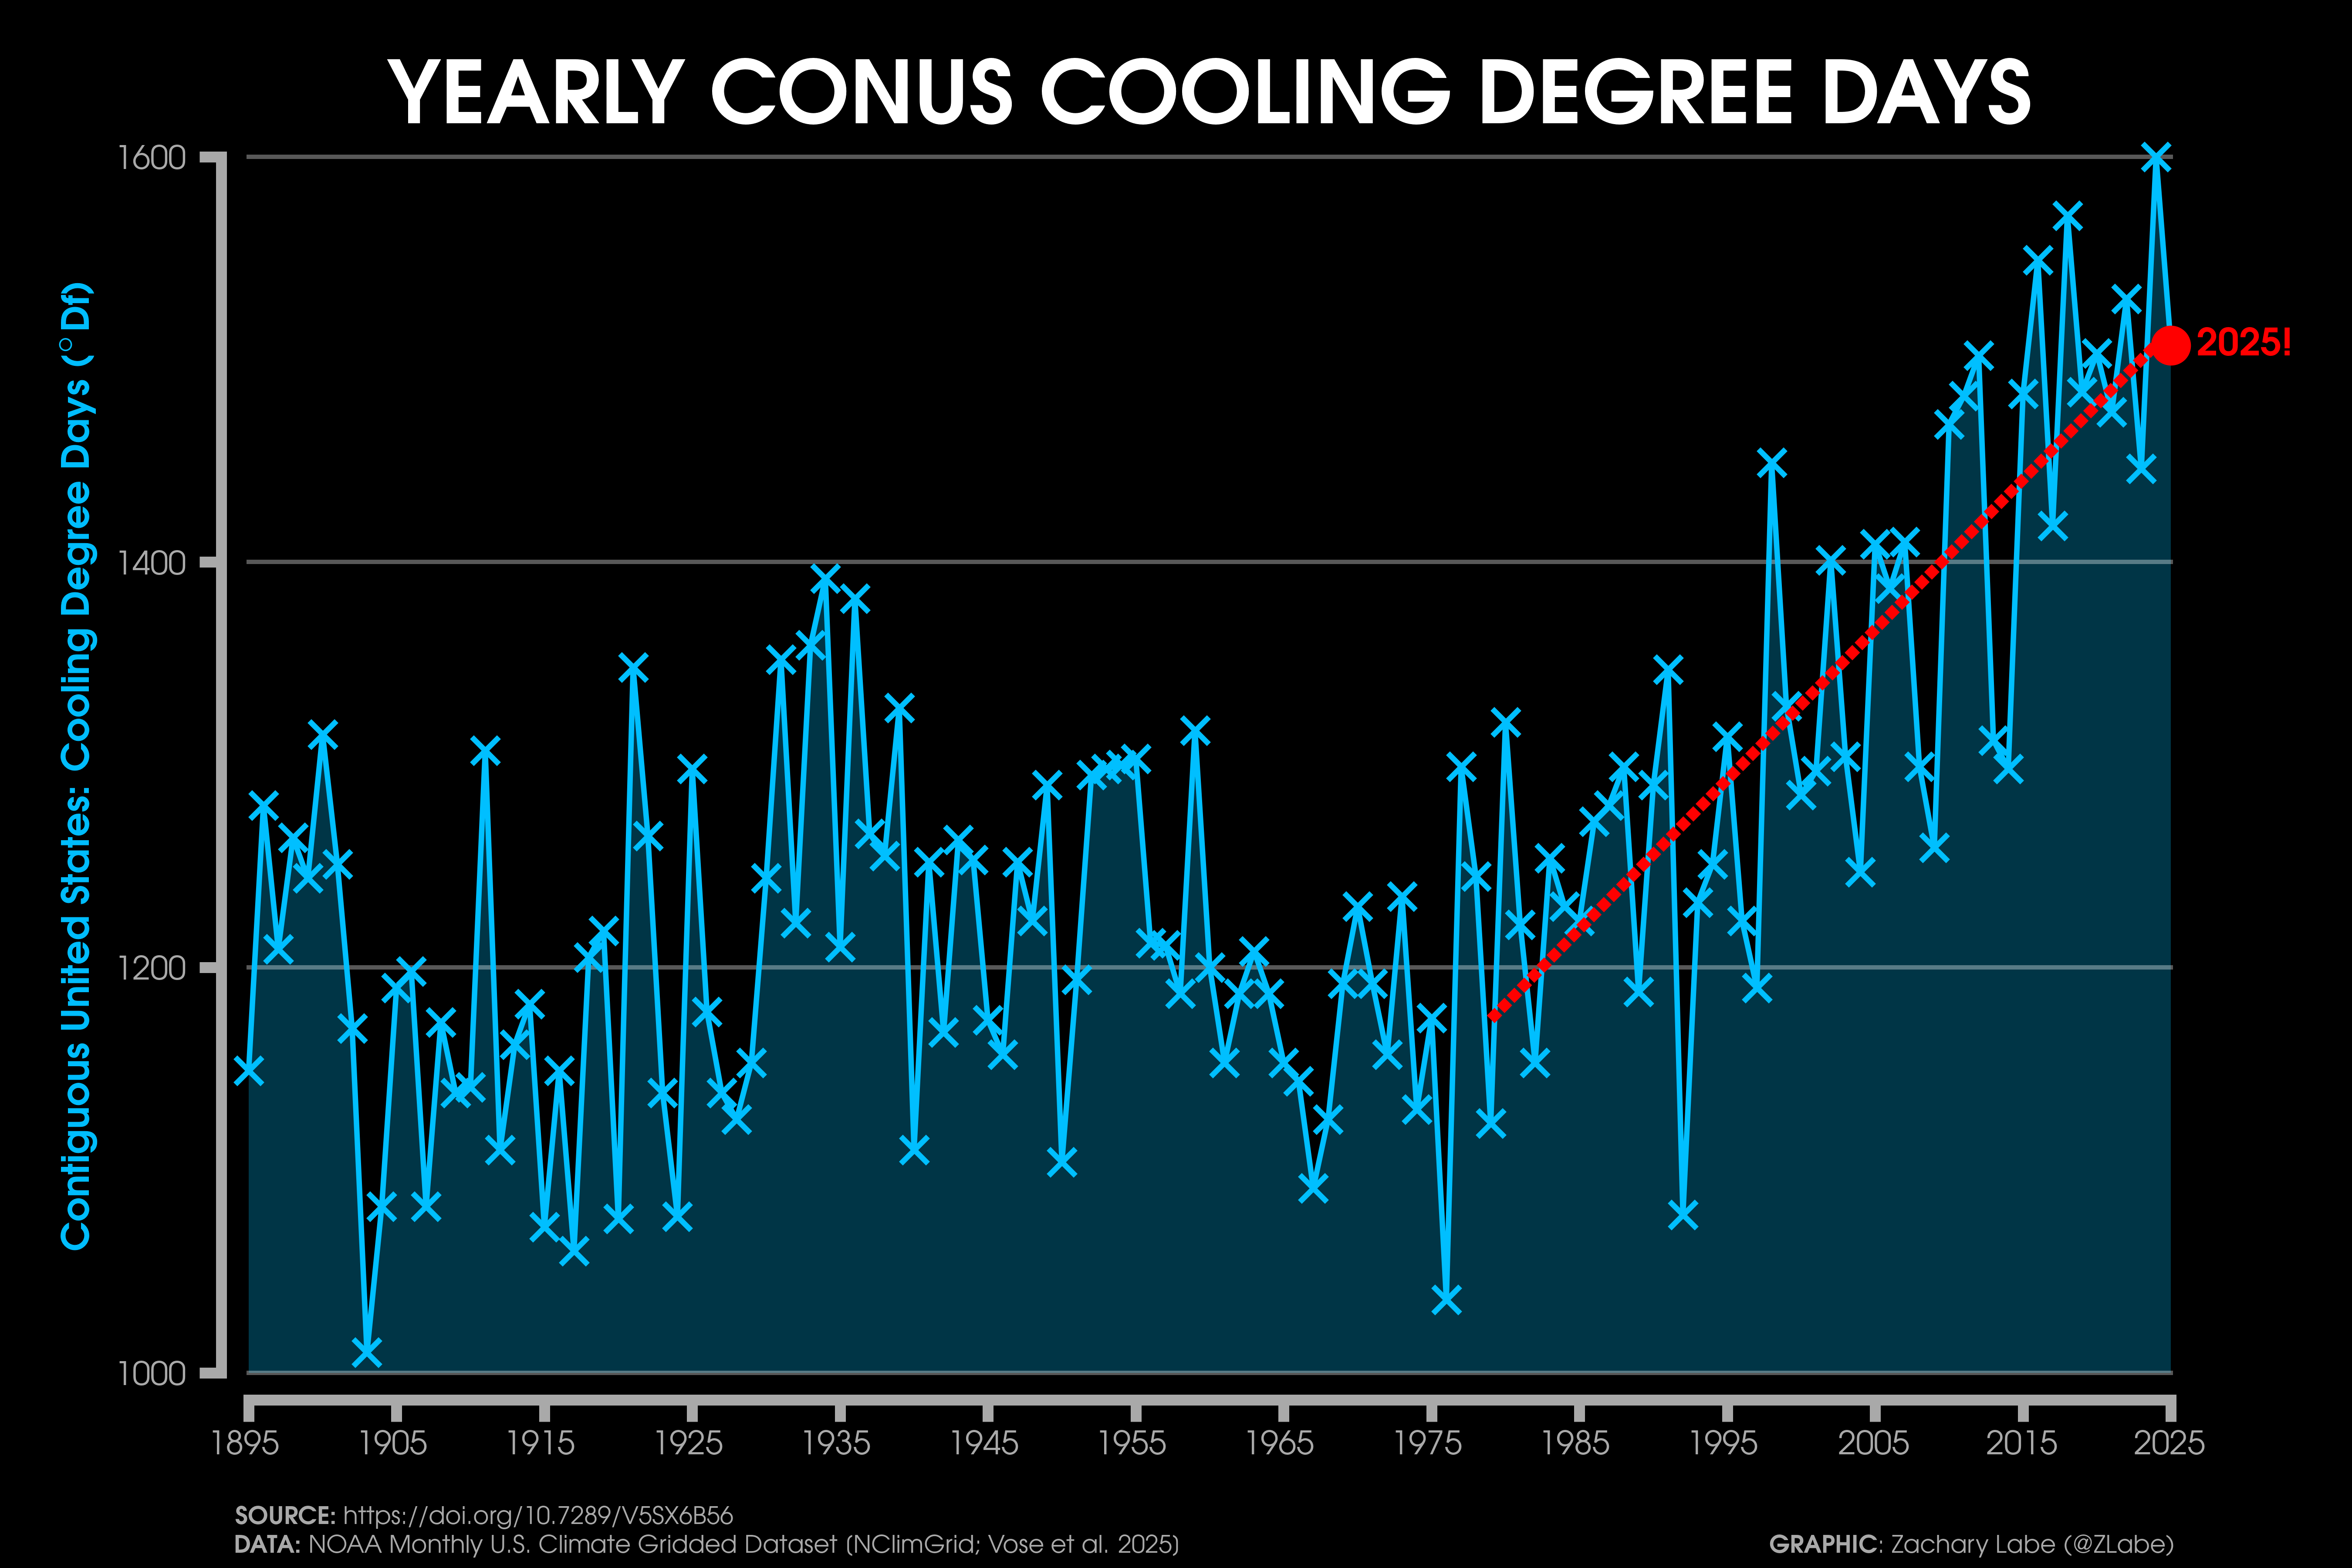
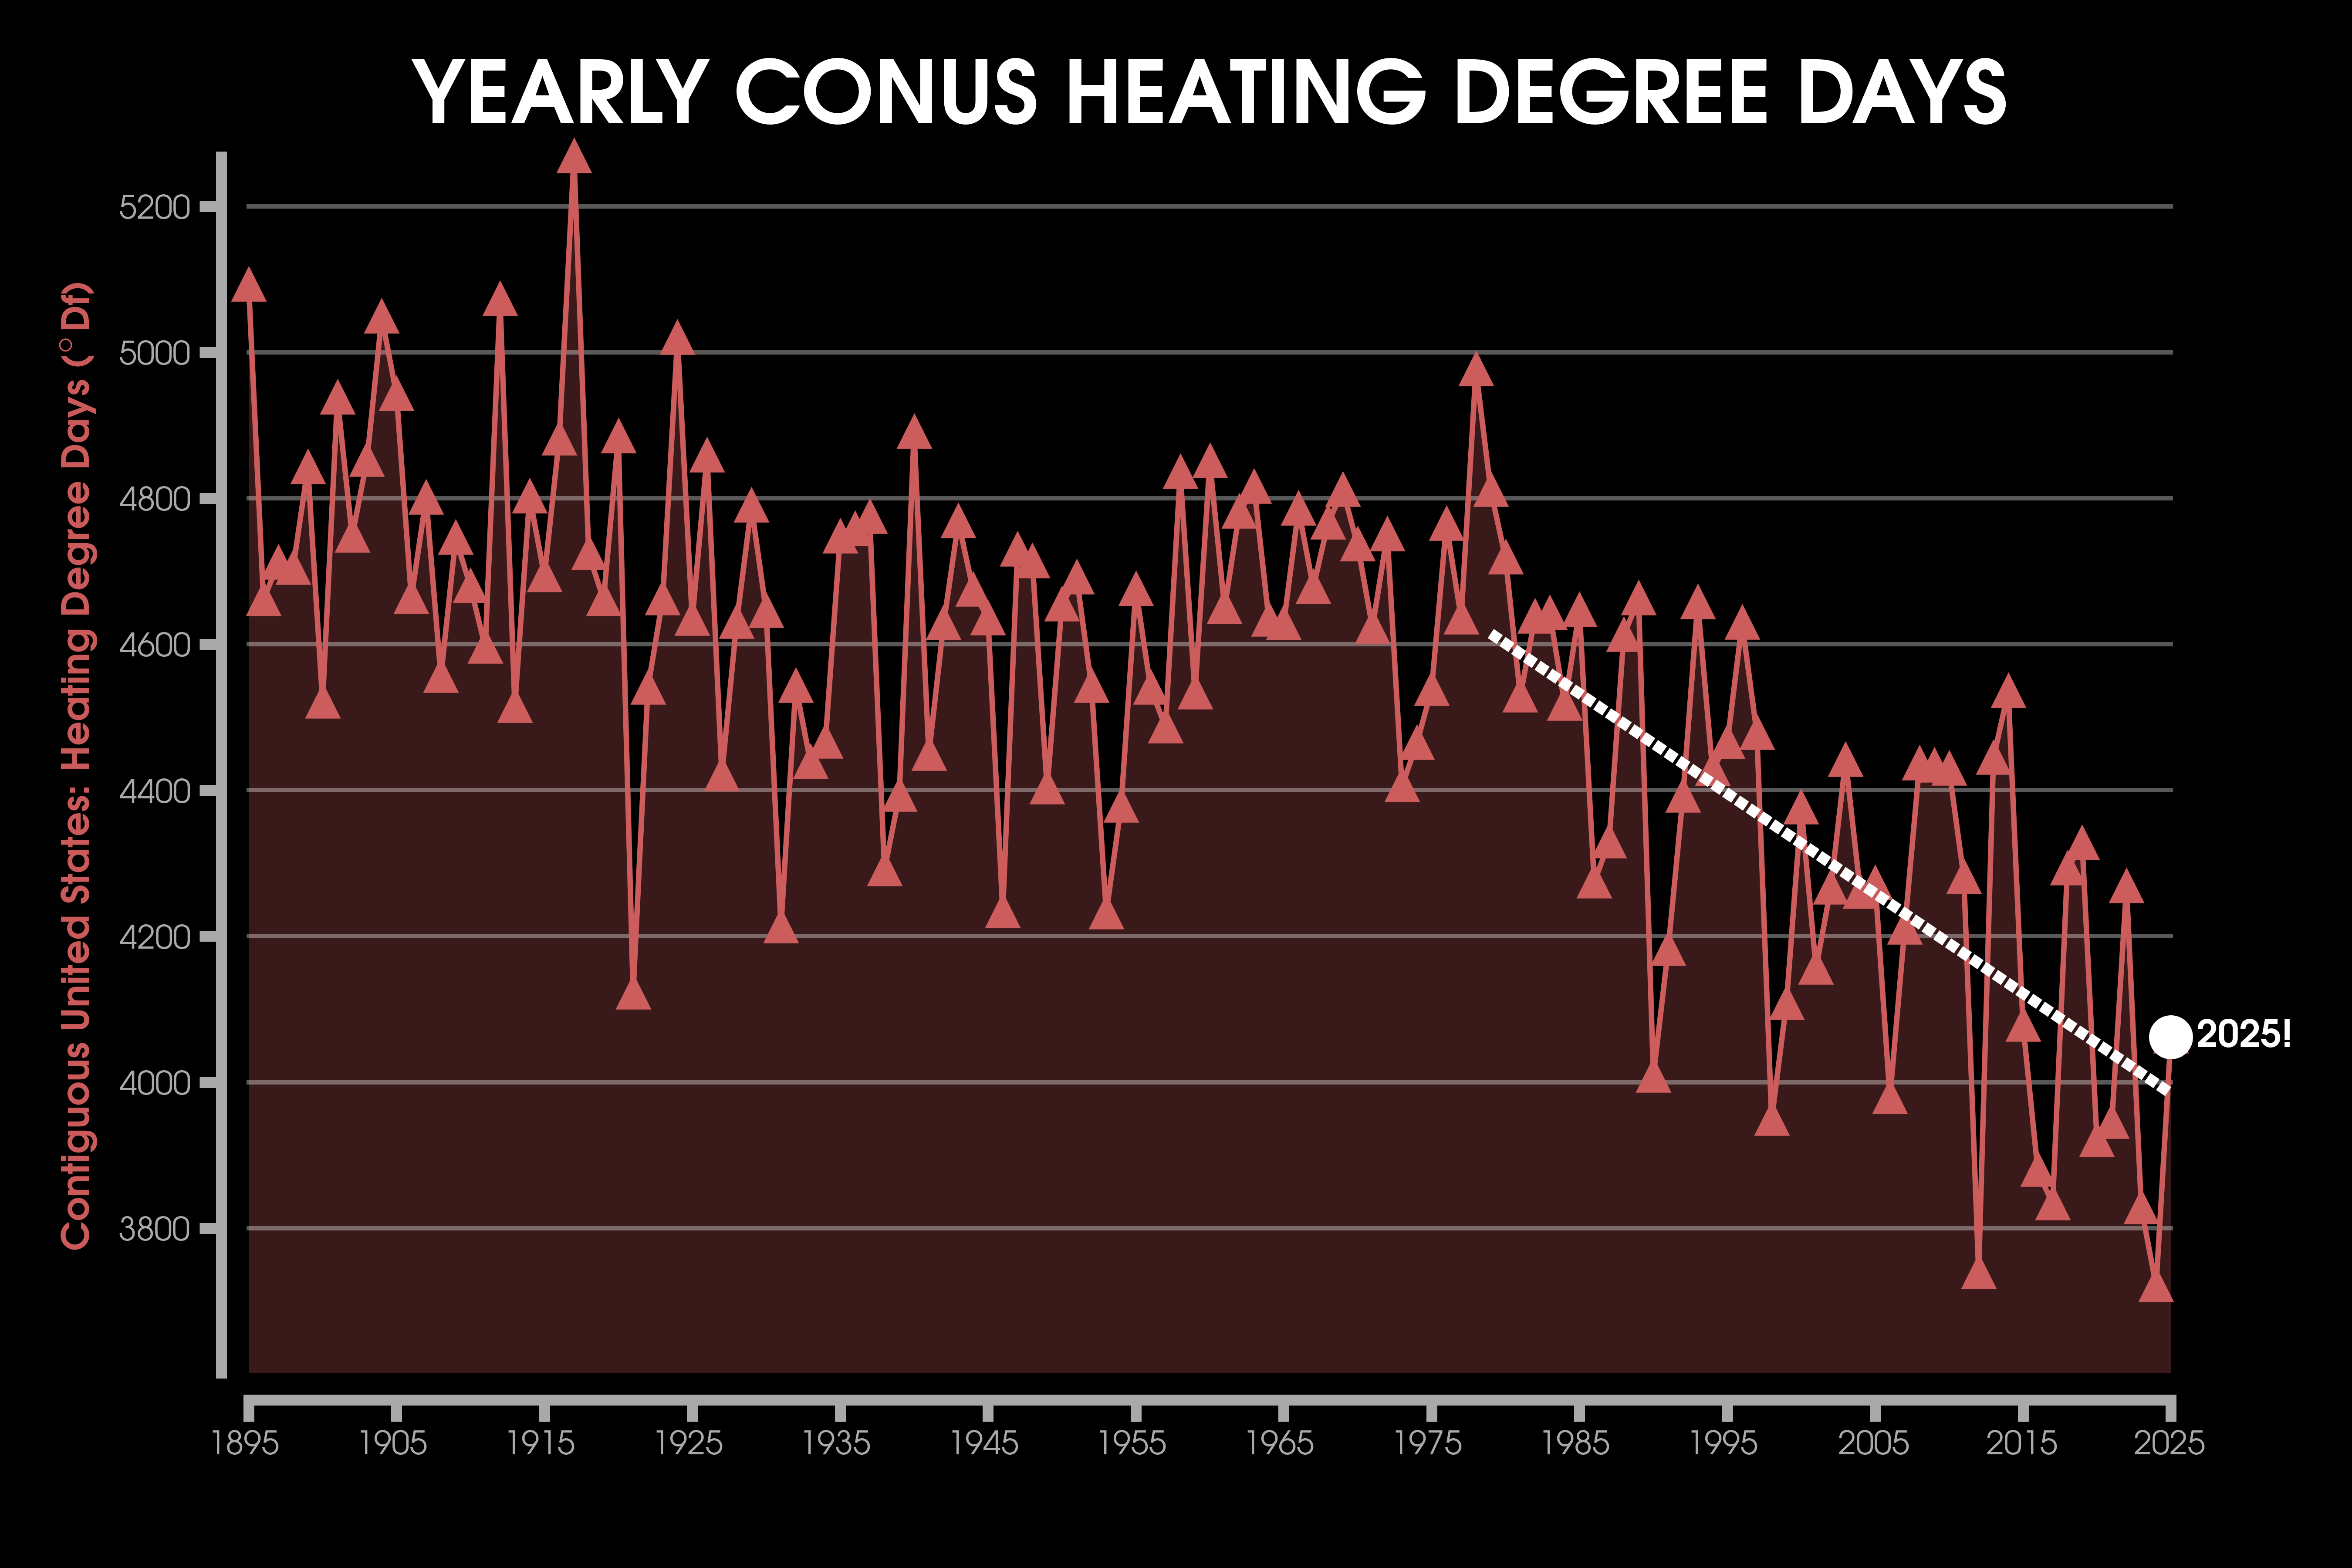
Energy SectorCooling degree days (CDD) calculated for the contiguous United States (CONUS) and averaged by each year from 1895 to 2025. A CDD is a helpful metric for monitoring energy usage (e.g., air conditioning) and is calculated based on how much warmer the average temperature is relative to 65°F. A linear (least squares) trend line is also annotated over the period from 1979 to 2025. Data is provided by NOAA’s Climate at a Glance (https://www.ncei.noaa.gov/access/monitoring/climate-at-a-glance/). Graphic was updated on 7/6/2025.Heating degree days (HDD) calculated for the contiguous United States (CONUS) and averaged by each year from 1895 to 2025. A HDD is a helpful metric for monitoring energy usage (e.g., heating needs) and is calculated based on how much colder the average temperature is relative to 65°F. A linear (least squares) trend line is also annotated over the period from 1979 to 2025. Data is provided by NOAA’s Climate at a Glance (https://www.ncei.noaa.gov/access/monitoring/climate-at-a-glance/). Graphic was updated on 1/17/2026.
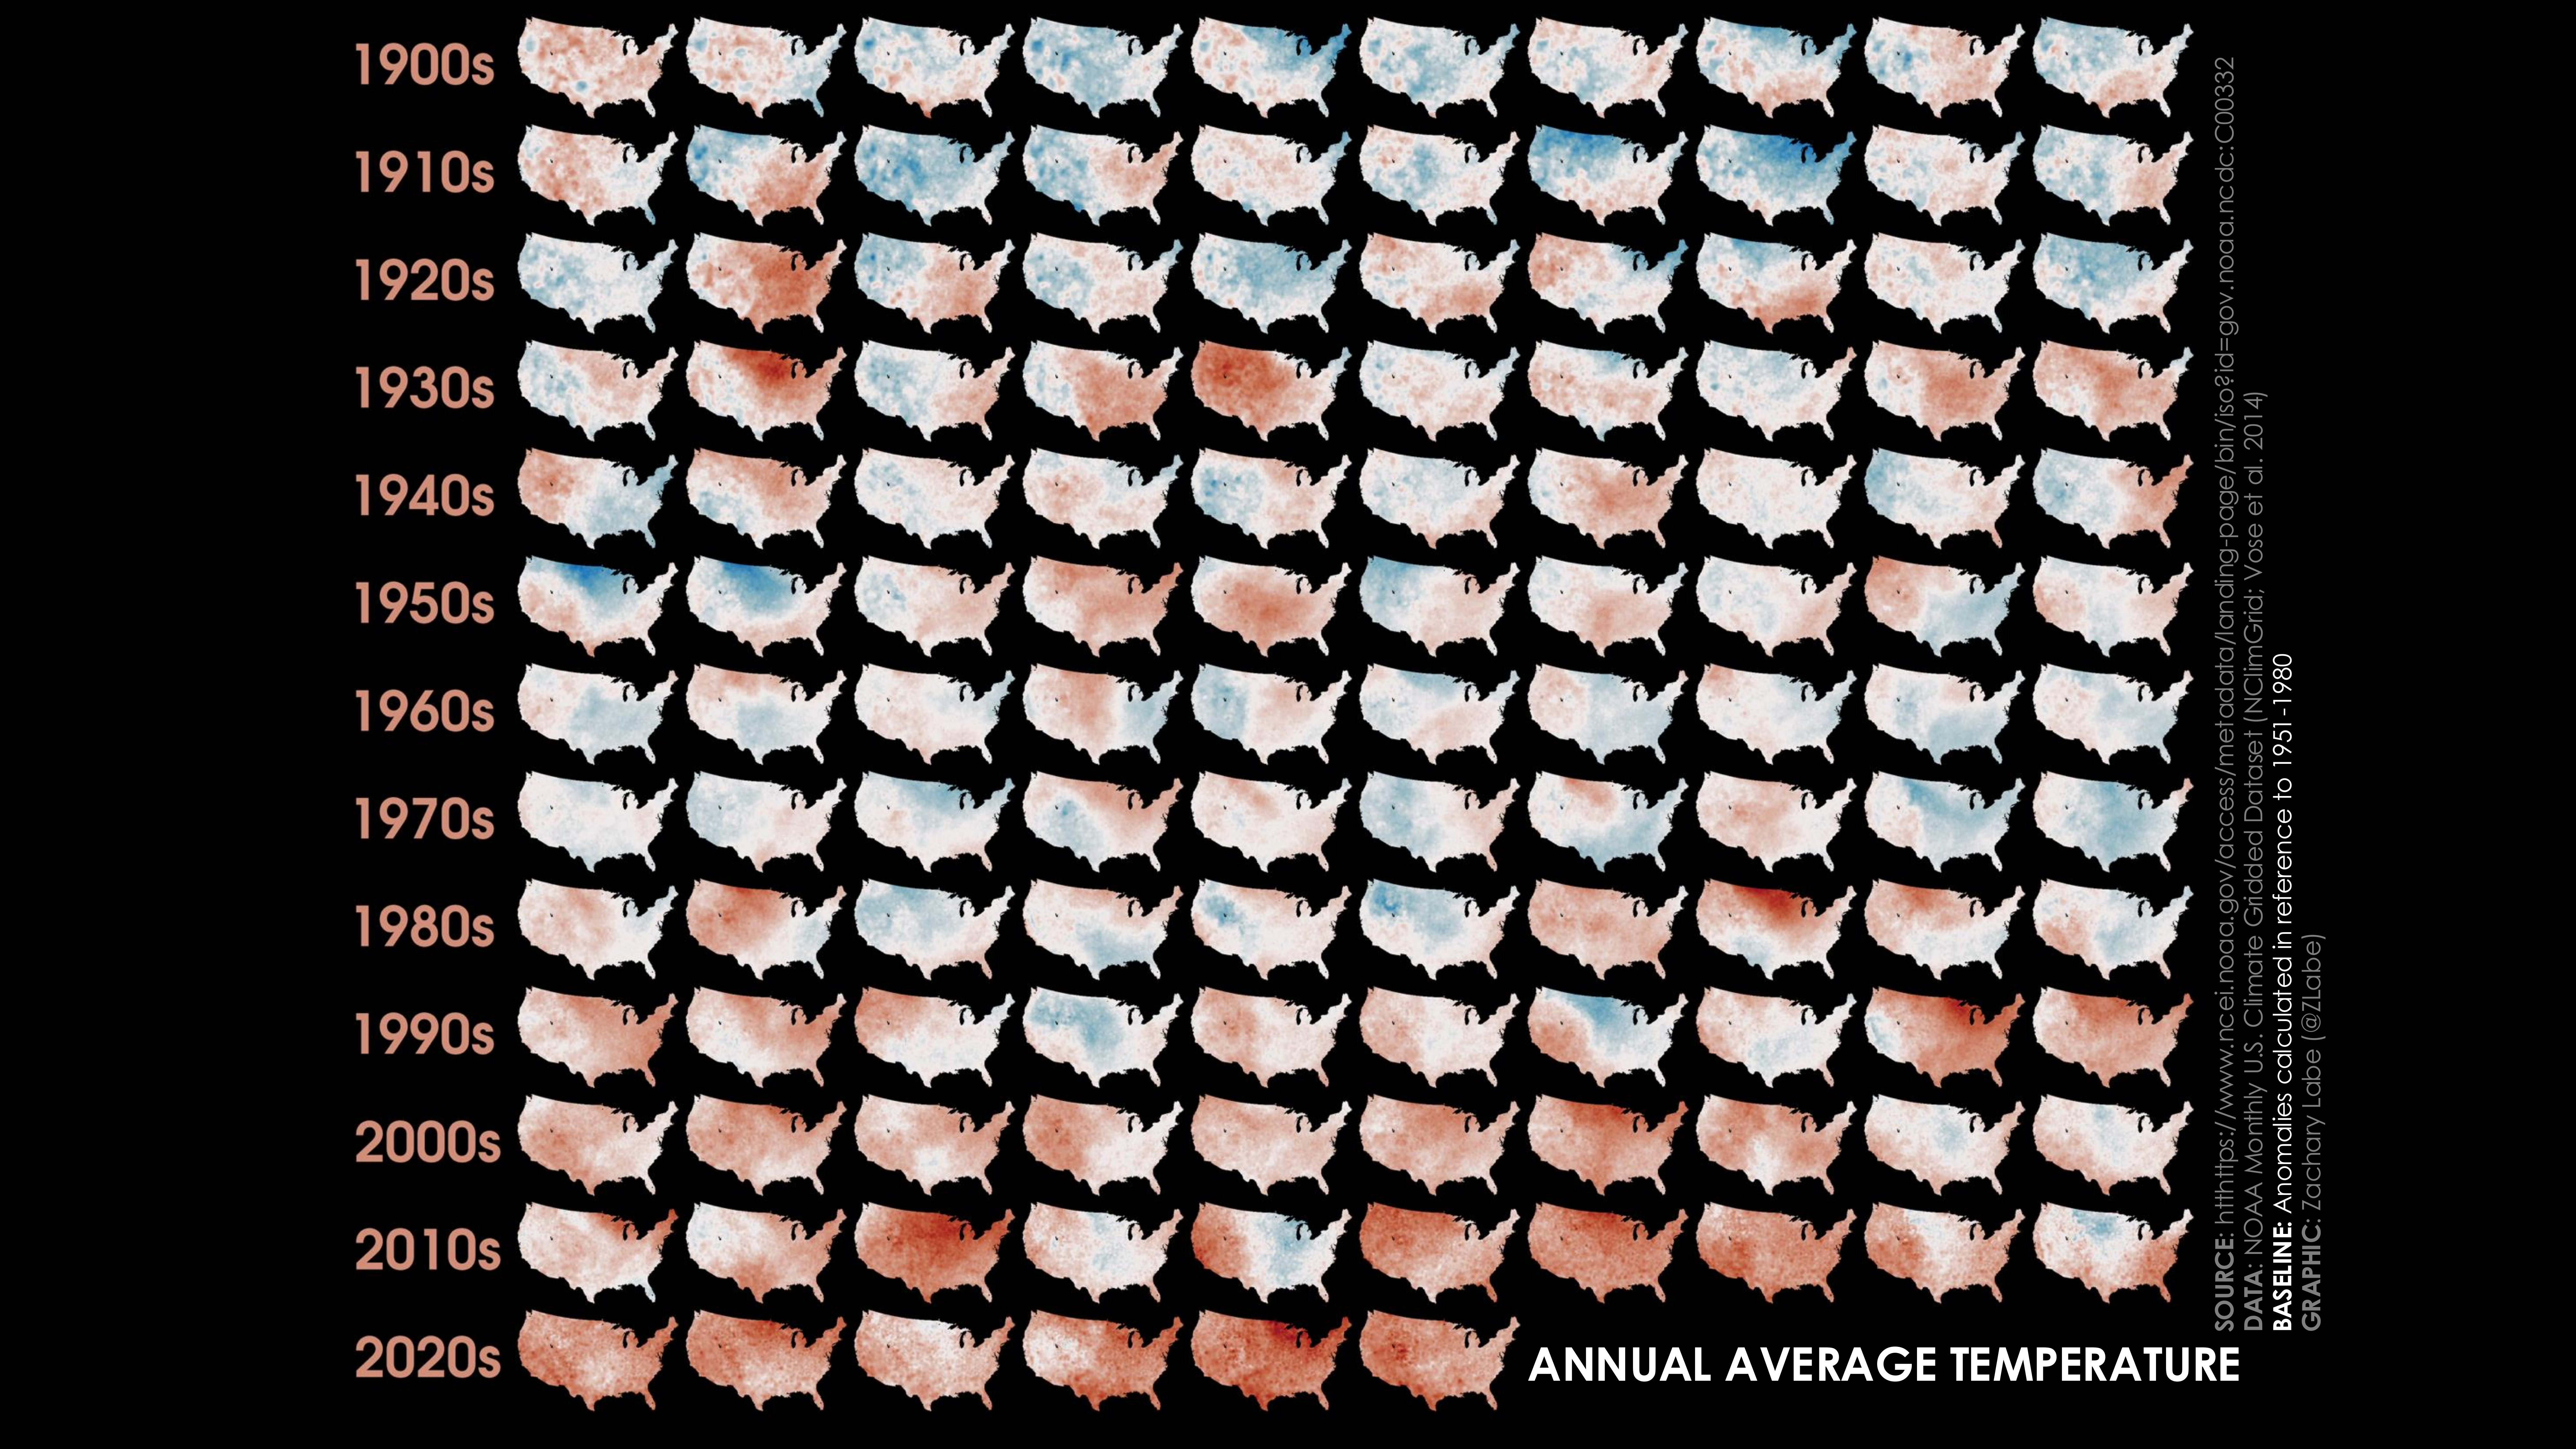
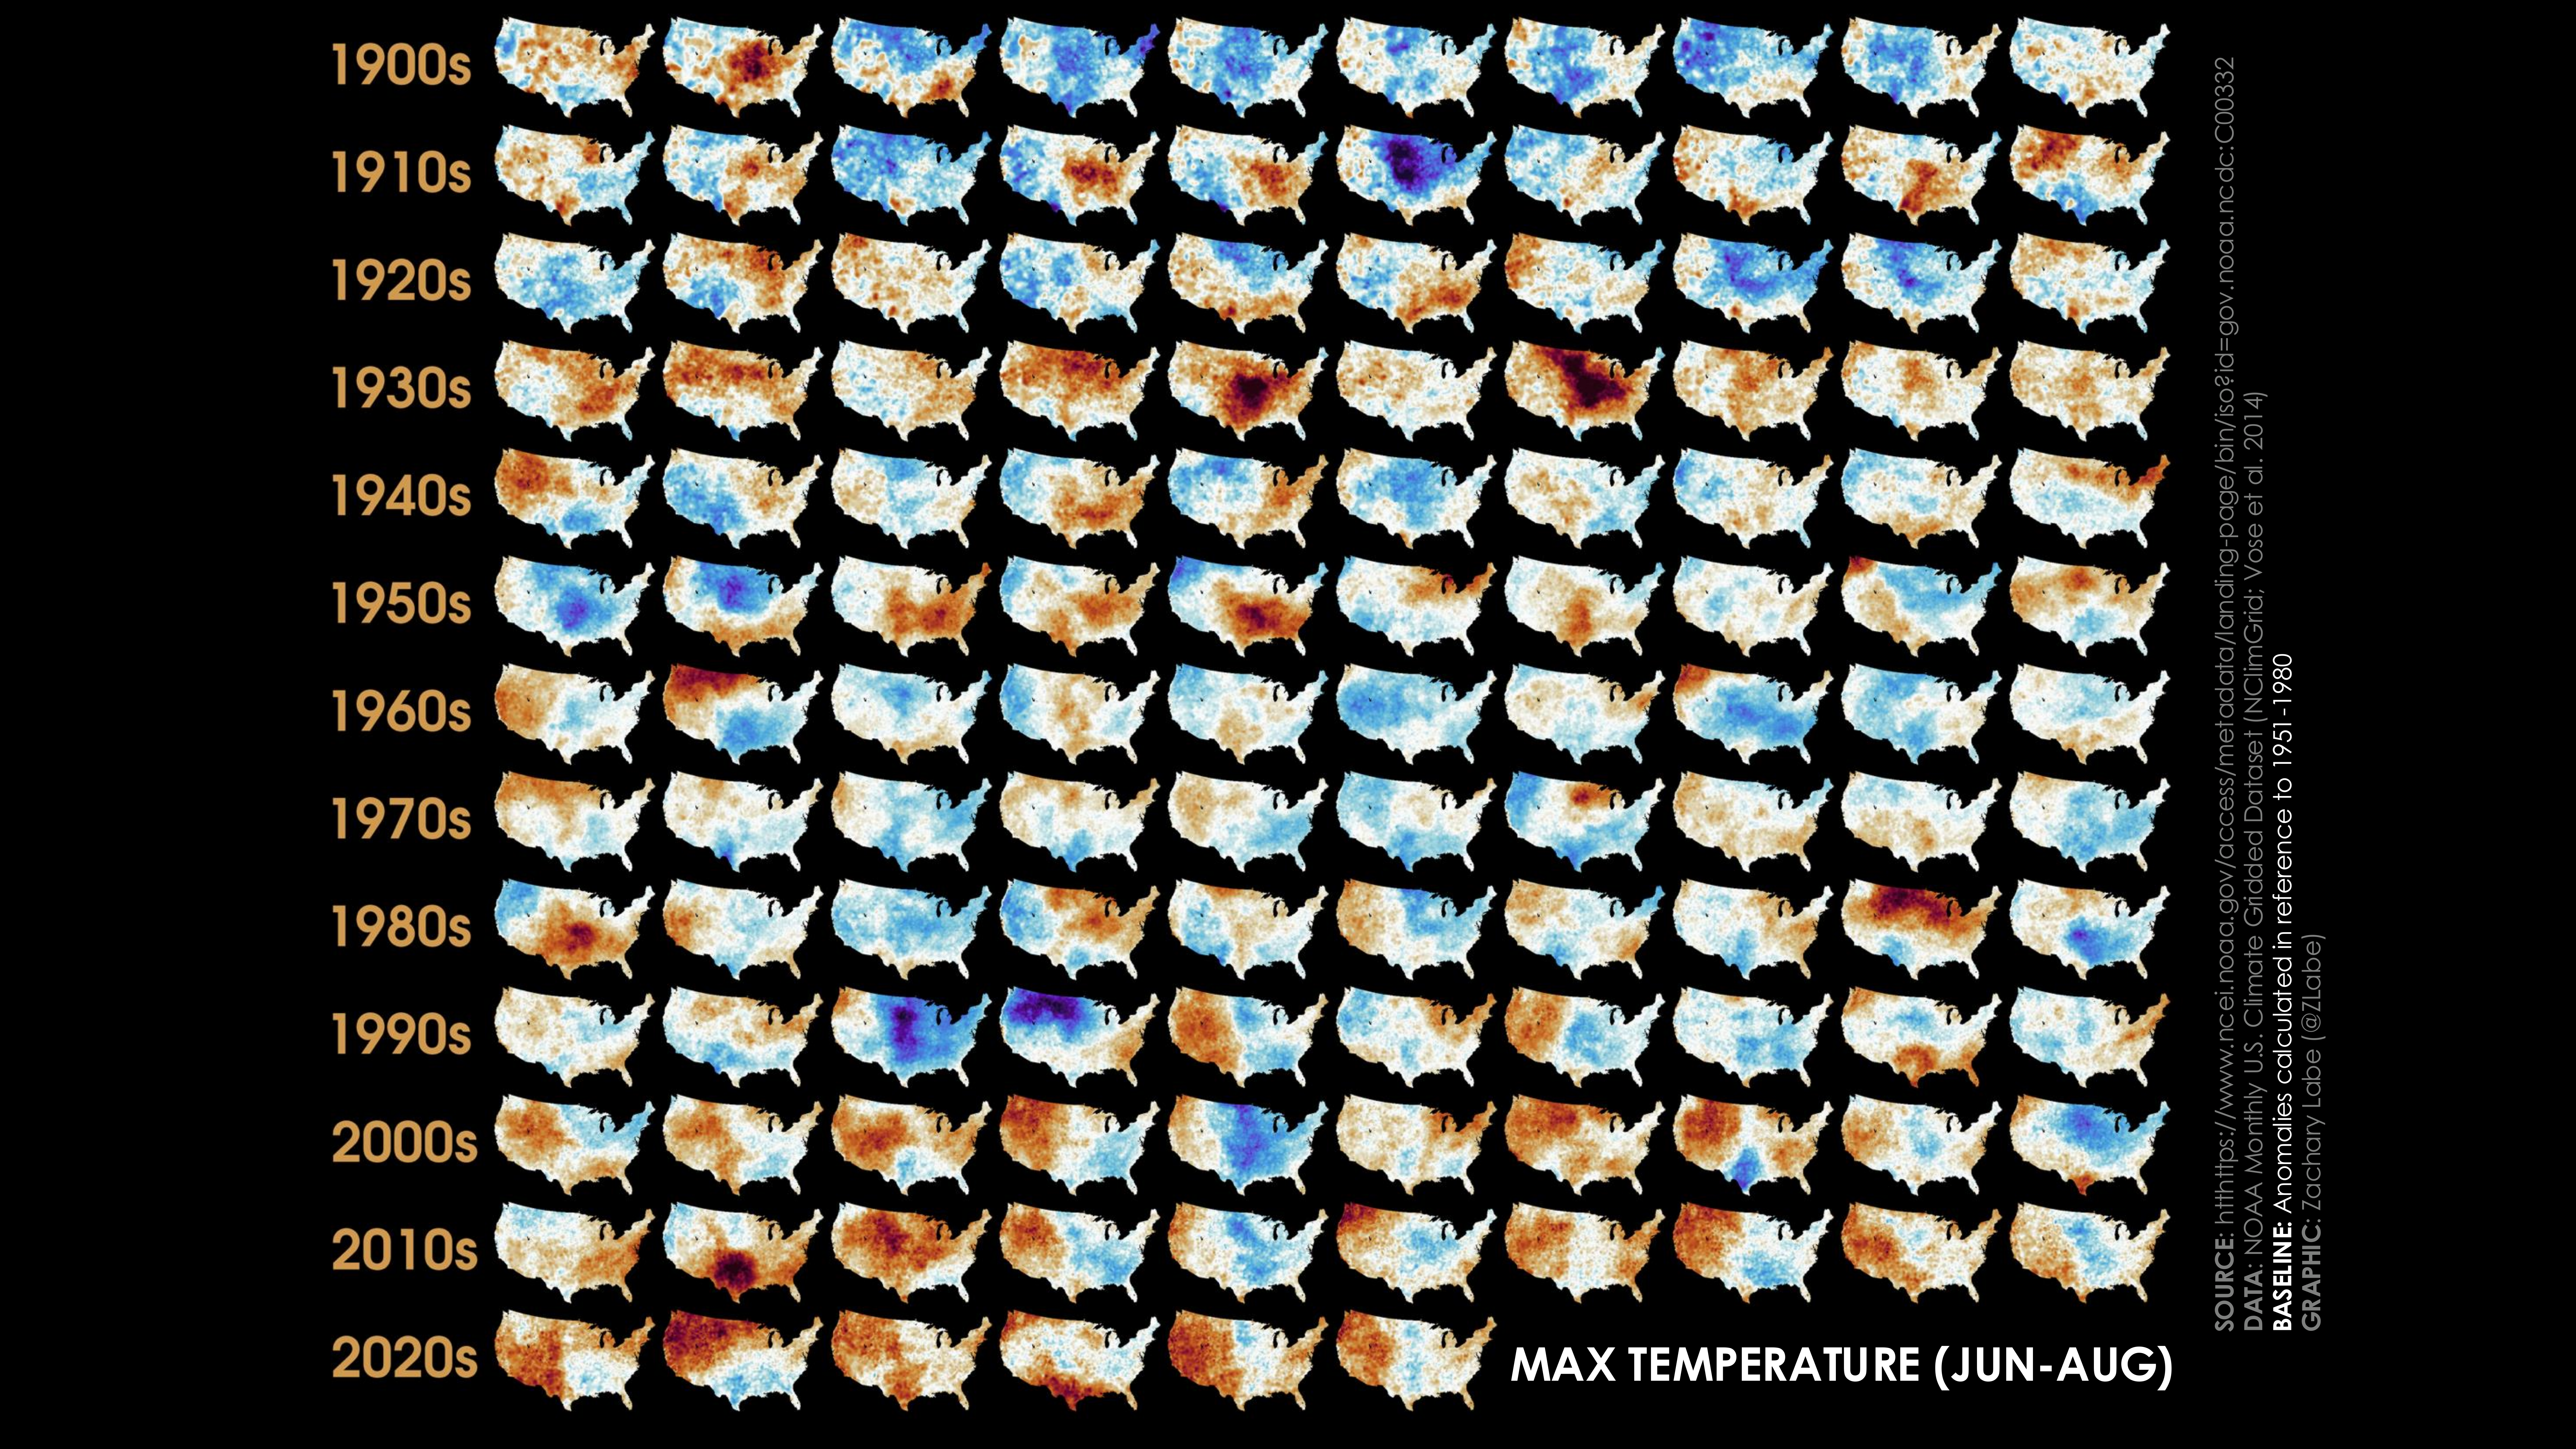
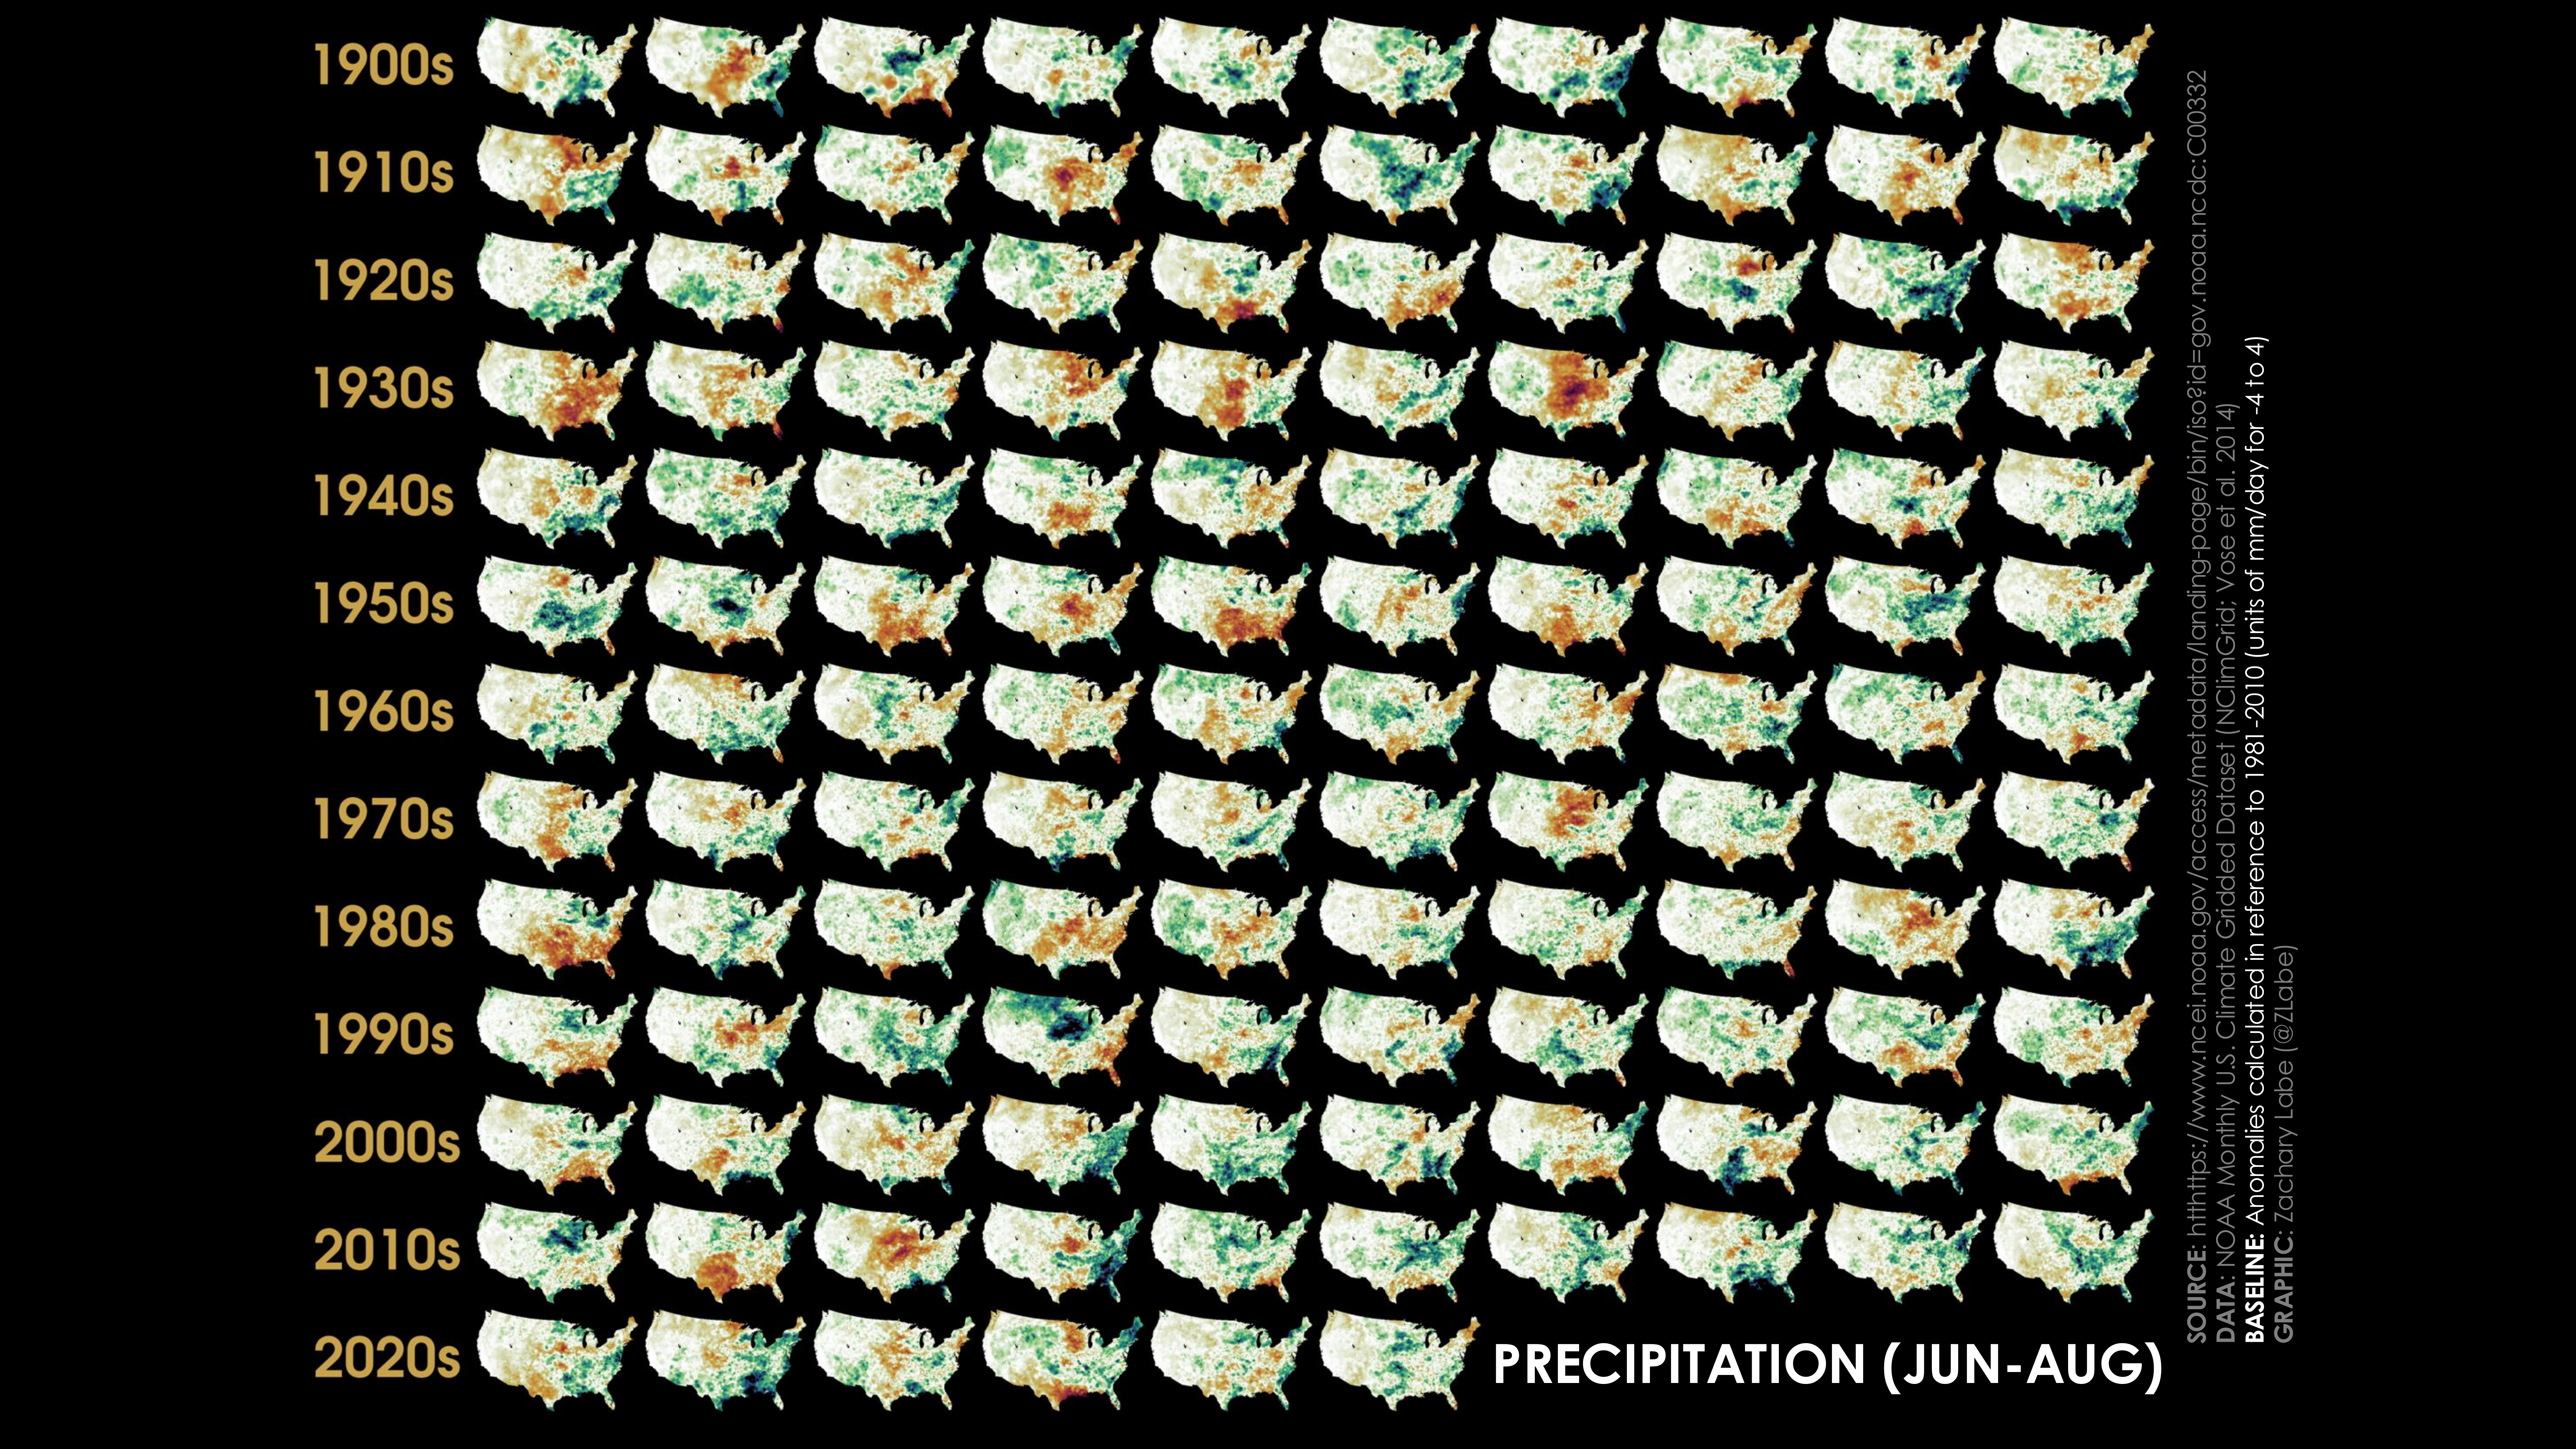
Storyline Figures: Climate Variability and ChangeCollection of maps showing average annual mean surface air temperature anomalies from 1900 to 2025. Anomalies are calculated in reference to a 1951 to 1980 climatological baseline. The temperature maps are organized by decade for each row and scaled between -5°C (purple shading) and +5°C (red shading). Data is from NClimGrid v1 (https://www.ncei.noaa.gov/access/metadata/landing-page/bin/iso?id=gov.noaa.ncdc:C00332). Created on 24 January 2026Collection of maps showing average June-July-August maximum surface air temperature anomalies from 1900 to 2025. Anomalies are calculated in reference to a 1951 to 1980 climatological baseline. The temperature maps are organized by decade for each row and scaled between -5°C (purple shading) and +5°C (red shading). Data is from NClimGrid v1 (https://www.ncei.noaa.gov/access/metadata/landing-page/bin/iso?id=gov.noaa.ncdc:C00332). Created on 24 January 2026.Collection of maps showing average June-July-August precipitation rate anomalies from 1900 to 2025. Anomalies are calculated in reference to a 1981 to 2010 climatological baseline. The precipitation maps are organized by decade for each row and scaled between -4 mm/day (brown shading) and +4 mm/day (green shading). Data is from NClimGrid v1 (https://www.ncei.noaa.gov/access/metadata/landing-page/bin/iso?id=gov.noaa.ncdc:C00332). Created on 25 January 2026.
Storyline Figures: Climate Model EvaluationLine graph of mean June-August mean temperature anomalies over the contiguous United States from 1921 to 2022 for the ensemble mean of SPEAR_MED (bright red line) compared to observations from NClimGrid (dashed while line). The spread across SPEAR_MED ensemble members is shown with the light red shading. Anomalies are computed for each data set with respect to their own 1981–2010 climatological mean. Data for SPEAR_MED is from https://nomads.gfdl.noaa.gov/ and NClimGrid is from https://doi.org/10.7289/V5SX6B56. Figure is adapted from Labe et al. (2024, EF).
[8] Kalashnikov, D.A., F.V. Davenport, Z.M. Labe, P.C. Loikith, J.T. Abatzoglou, and D. Singh (2024). Predicting cloud-to-ground lightning in the Western United States from the large-scale environment using explainable neural networks. Journal of Geophysical Research: Atmospheres, DOI:10.1029/2024JD042147 [HTML][BibTeX][Code][Data]
[7] Schreck III, C.M., D.R. Easterling, J.J. Barsugli, D.A. Coates, A. Hoell, N.C. Johnson, K.E. Kunkel, Z.M. Labe, J. Uehling, R.S. Vose, and X. Zhang (2024). A rapid response process for evaluating causes of extreme temperature events in the United States: the 2023 Texas/Louisiana heatwave as a prototype. Environmental Research: Climate, DOI:10.1088/2752-5295/ad8028 [HTML][BibTeX] [Press Release] [Climate Model Monitoring Metrics][Observational Monitoring Metrics]
[6] Kretschmer, M., A. Jézéquel, Z.M. Labe, and D. Touma (2024). A shifting climate: new paradigms and challenges for (early career) scientists in extreme weather research. Atmospheric Science Letters, DOI:10.1002/asl.1268 [HTML][BibTeX]
[5] Zhang, Y., B.M. Ayyub, J.F. Fung, and Z.M. Labe (2024). Incorporating extreme event attribution into climate change adaptation for civil infrastructure: Methods, benefits, and research needs. Resilient Cities and Structures, DOI:10.1016/j.rcns.2024.03.002 [HTML][BibTeX] [Carbon Brief]
[3] Eischeid, J.K., M.P. Hoerling, X.-W. Quan, A. Kumar, J. Barsugli, Z.M. Labe, K.E. Kunkel, C.J. Schreck III, D.R. Easterling, T. Zhang, J. Uehling, and X. Zhang (2023). Why has the summertime central U.S. warming hole not disappeared? Journal of Climate, DOI:10.1175/JCLI-D-22-0716.1 [HTML][BibTeX] [Fox 32 Chicago][NOAA CPO][NOAA Climate(dot)gov][Wired]
[2] Thoman, R.L., U. Bhatt, P. Bieniek, B. Brettschneider, M. Brubaker, S. Danielson, Z.M. Labe, R. Lader, W. Meier, G. Sheffield, and J. Walsh (2019): The record low Bering Sea ice extent in 2018: Context, impacts and an assessment of the role of anthropogenic climate change [in “Explaining Extreme Events of 2018 from a Climate Perspective”]. Bull. Amer. Meteor. Soc, DOI:10.1175/BAMS-D-19-0175.1 [HTML][BibTeX] [Press Release]
The views presented here only reflect my own. These figures may be freely distributed (with credit). Information about the data can be found on my references page and methods page.