Hi! My name is Zack! I’m a climate scientist looking to find the signal in all the noise. I use data-driven methods to untangle climate change patterns from natural variability, providing clearer insights into climate risks. I also spend a lot of time thinking about how to make science more engaging through storytelling and visualization.
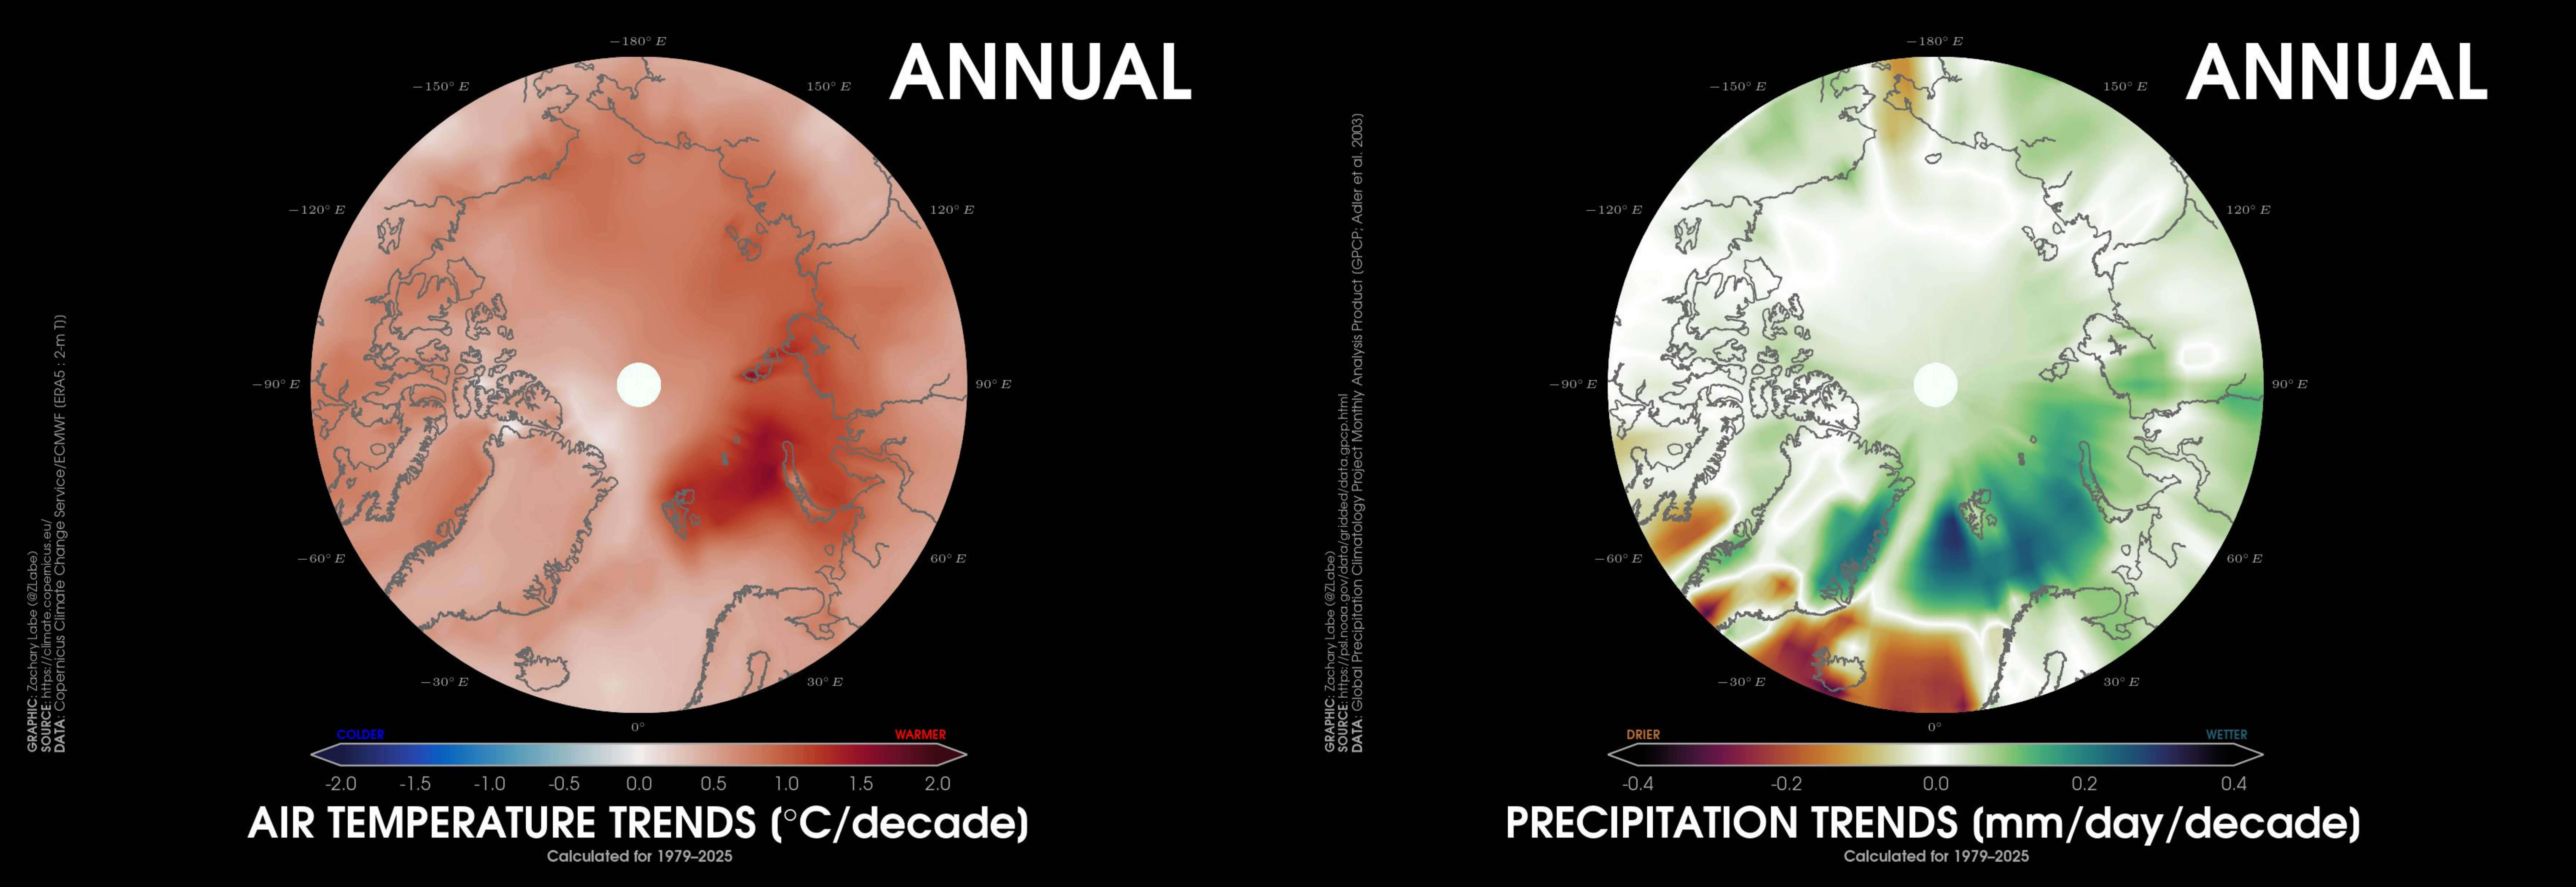
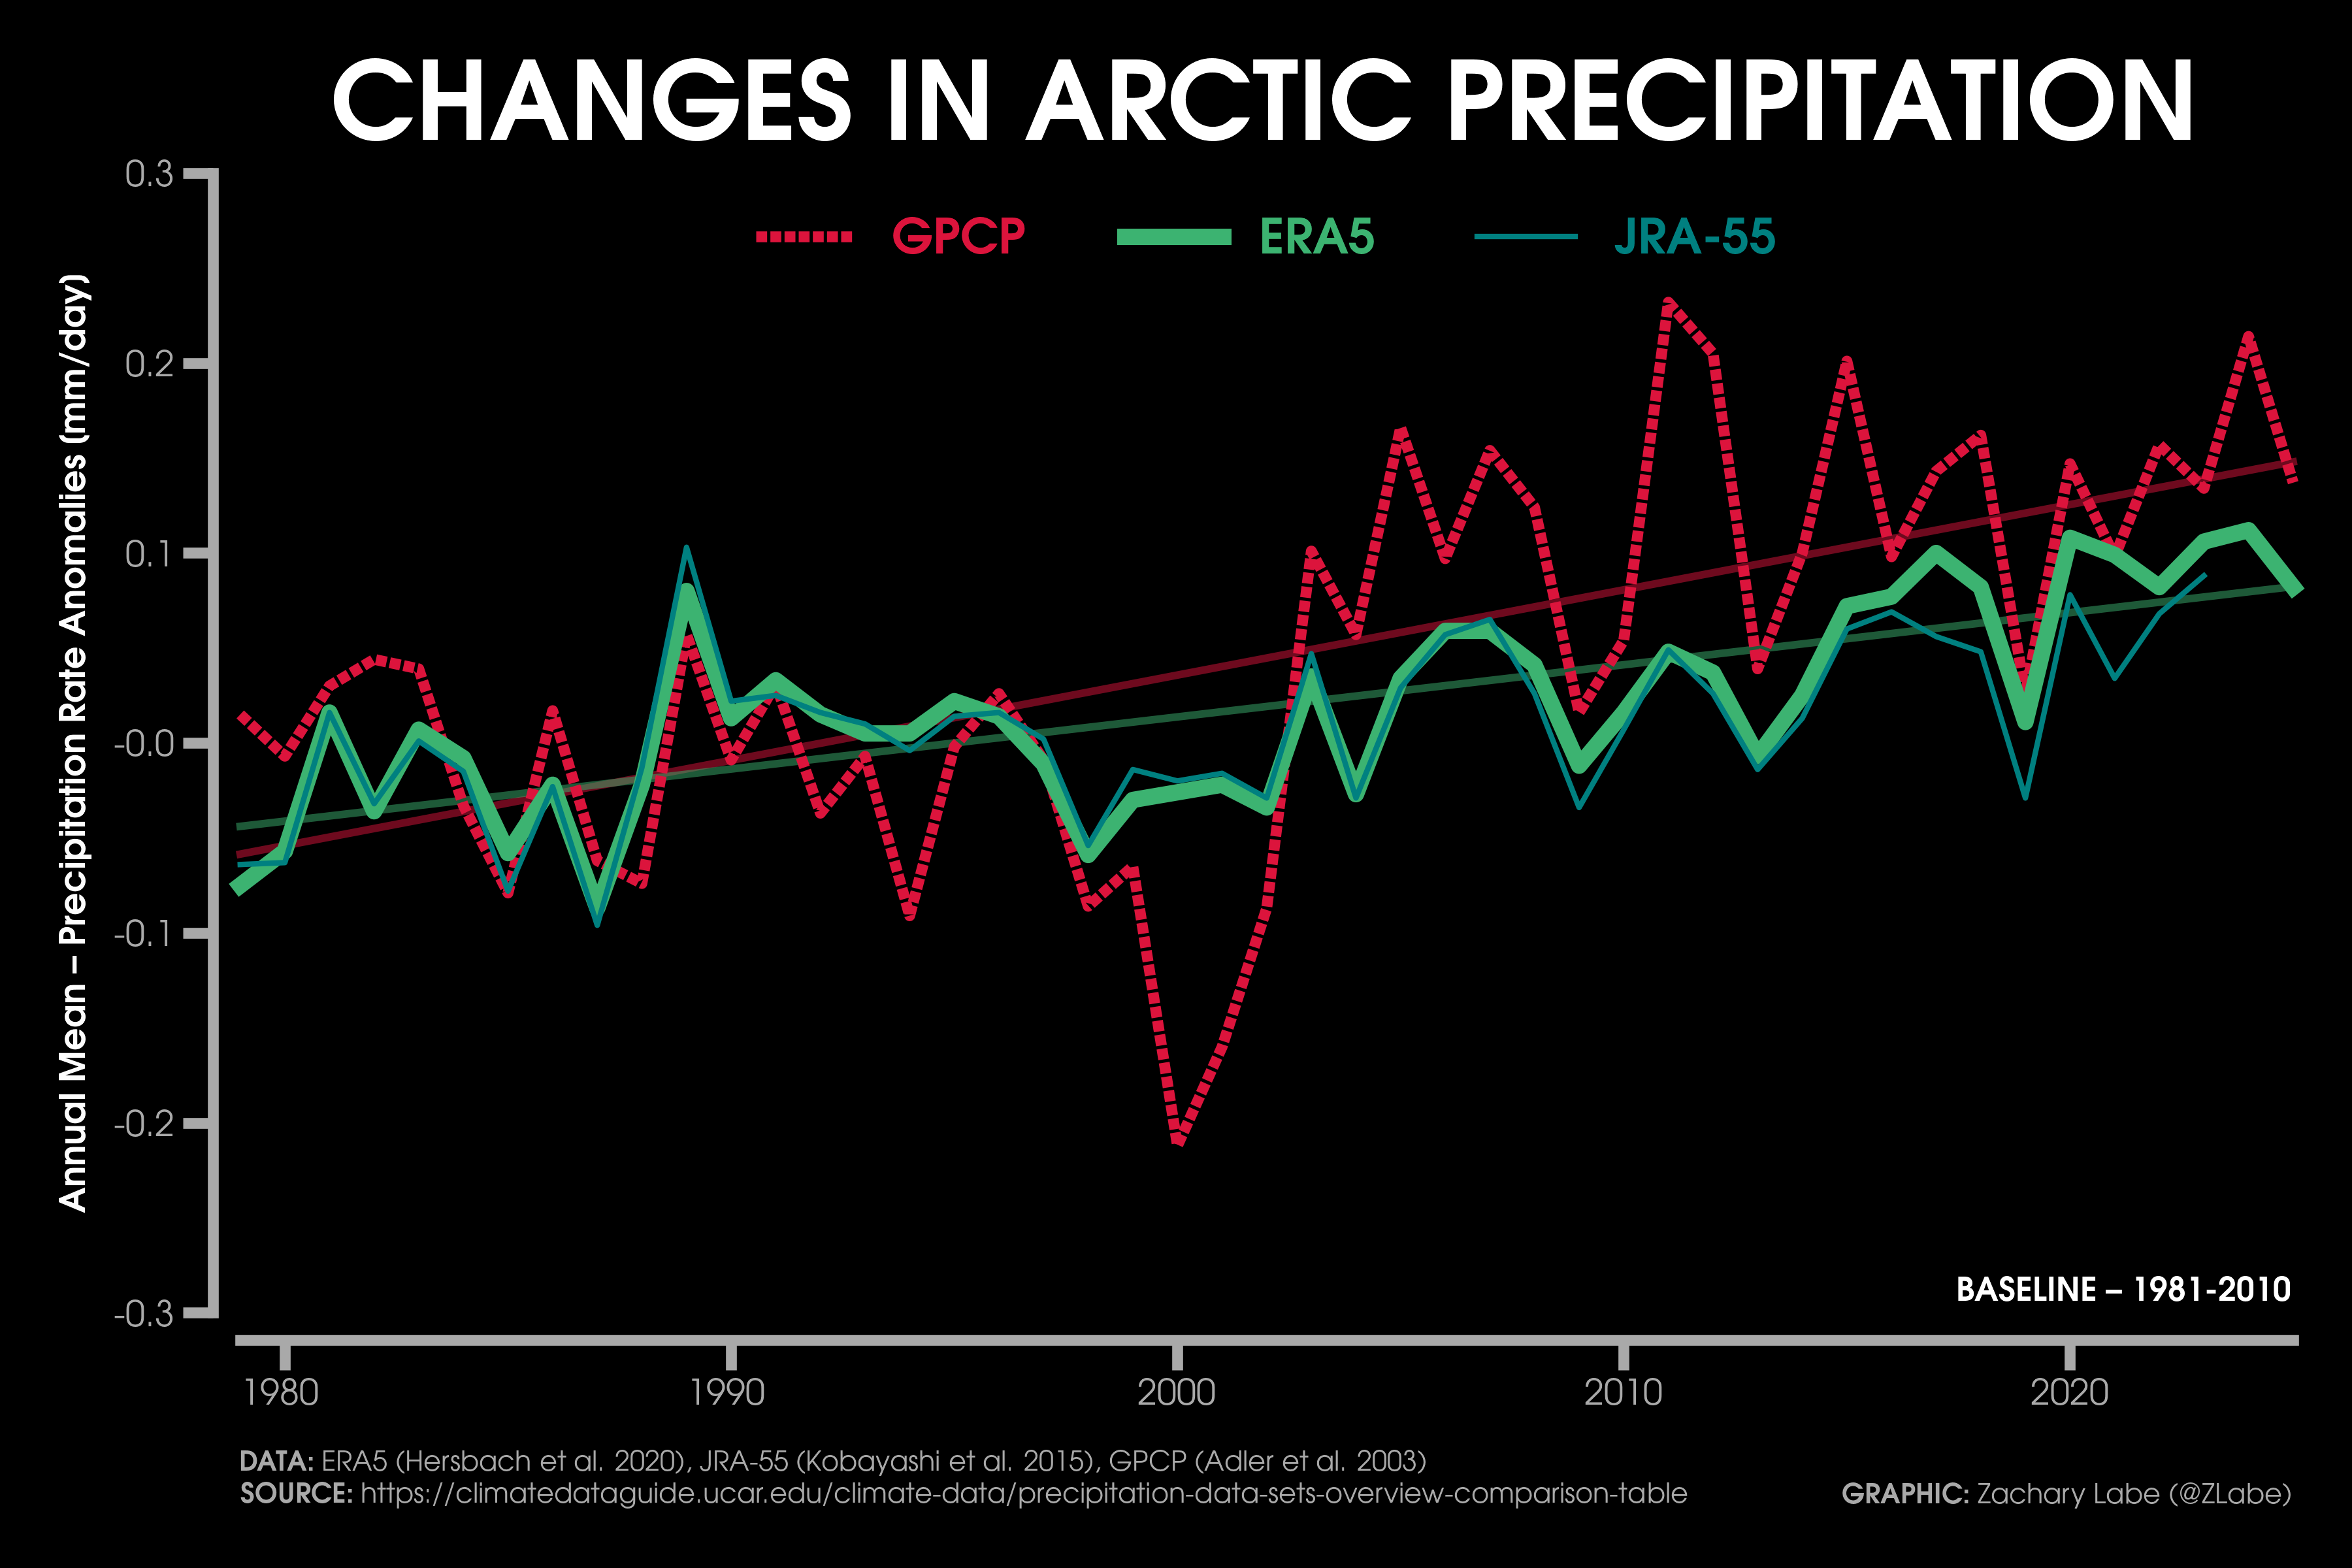
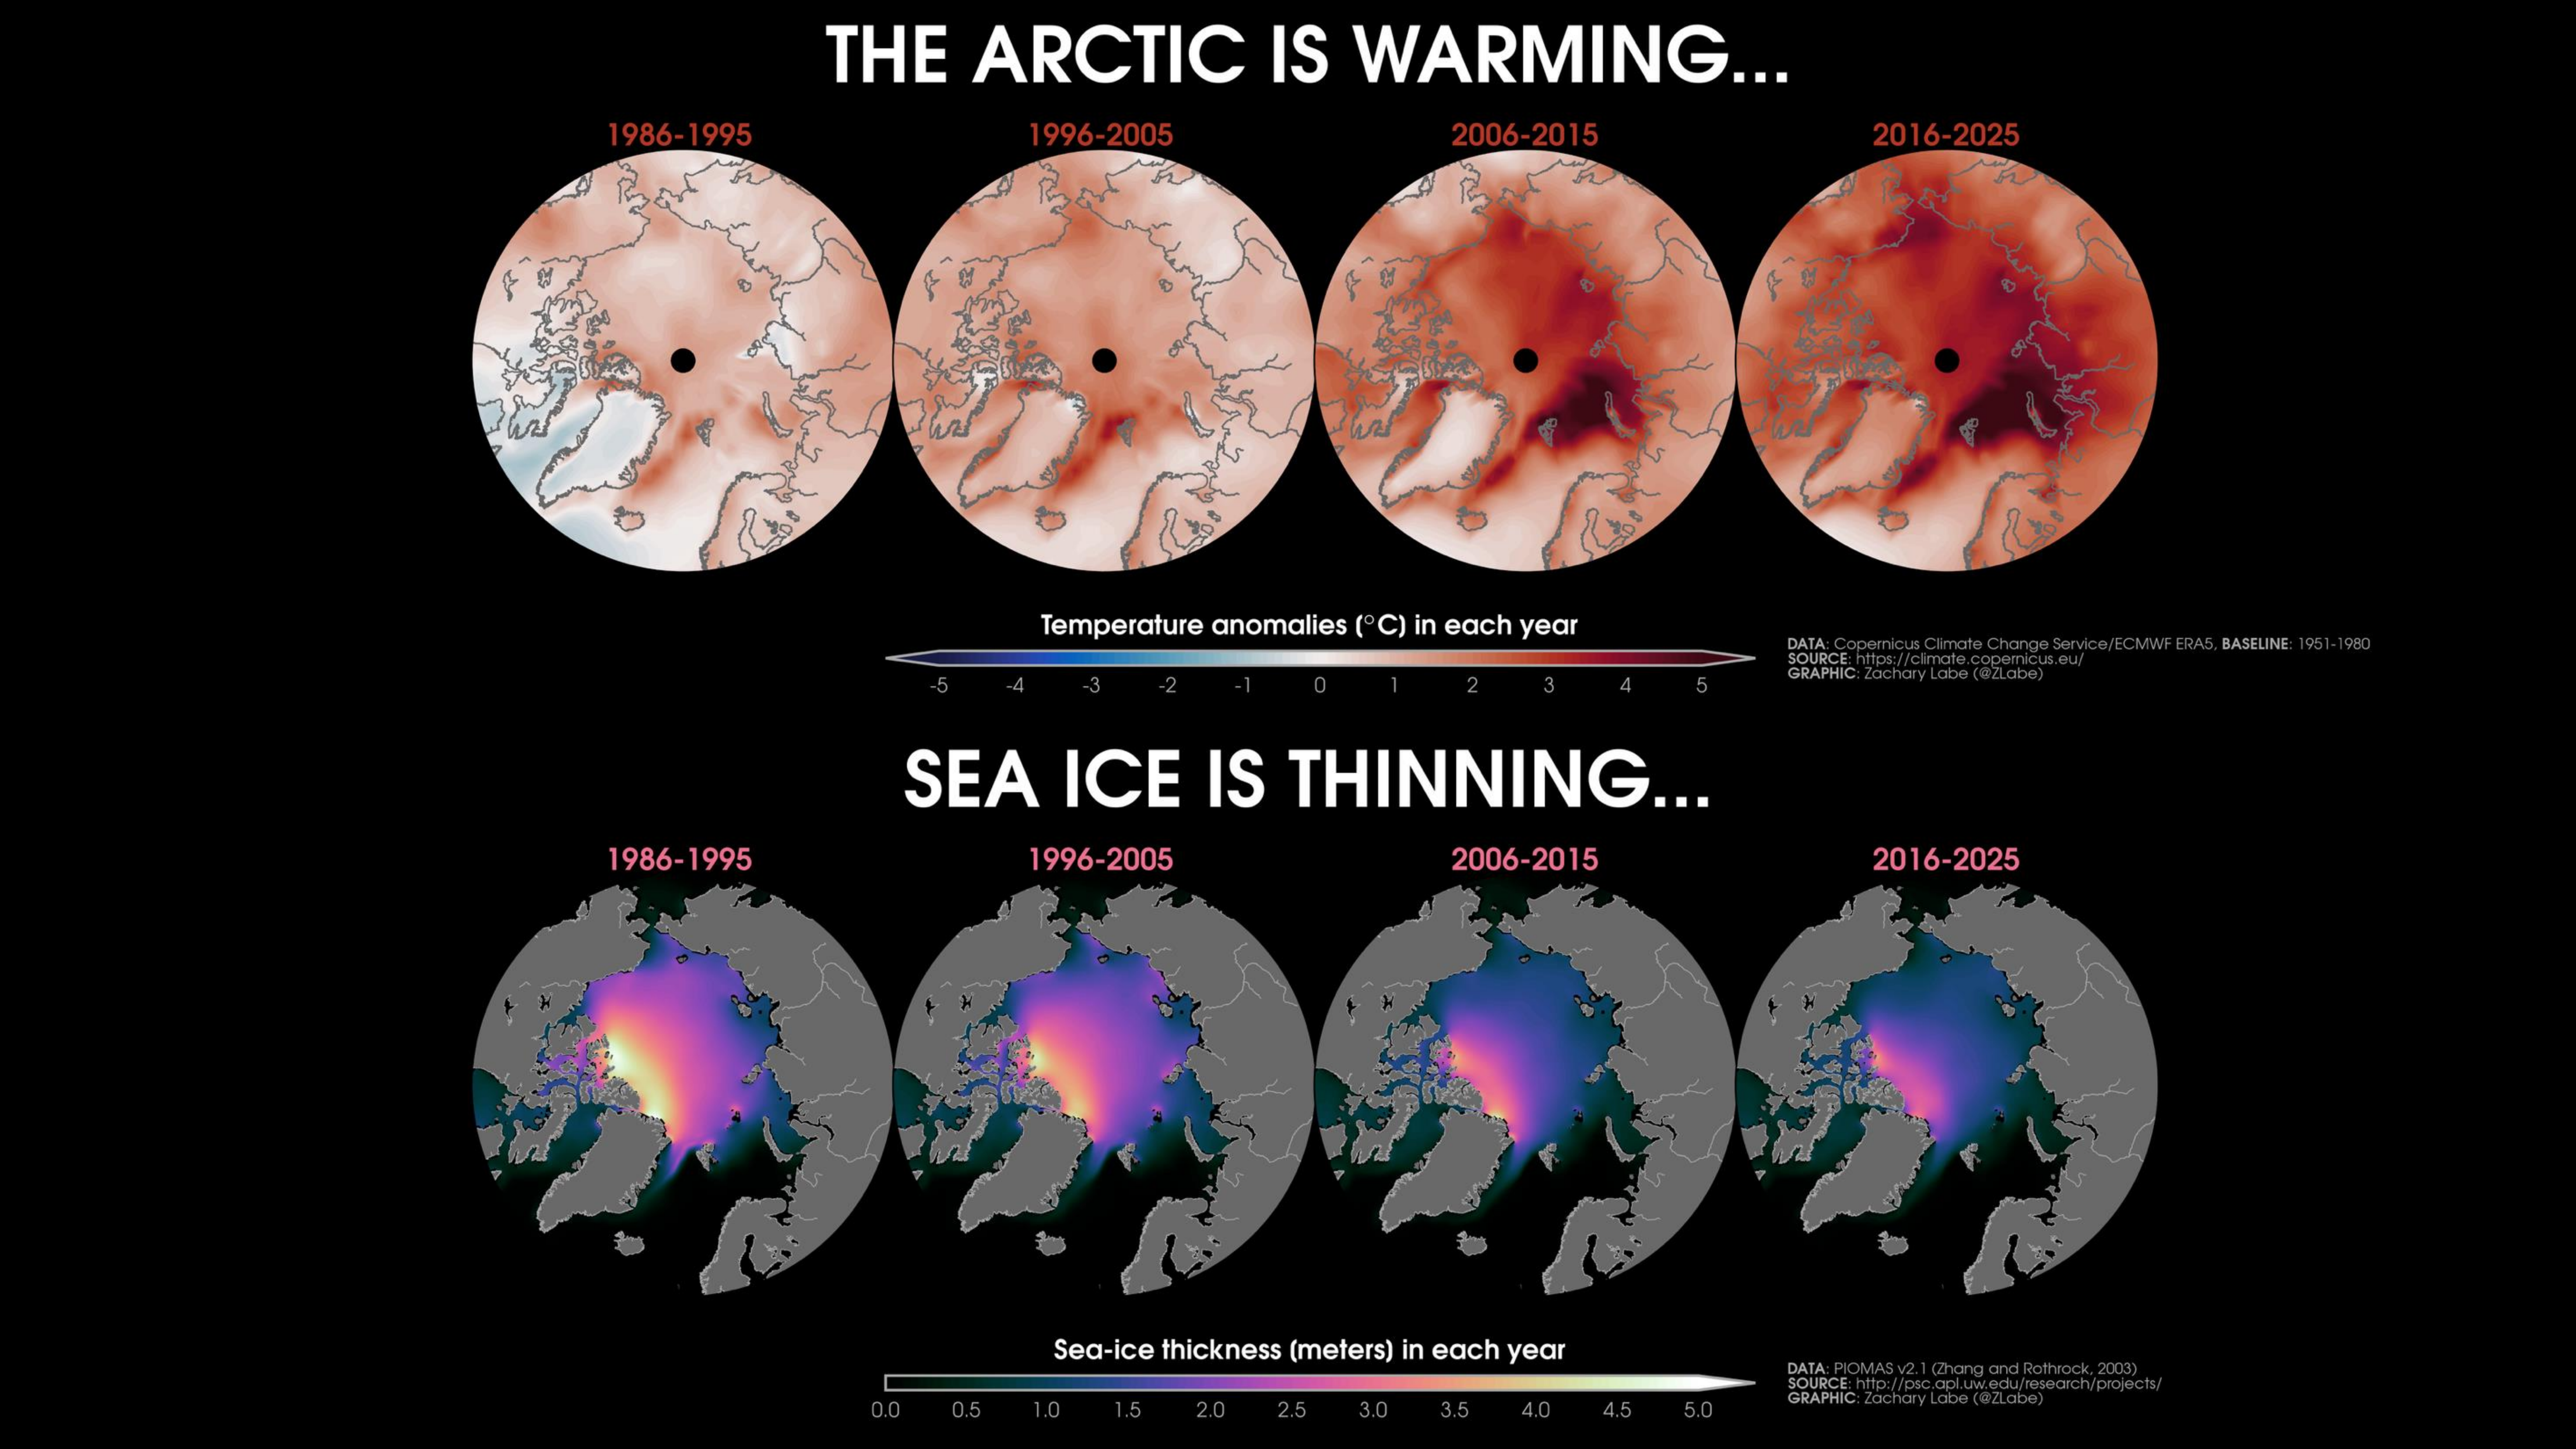
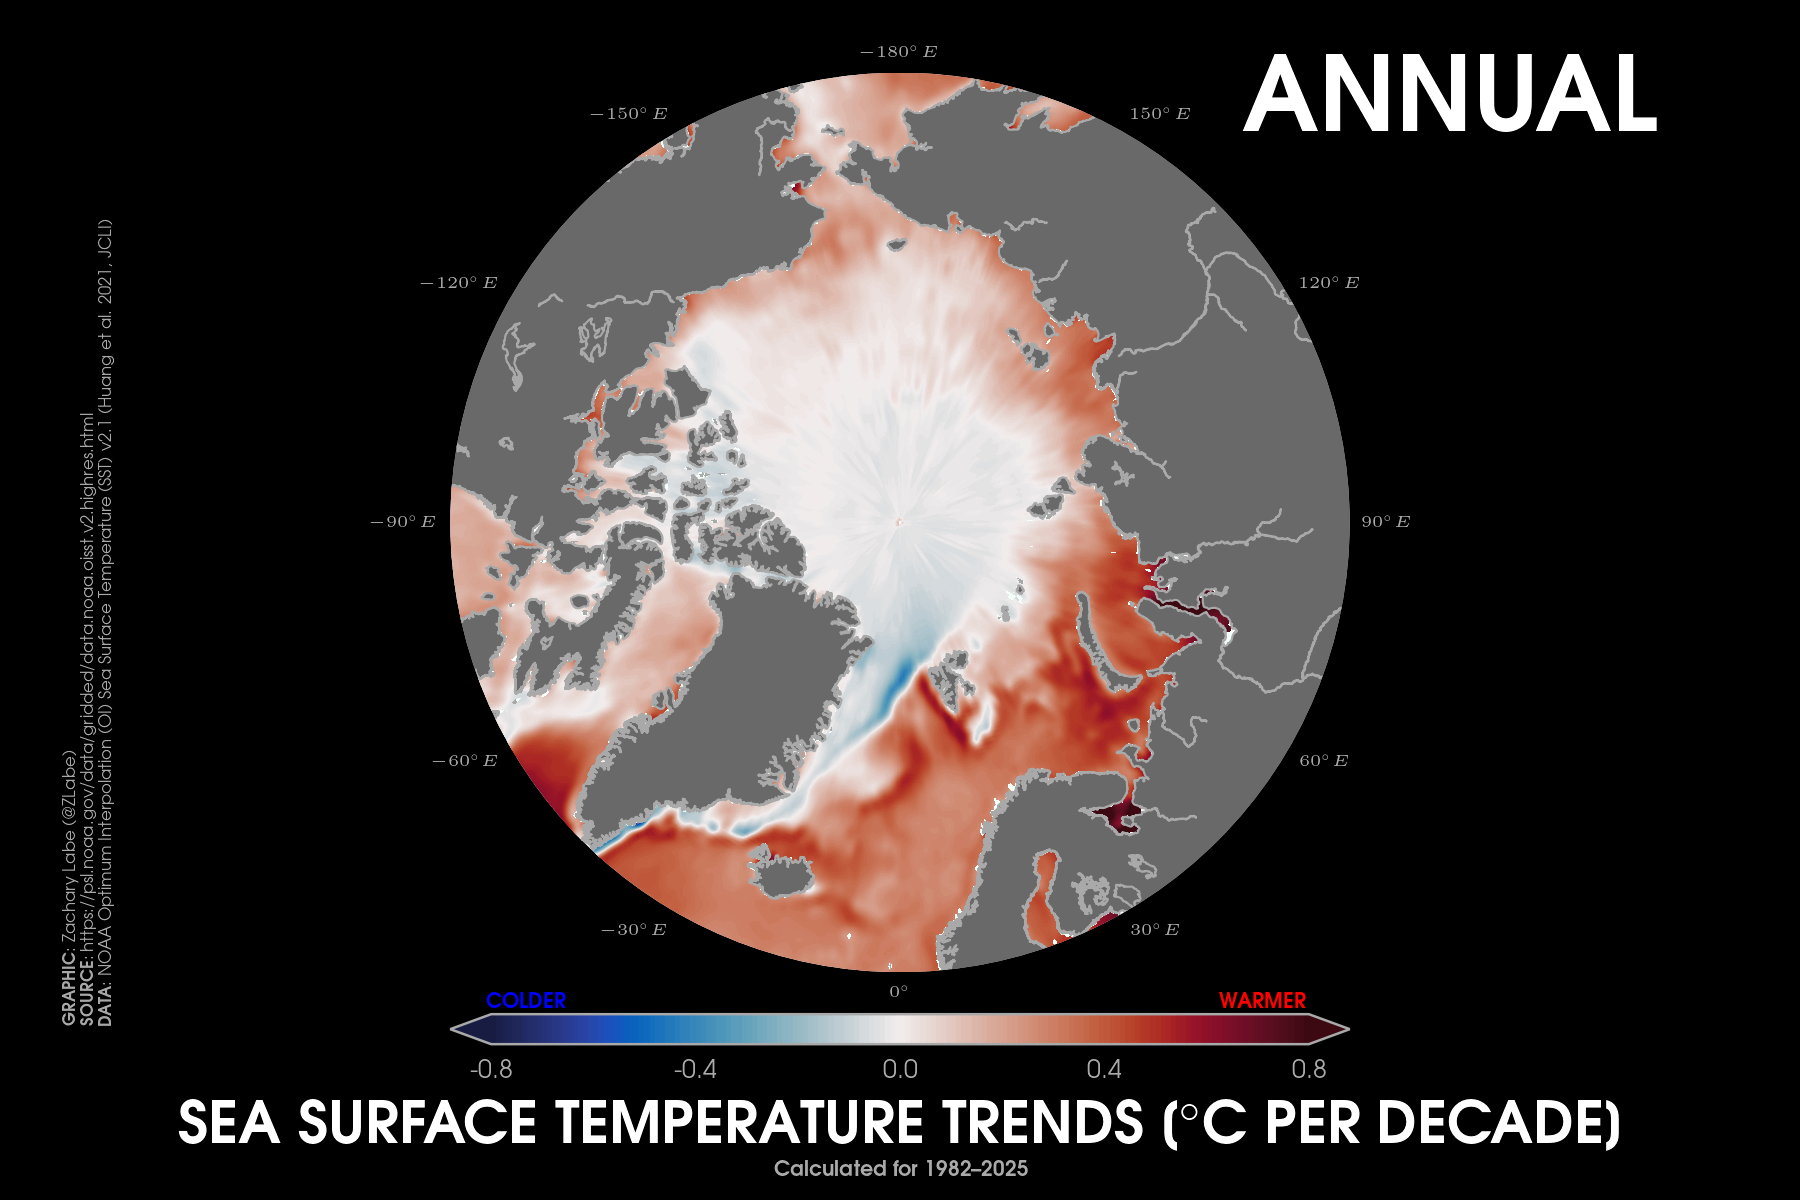
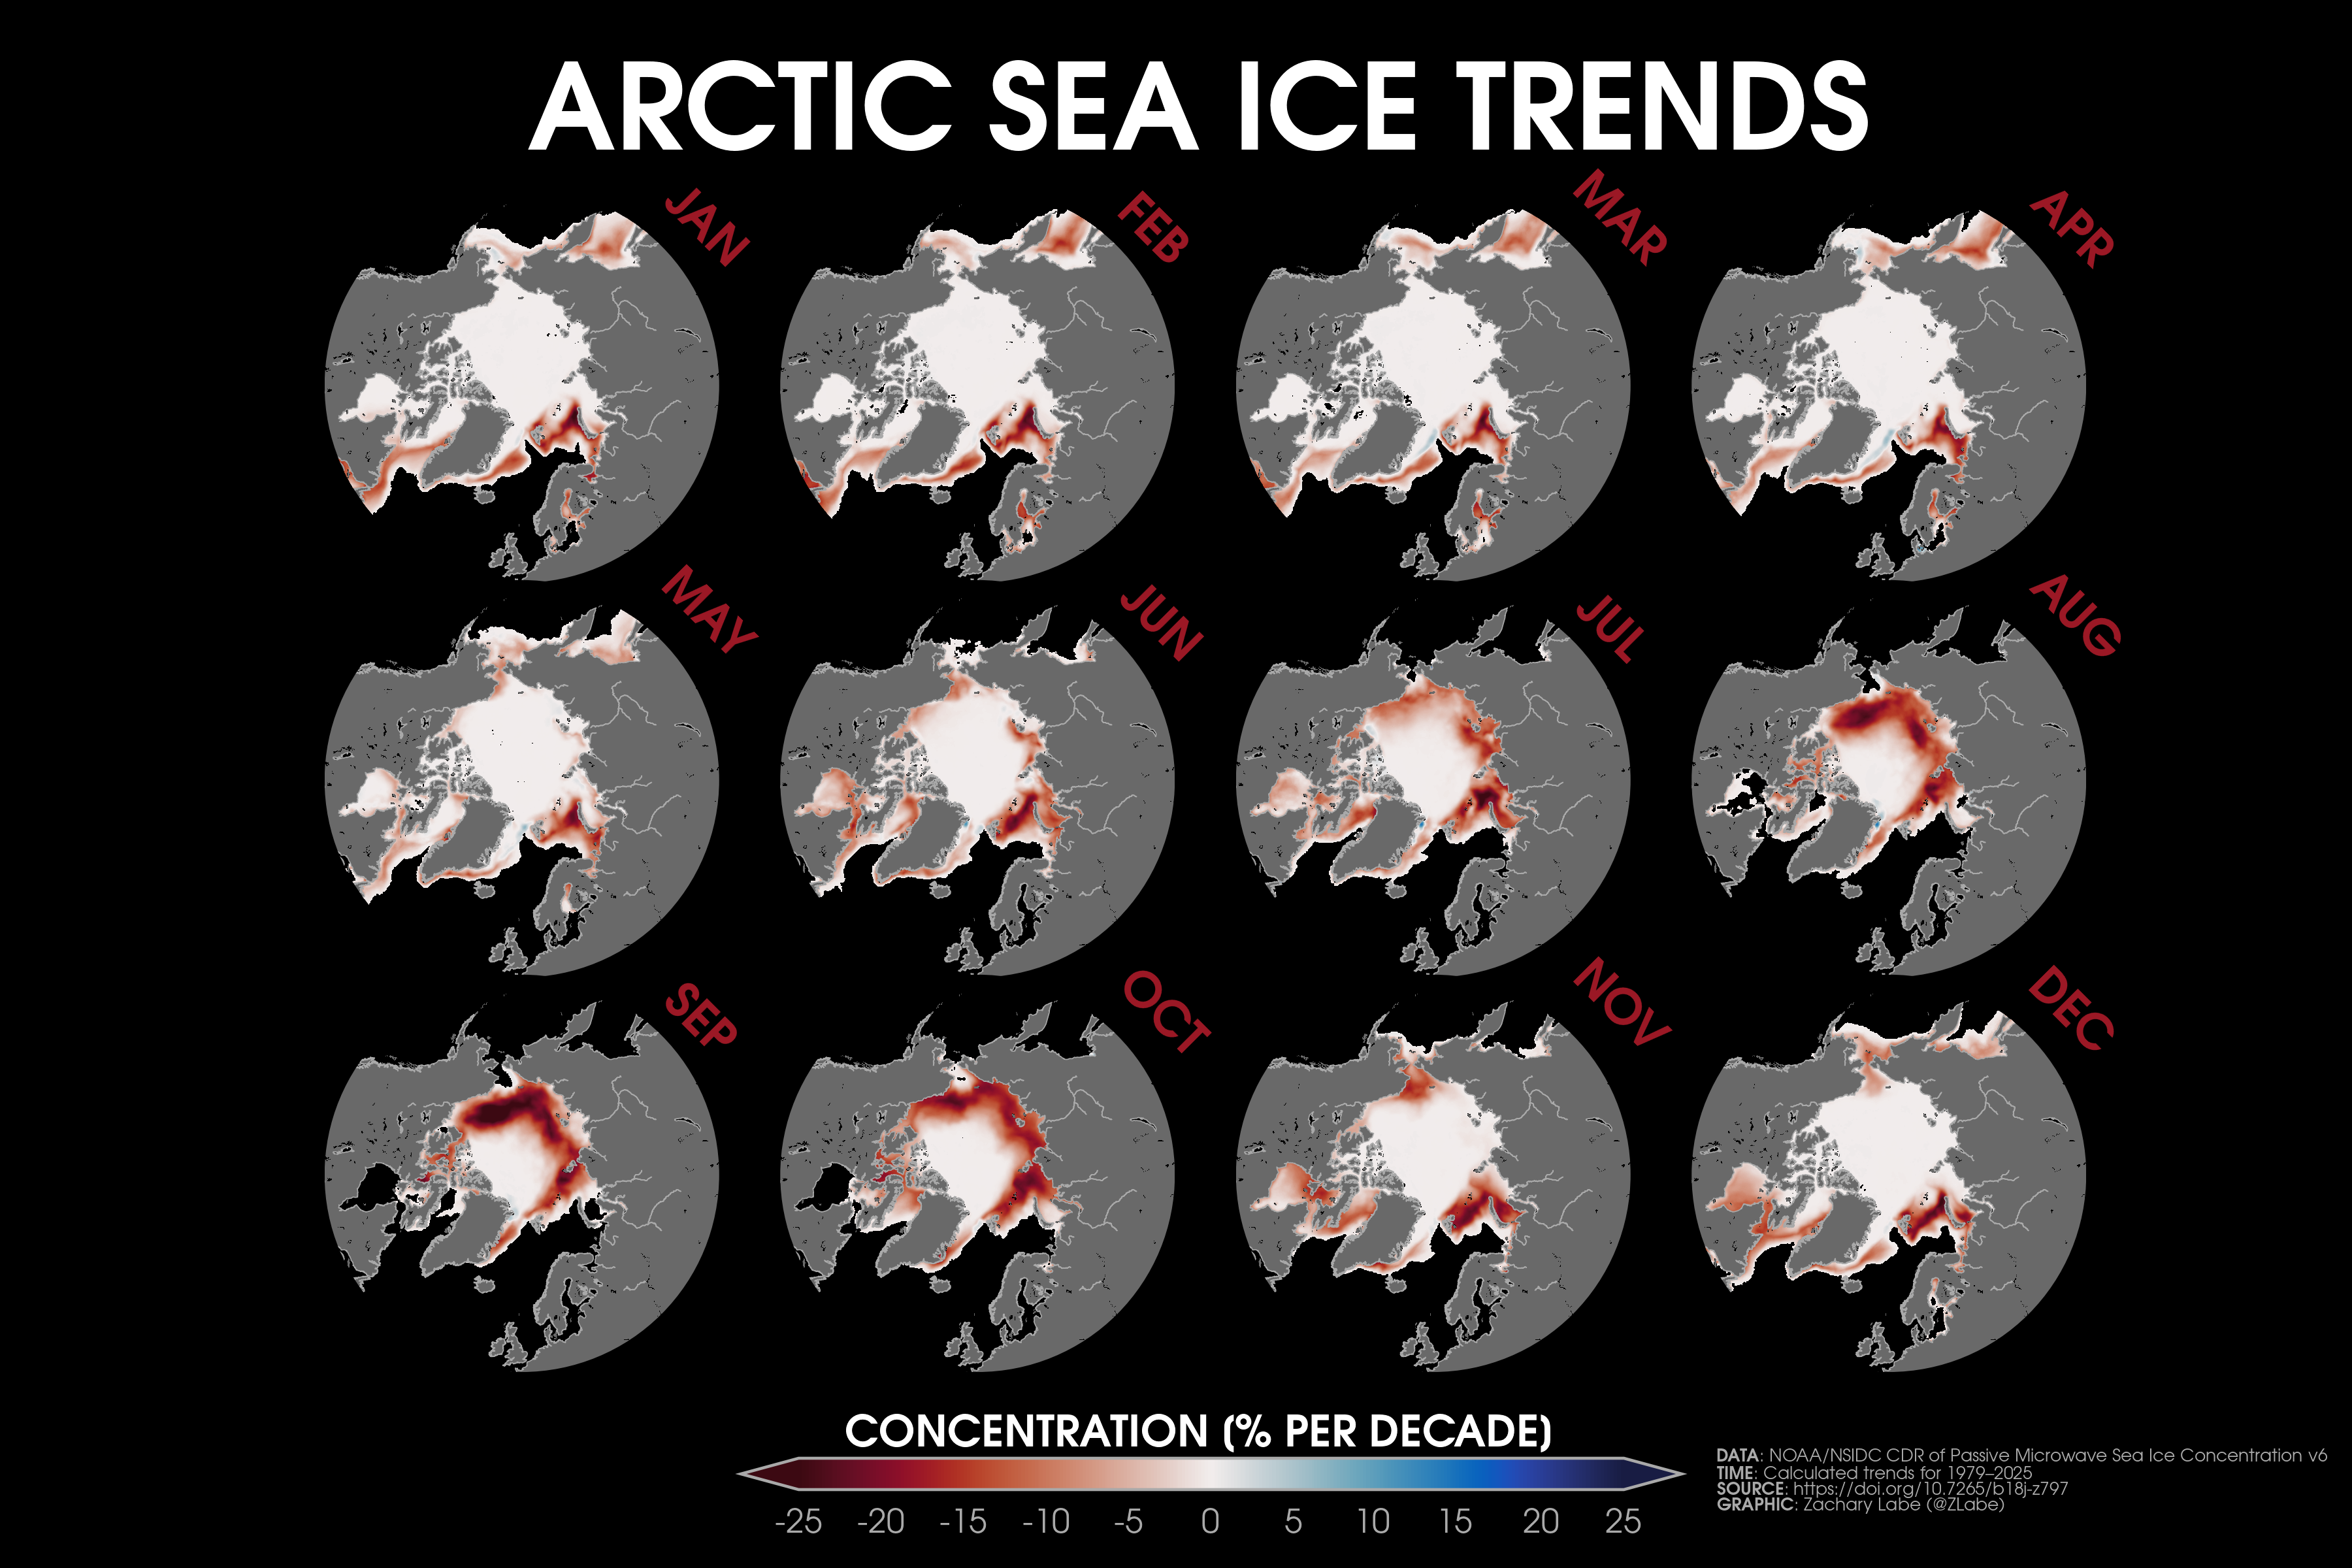
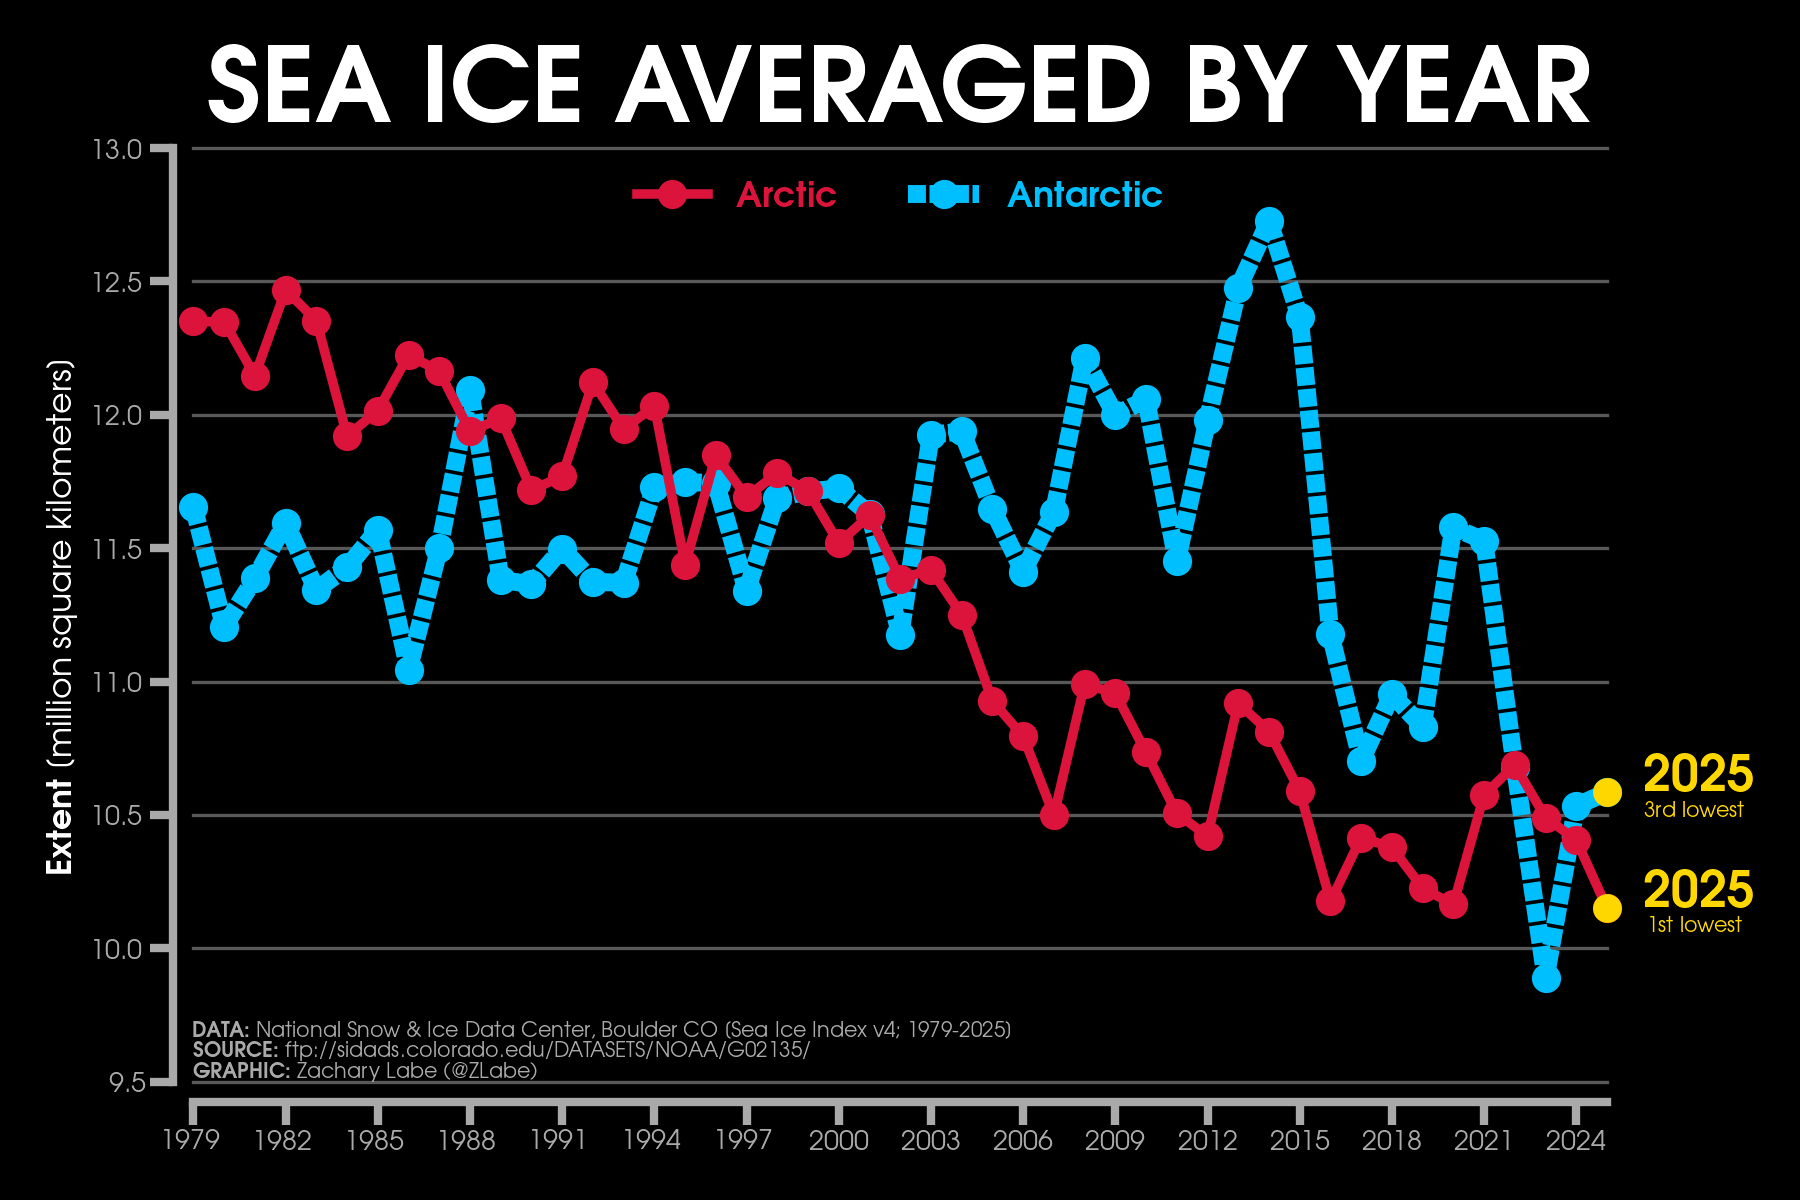
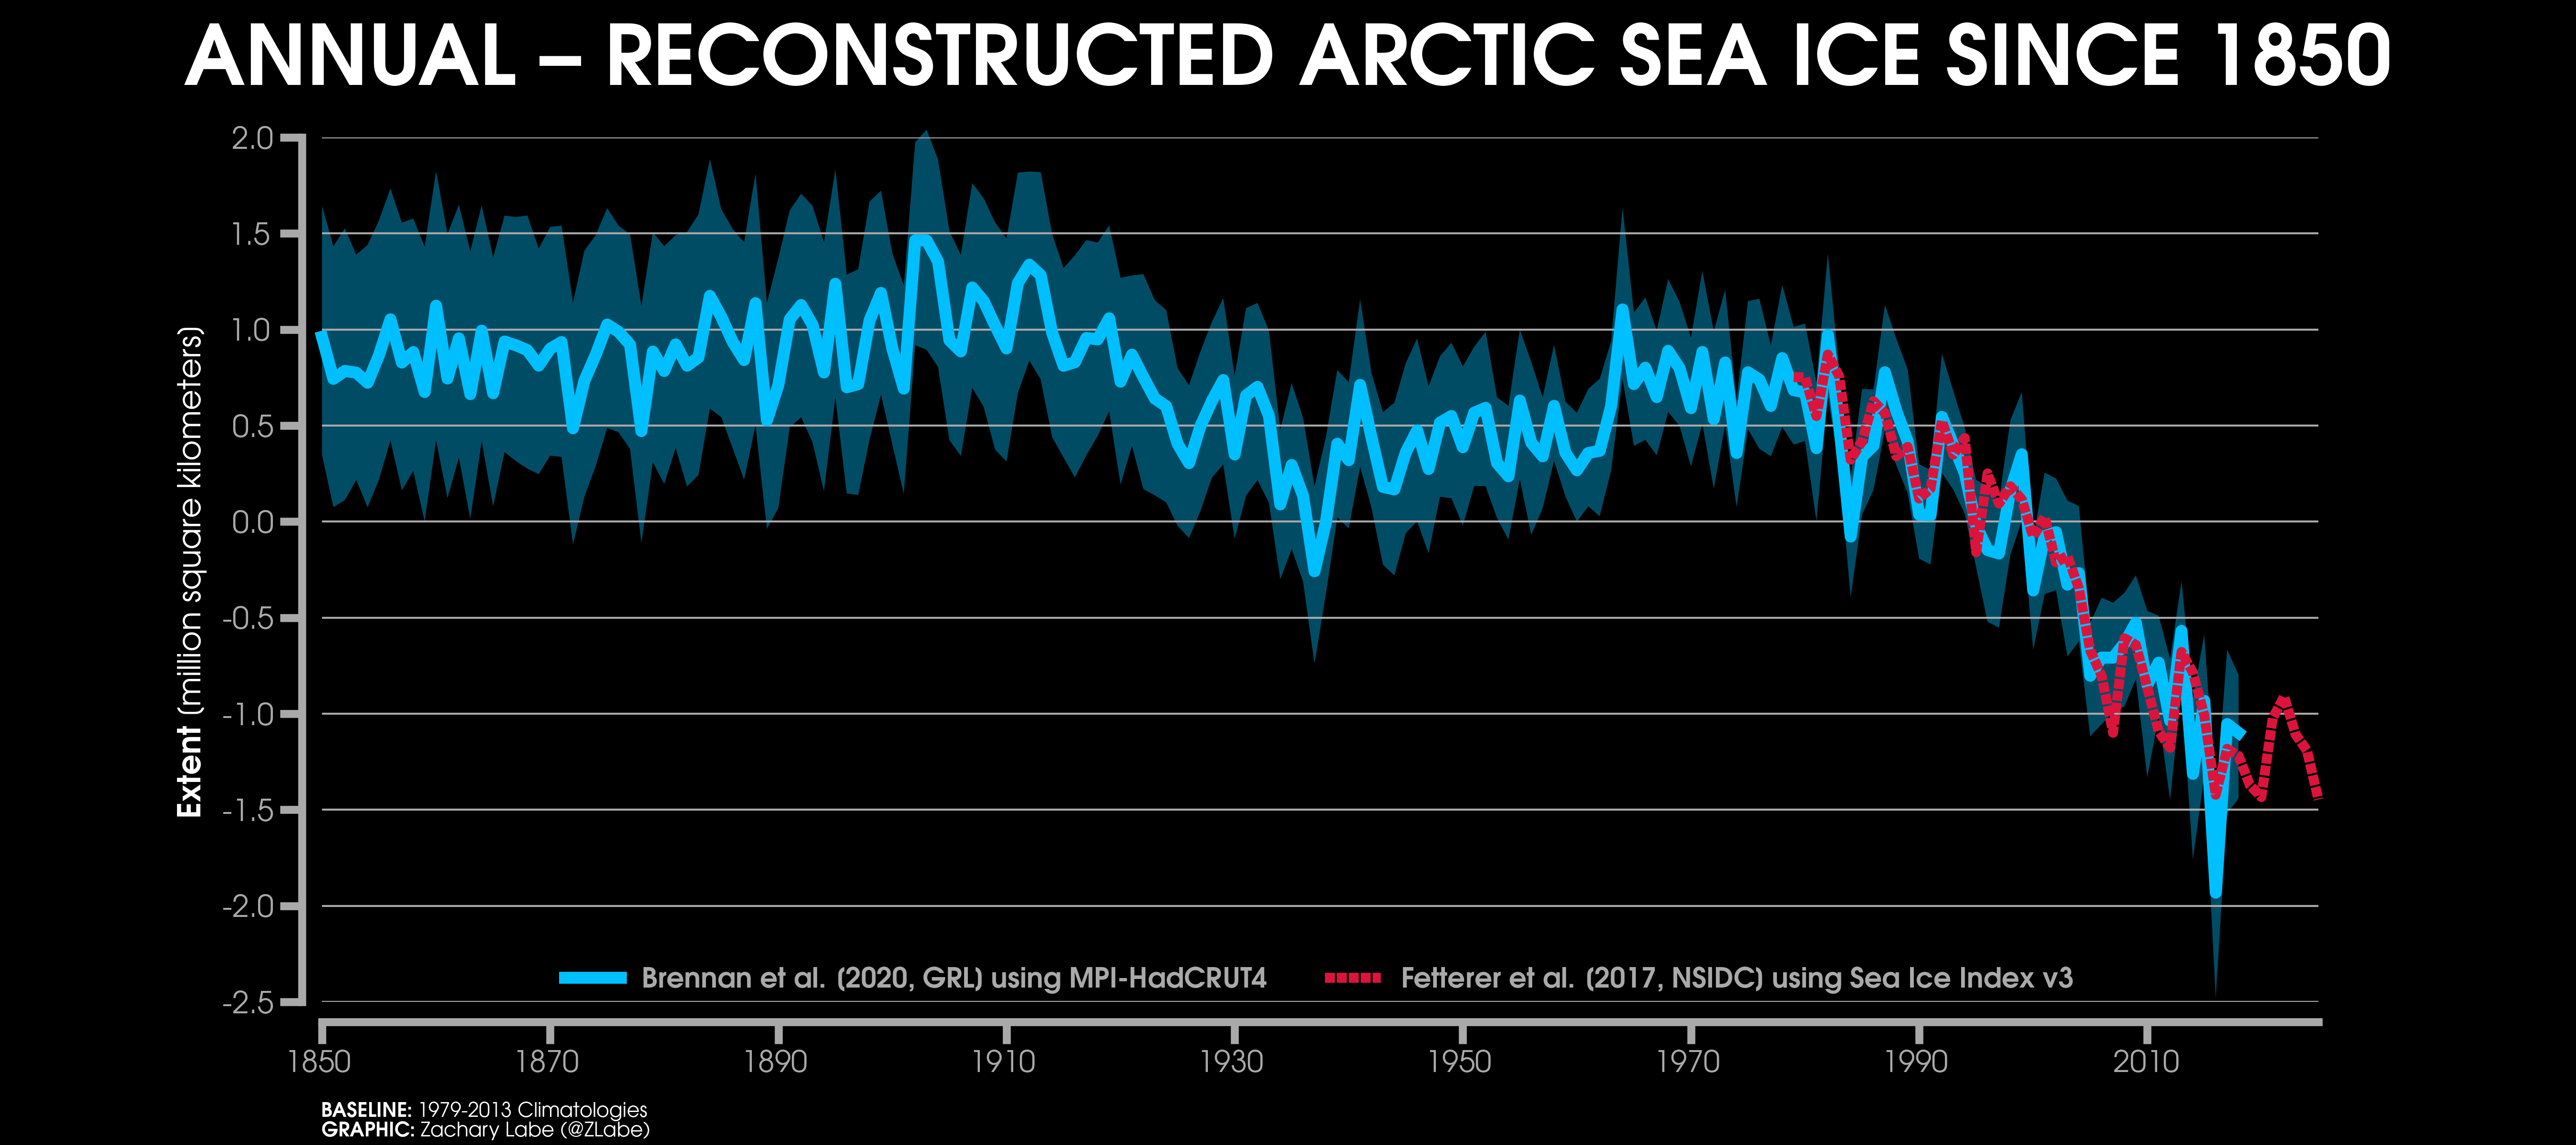
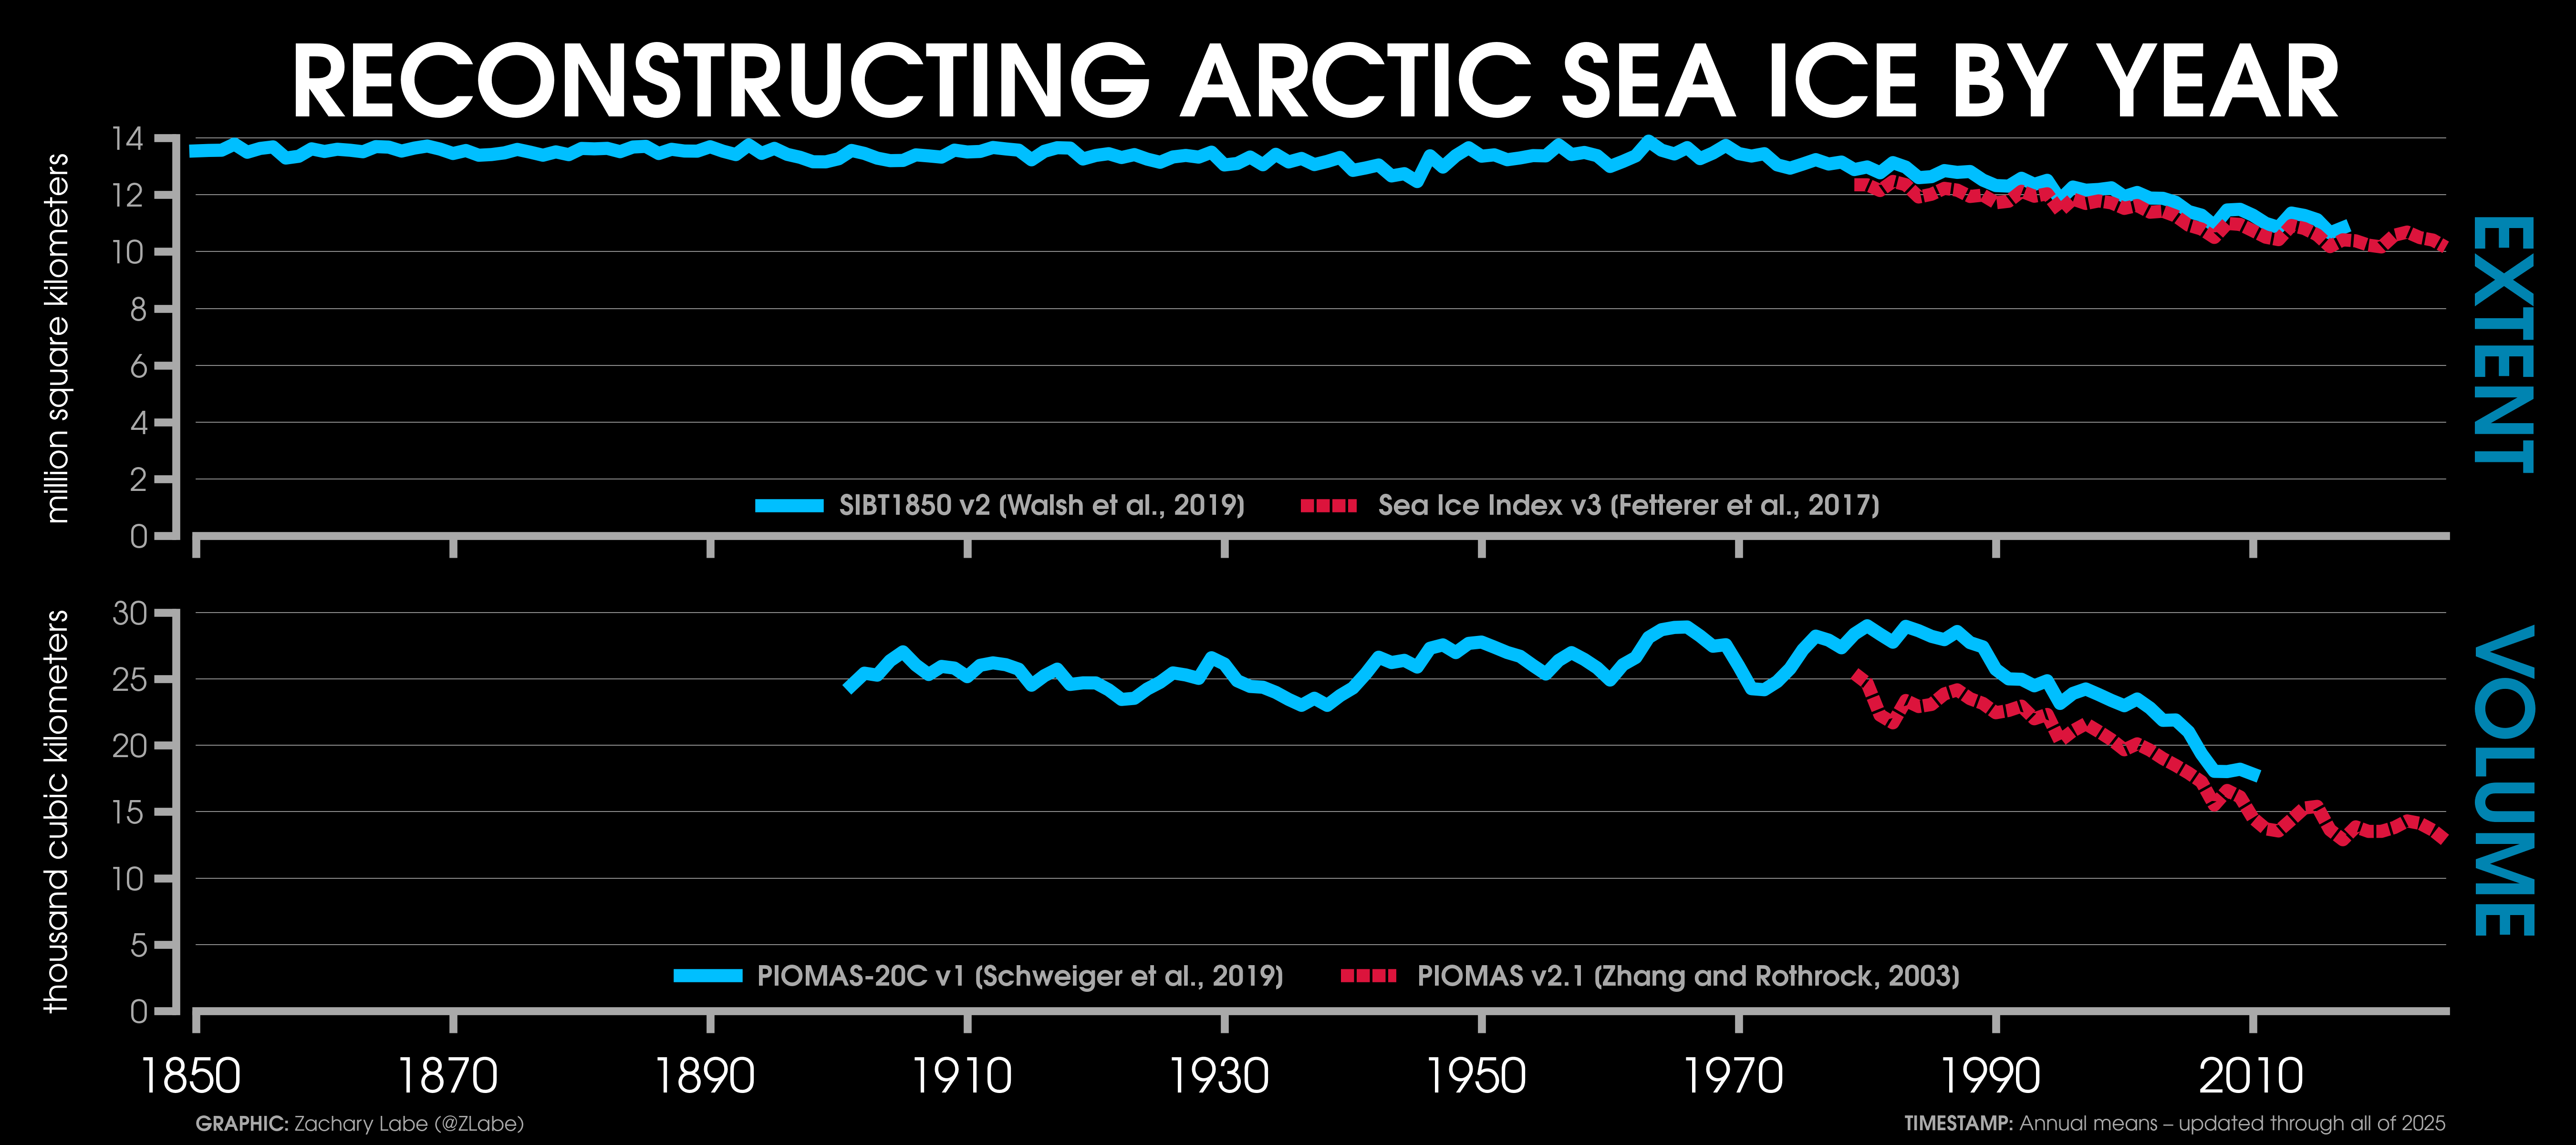
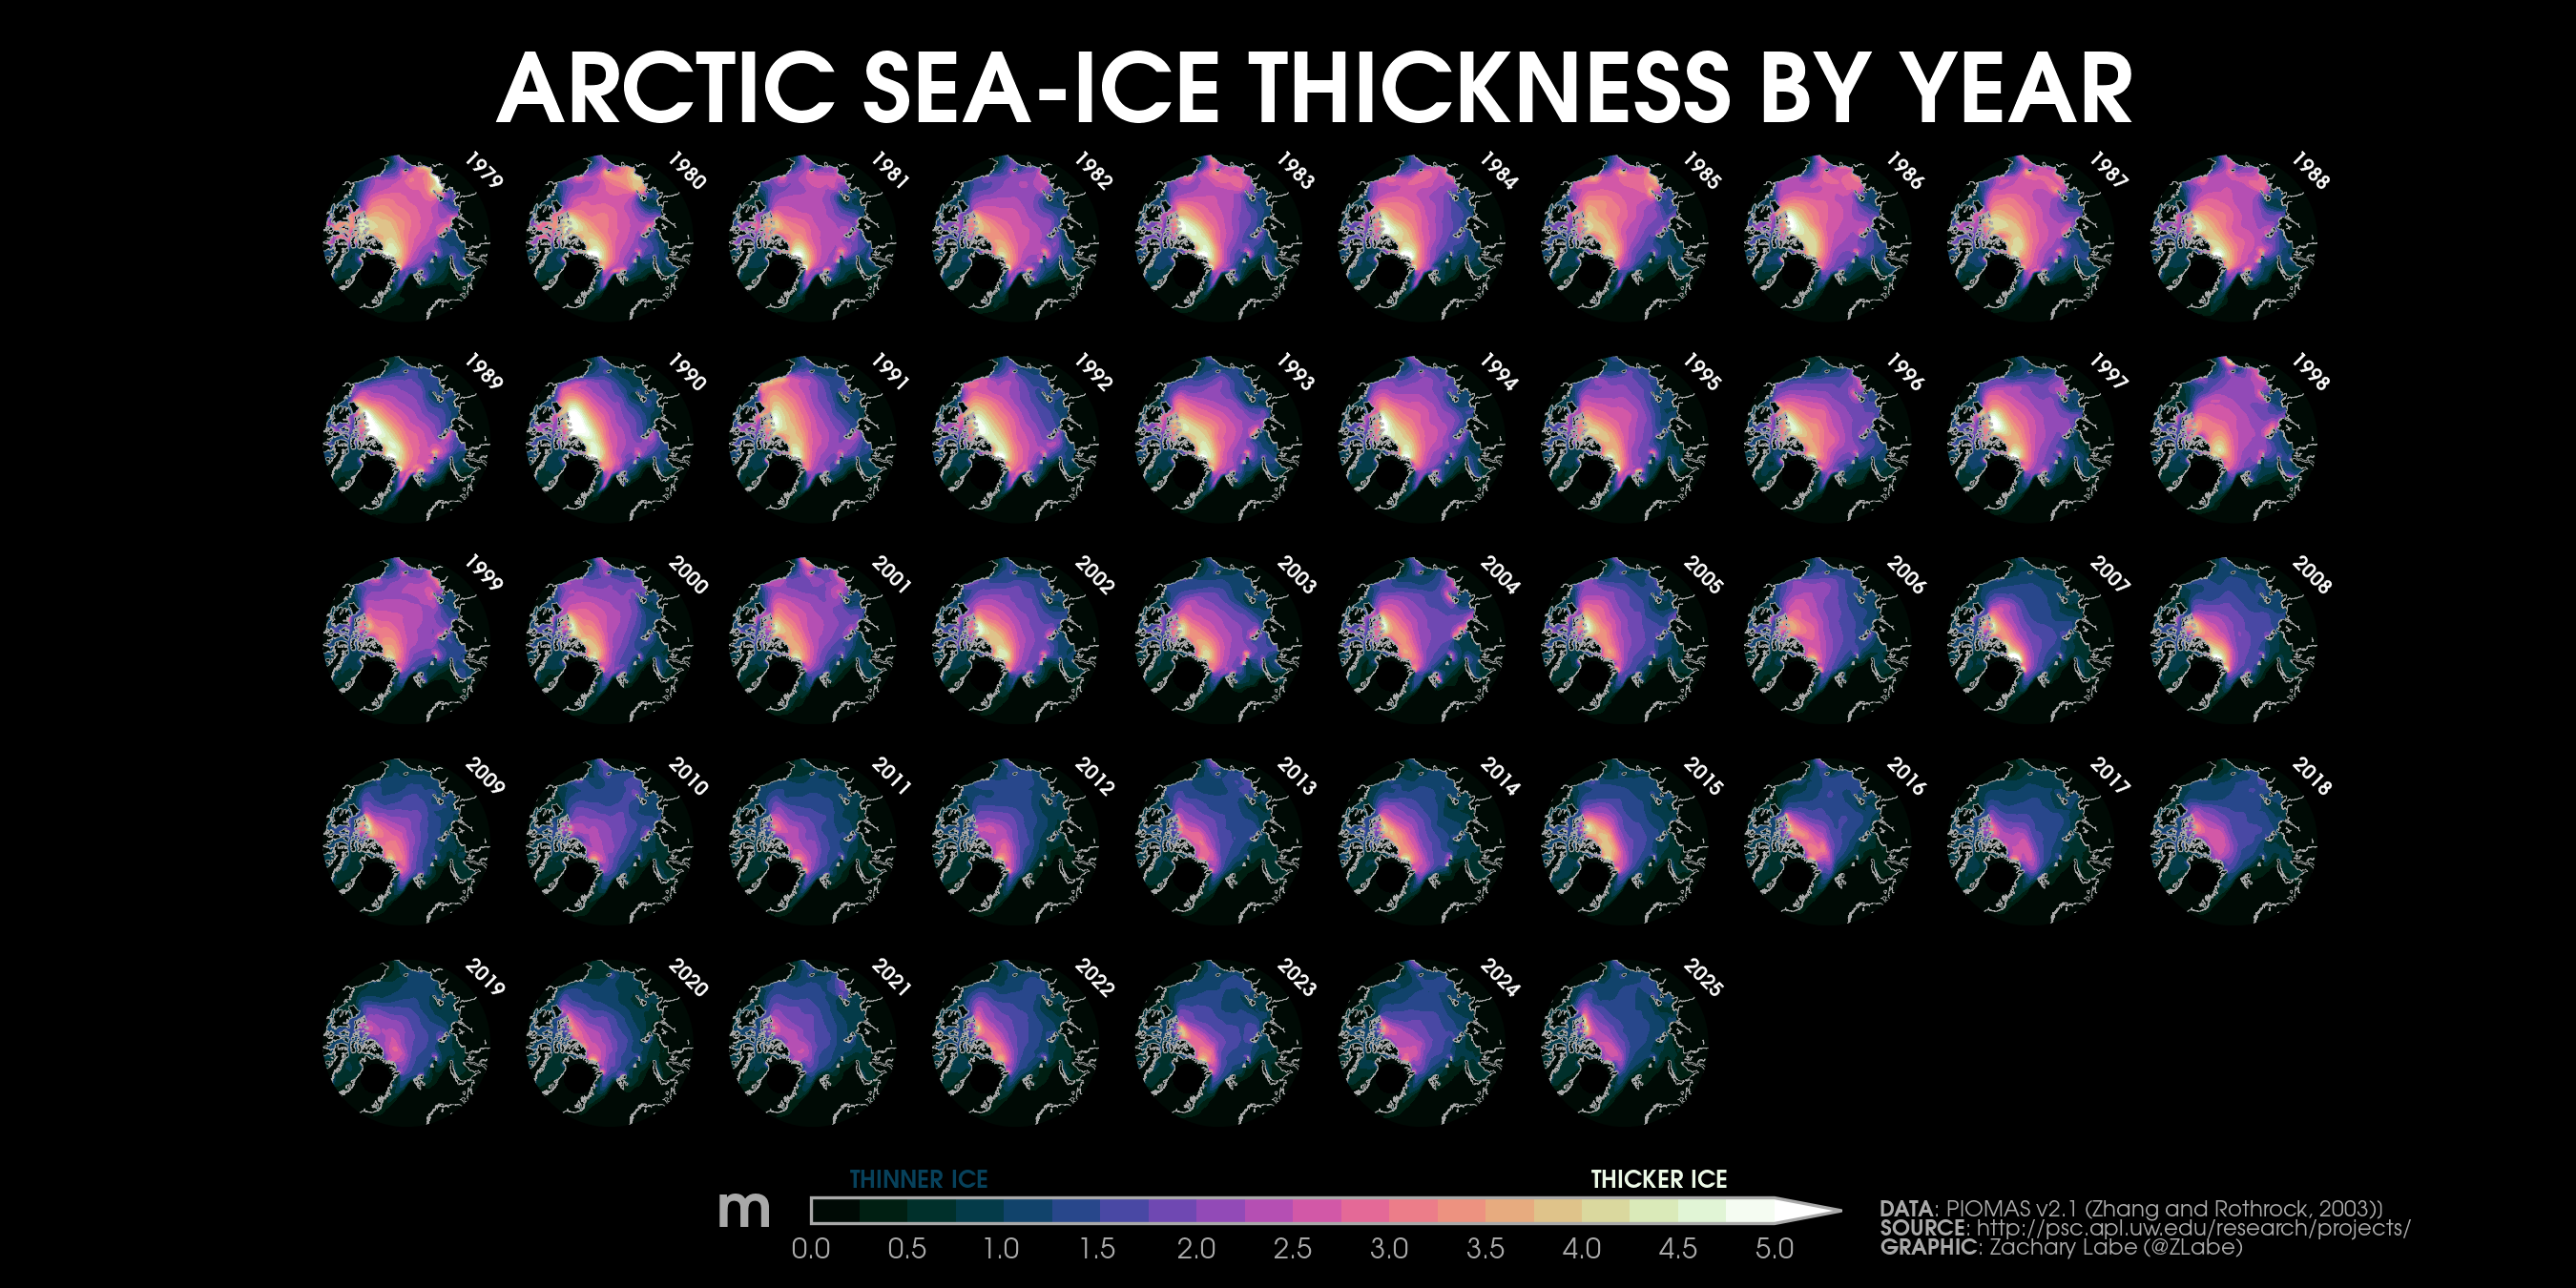
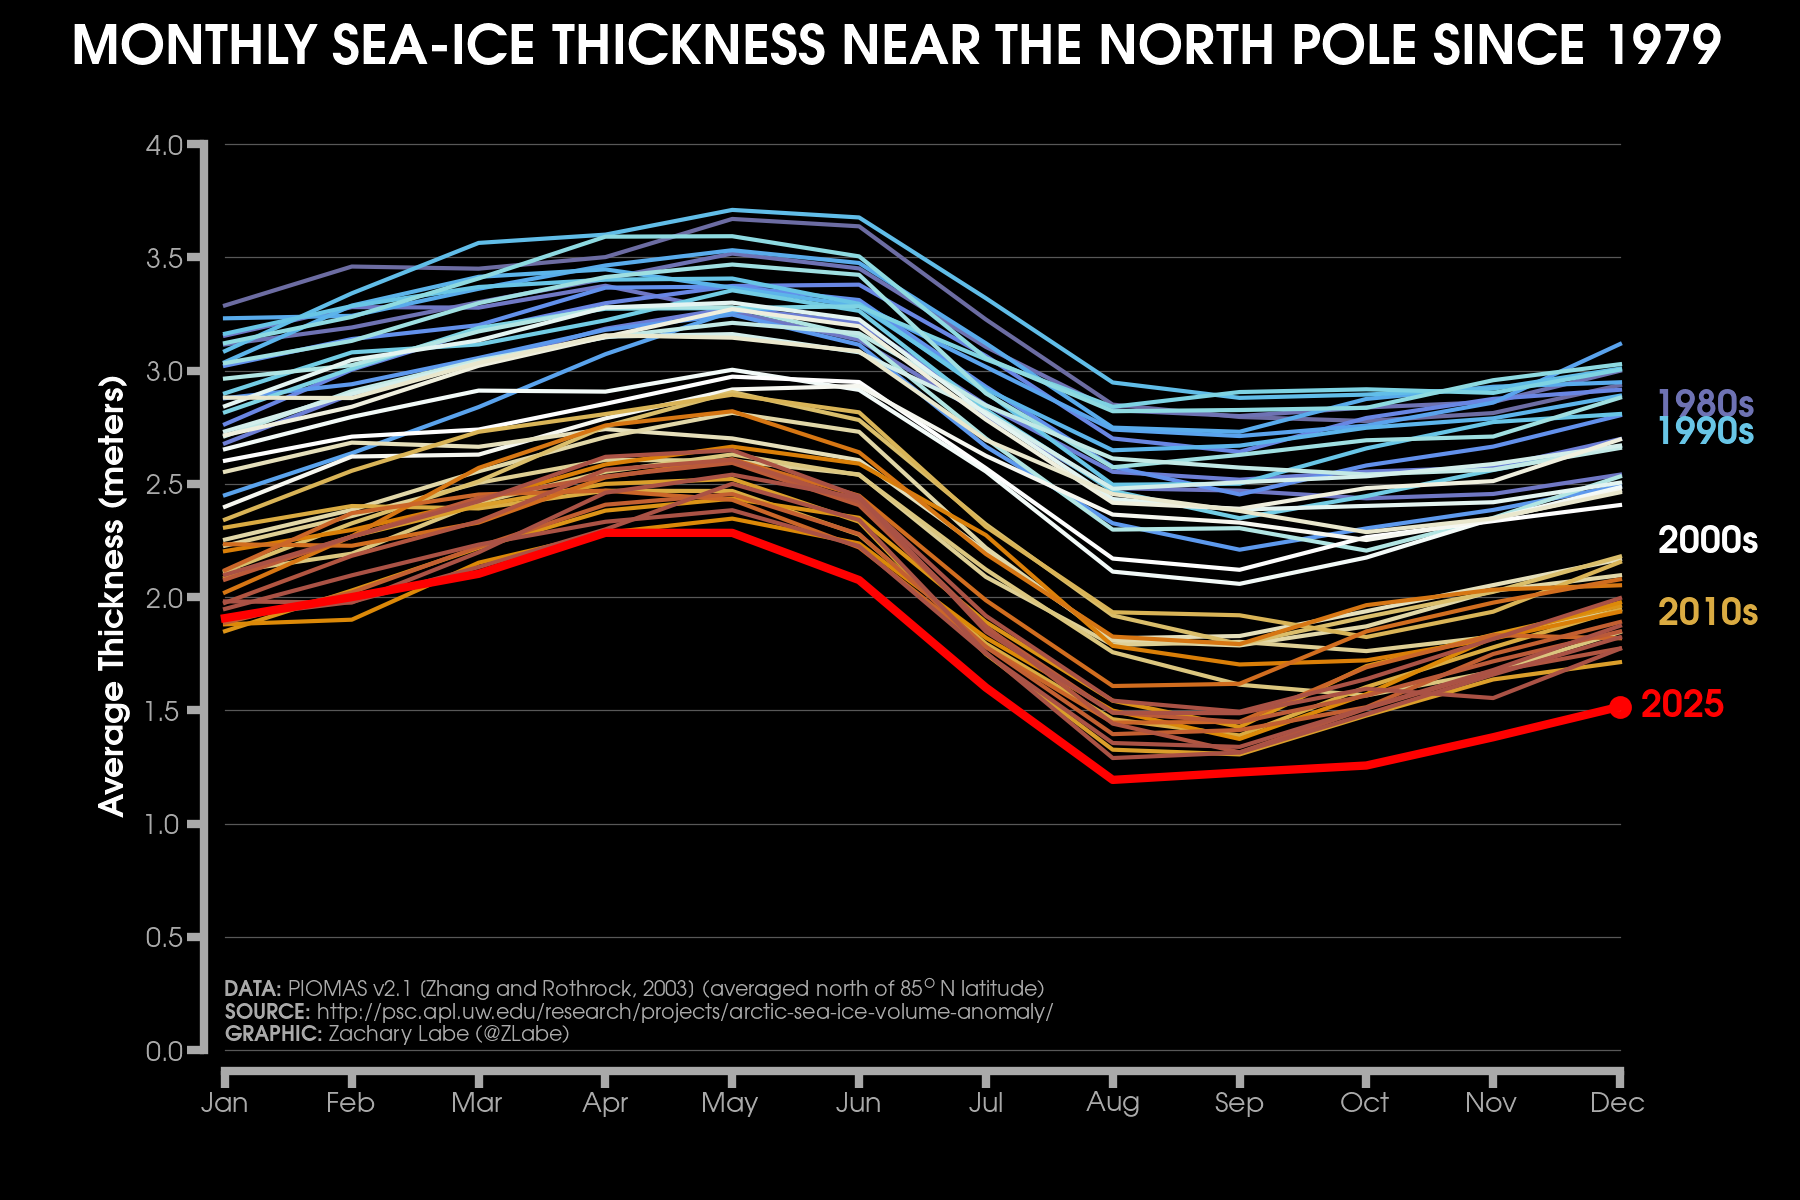
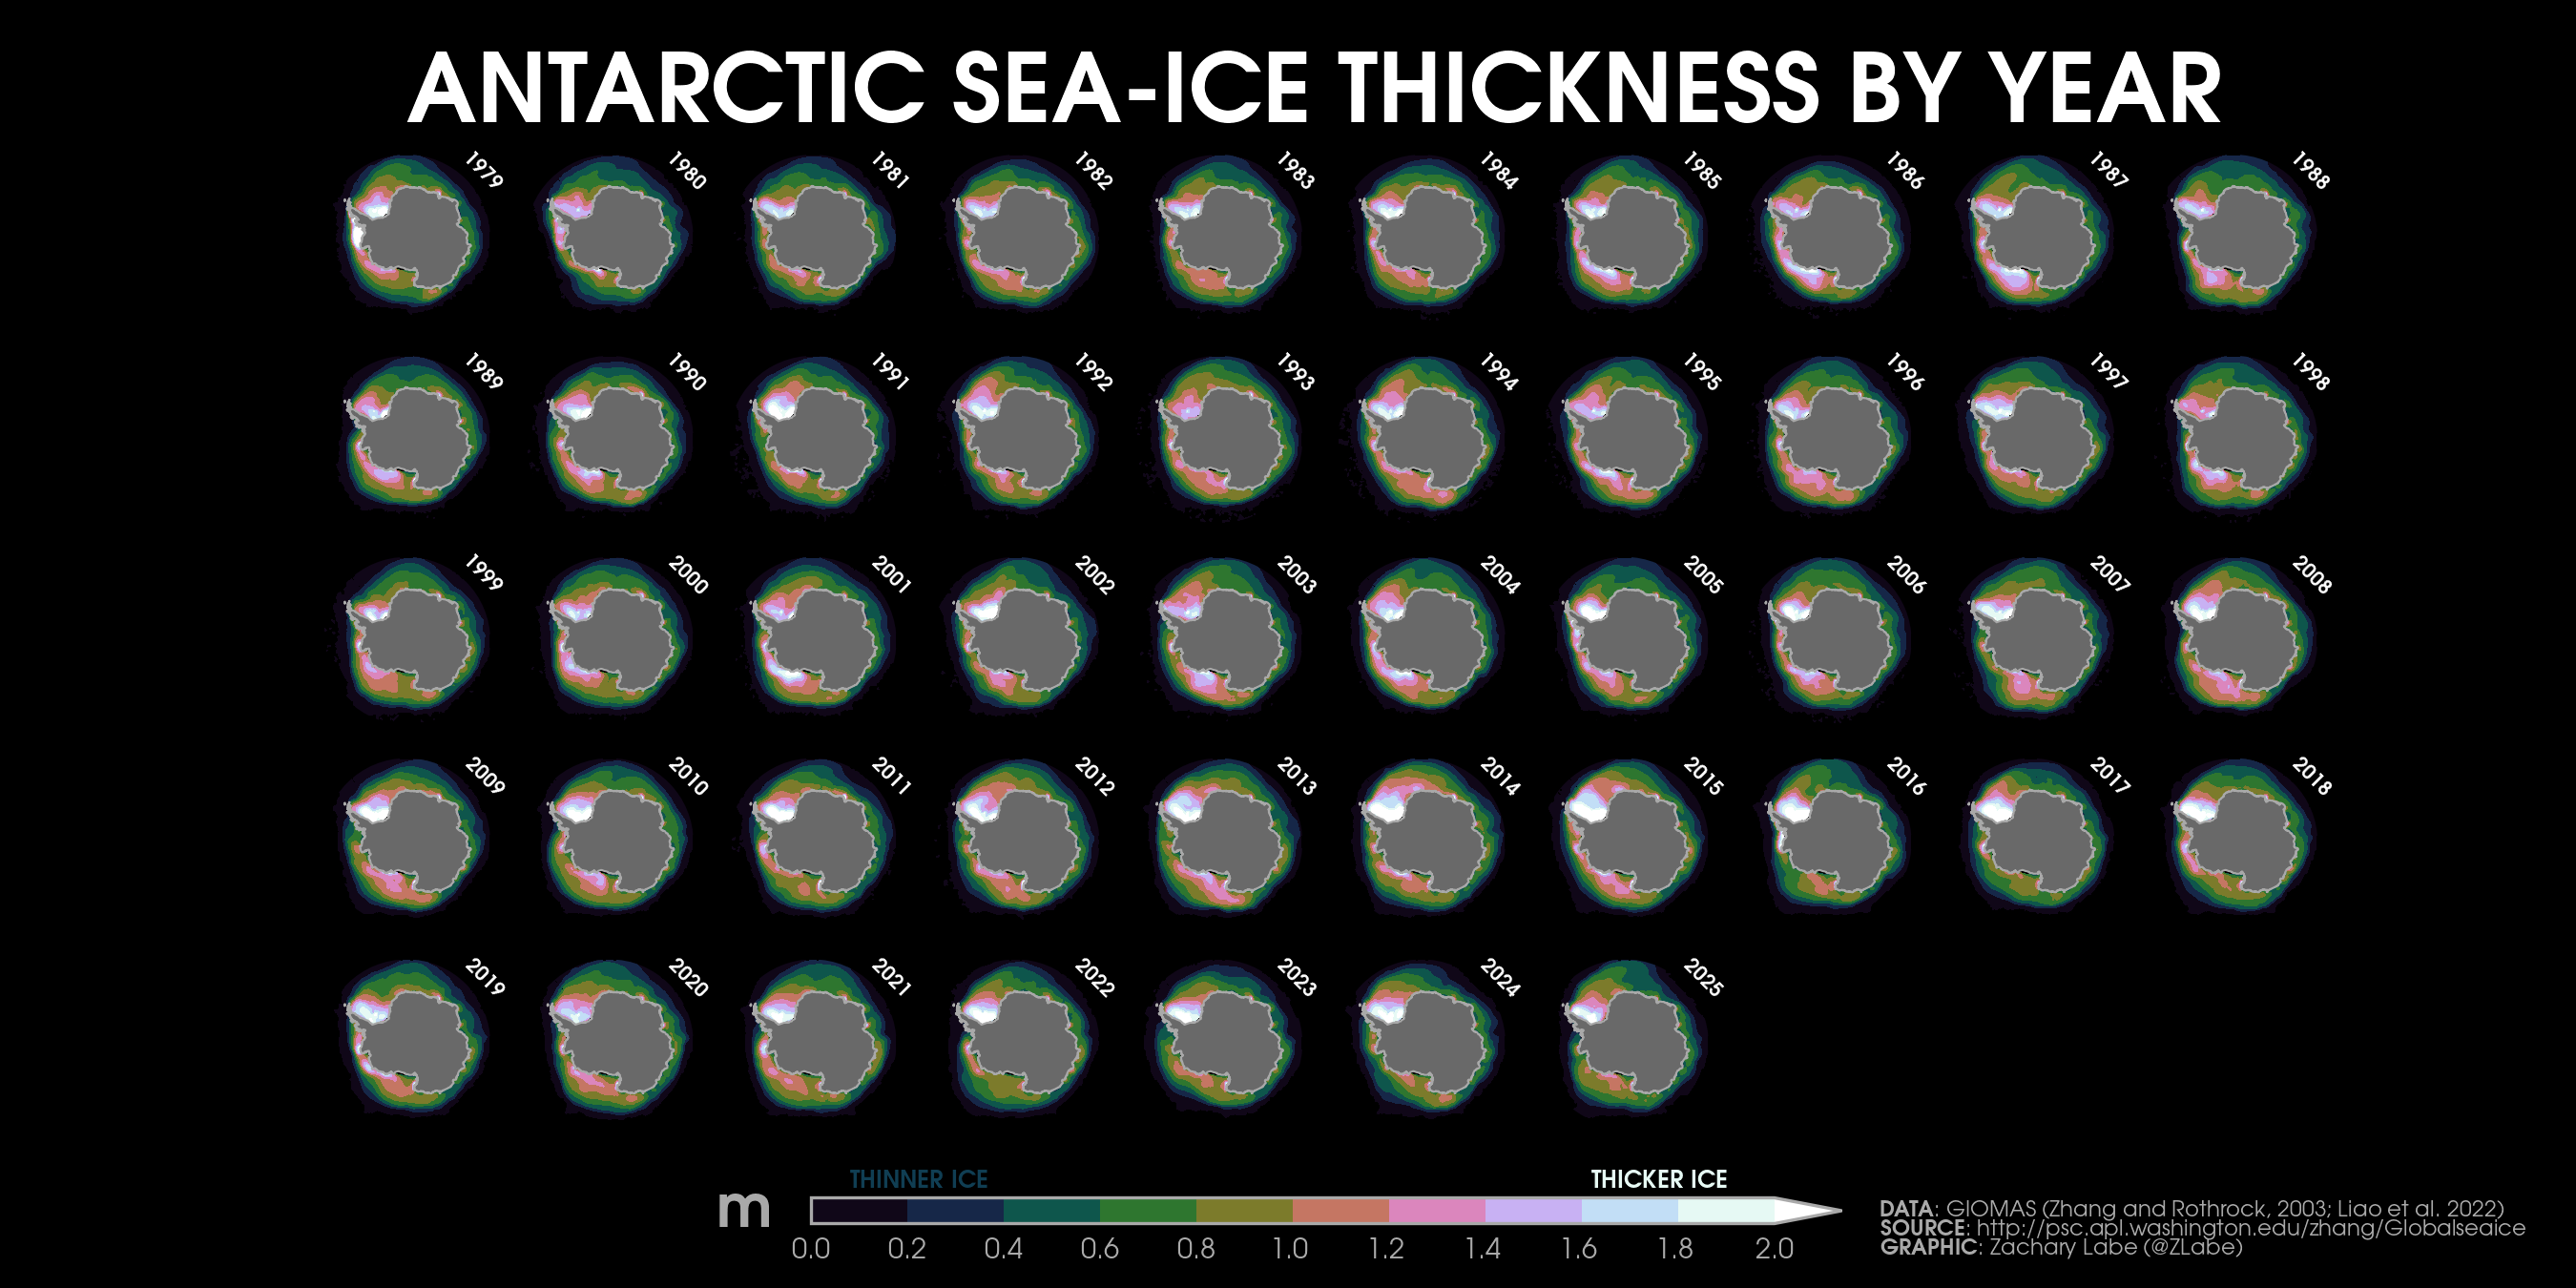
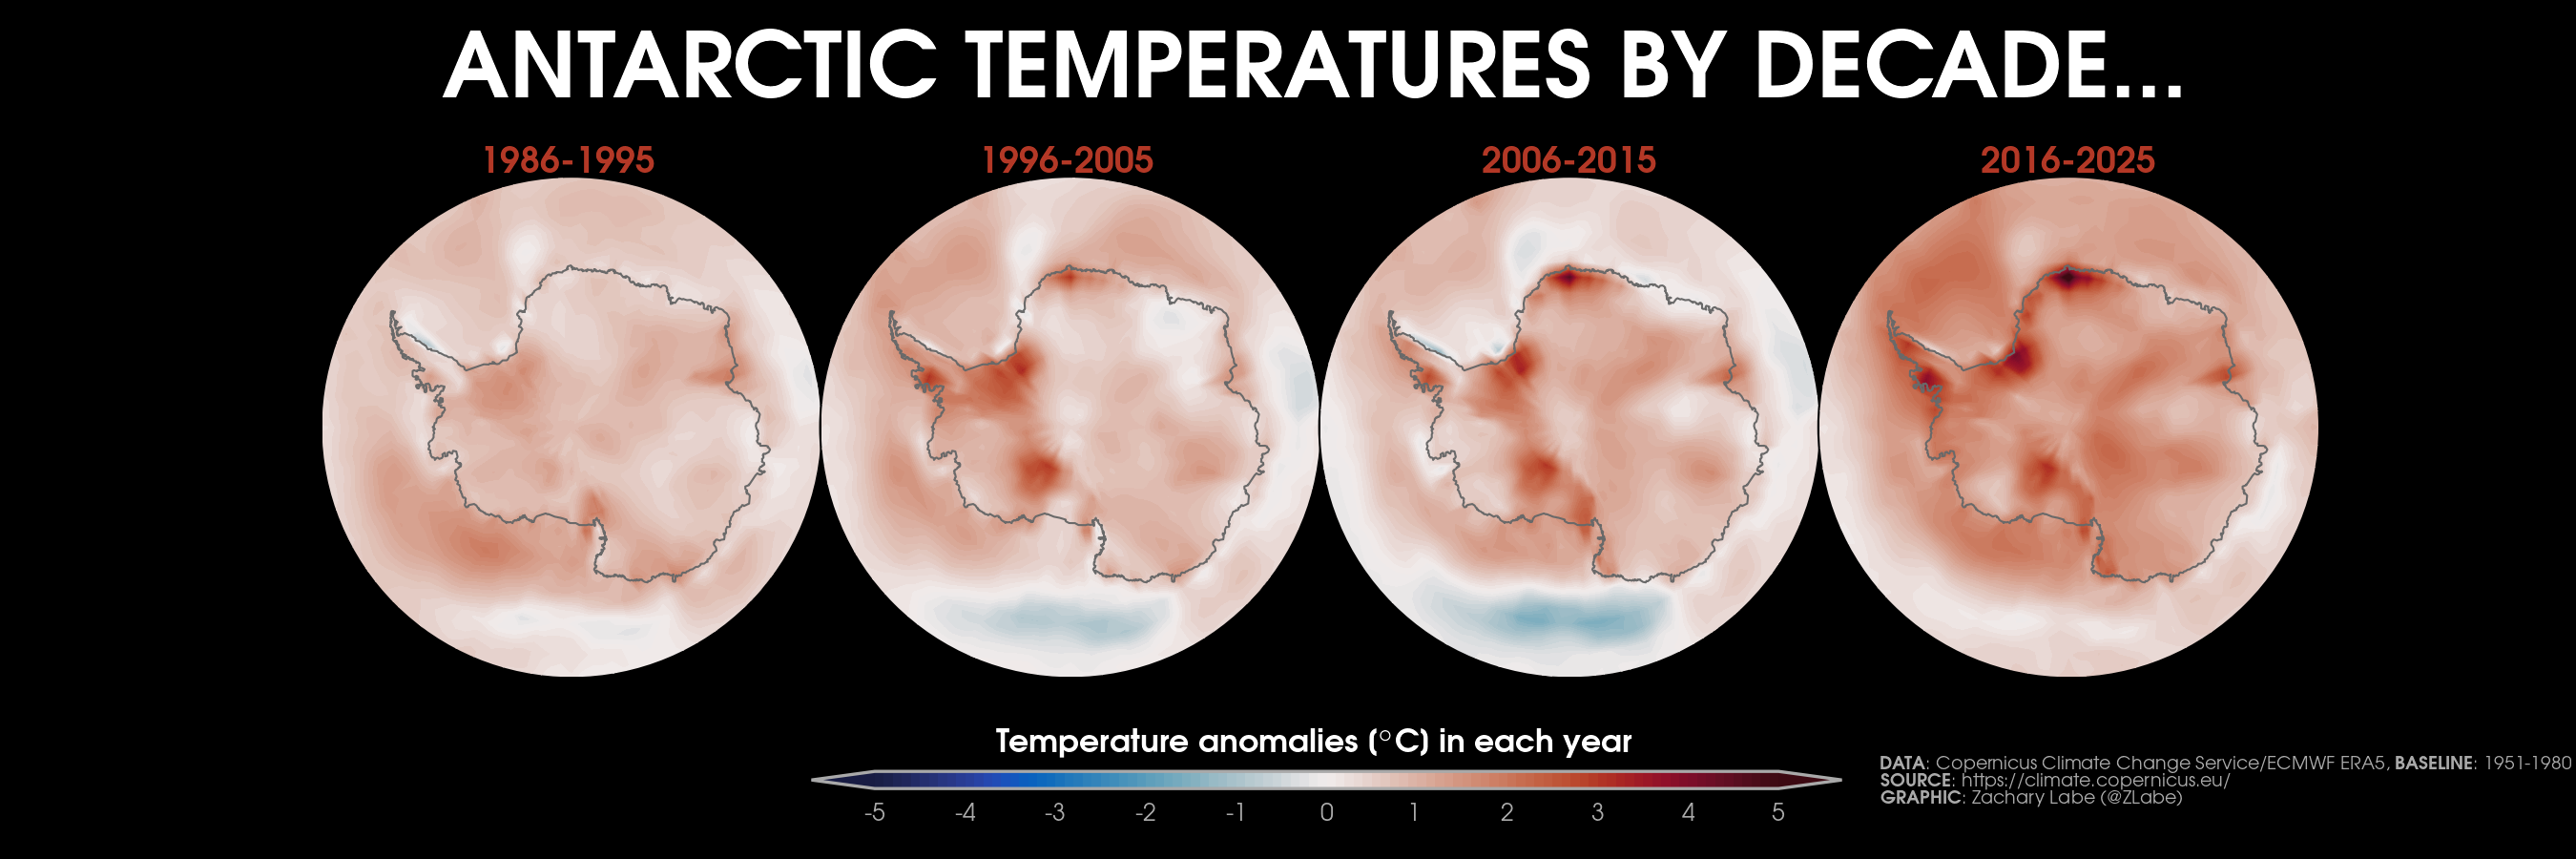
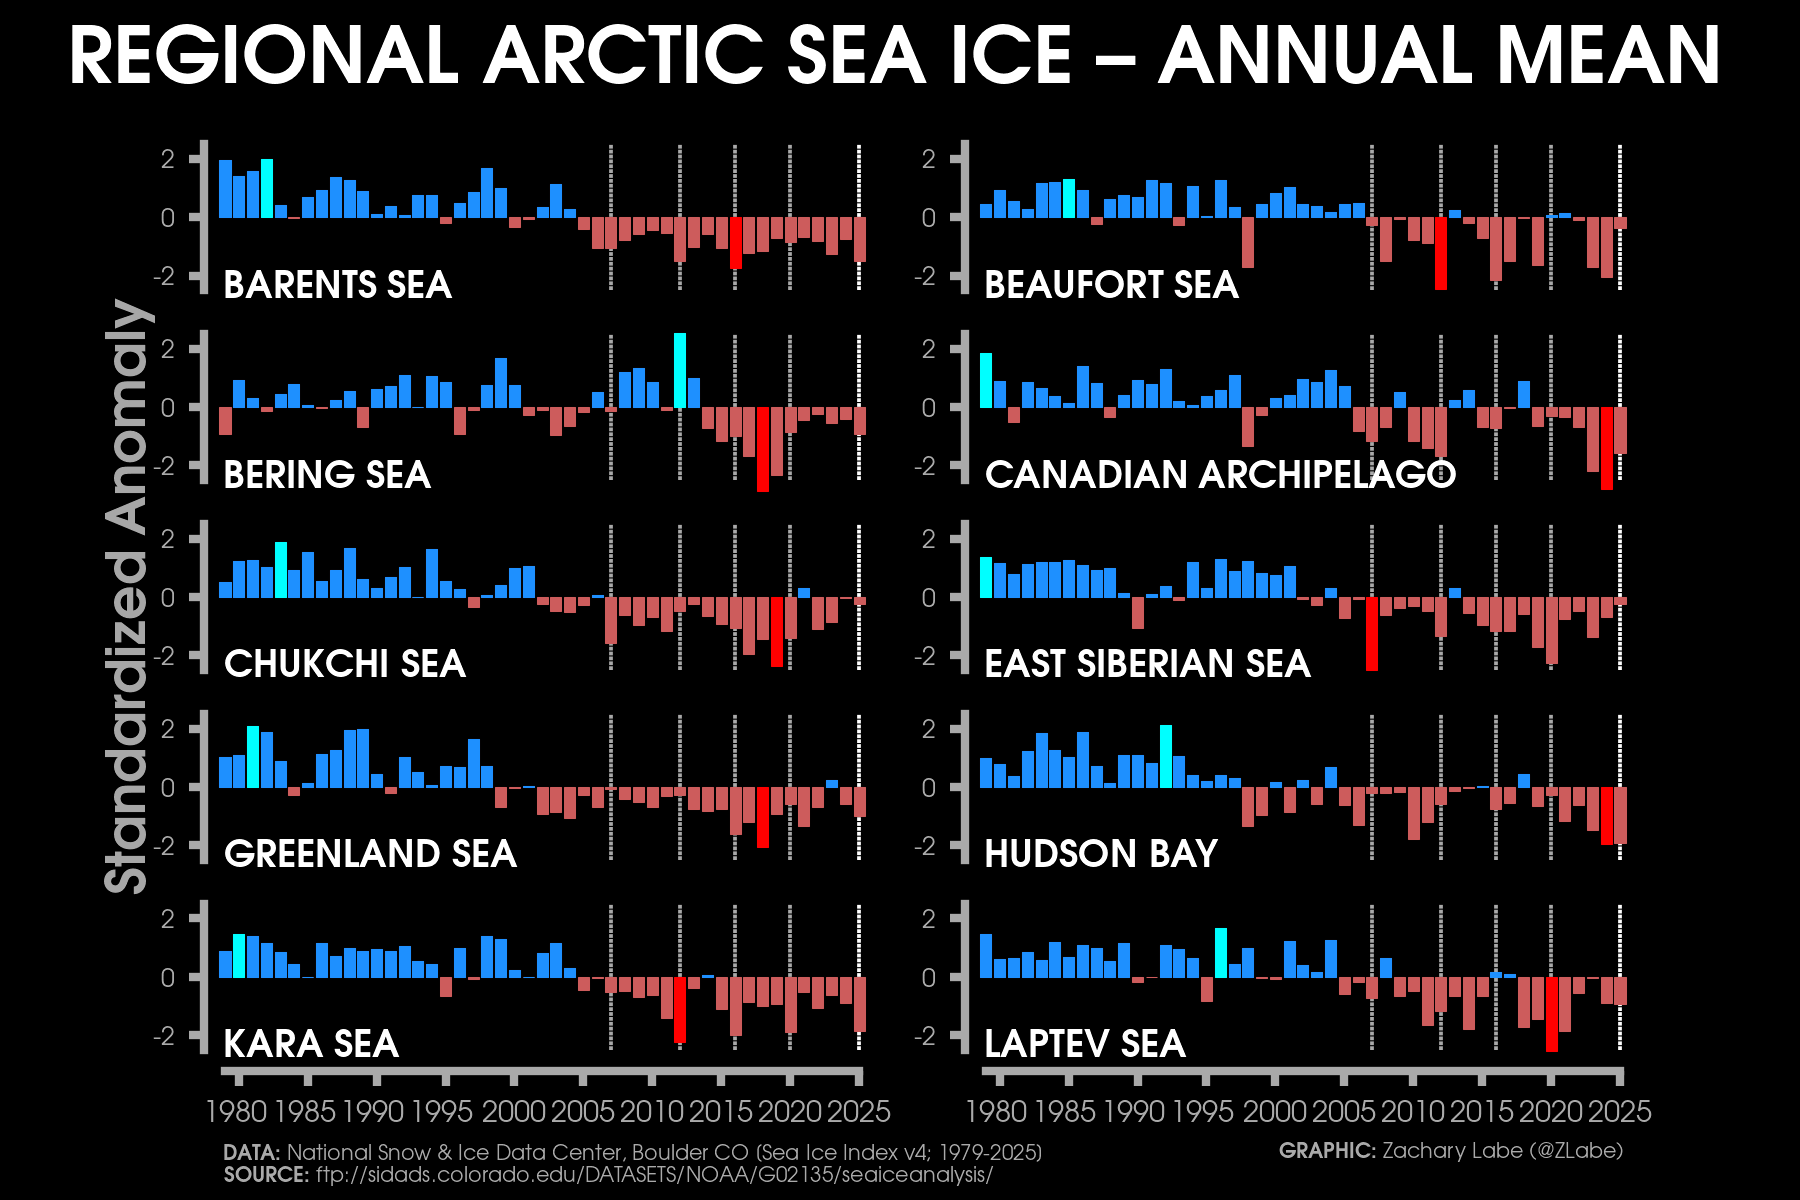
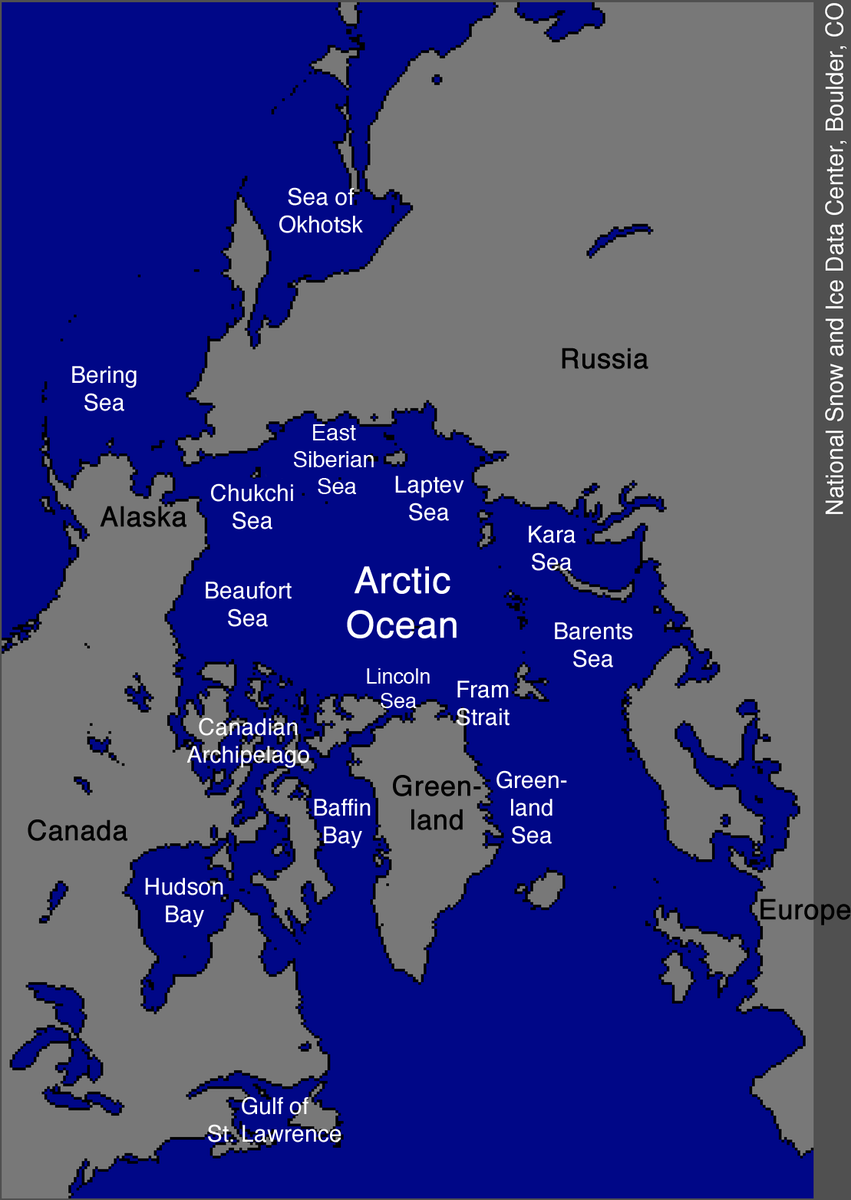
Animation of changes in average September sea ice extent from 1979 through 2025 – with substantial natural variability and a long-term decline. Data is freely available from the National Snow and Ice Data Center (NSIDC) at https://nsidc.org/data/seaice_index/. Updated on 1/17/2026.Monthly near-surface air temperature anomalies averaged over the Arctic (gold line; 65°N-90°N), high Arctic (dashed gold line; 80°N-90°N), Antarctic (blue line; 90°S-65°S), and high Antarctic (blue line; 90°S-80°S) from January 1940 to June 2026 (ERA5 reanalysis). Anomalies are calculated from a climatological baseline of 1951-1980. Data are smoothed using a 12-month forward running average. Graphic updated on 7/7/2026.Decadal trends (linear) in annual mean temperature and precipitation for the Arctic from 1979 to 2025. Data are from ERA5 reanalysis (https://cds.climate.copernicus.eu/cdsapp#!/dataset/reanalysis-era5-single-levels-monthly-means?tab=overview) and GPCP (https://psl.noaa.gov/data/gridded/data.gpcp.html). Graphic was updated on 2/8/2026.Change in annual mean precipitation rate anomalies from 1979 through 2025 for the Arctic (≥67°N latitude). Anomalies in each year are calculated to a 1981-2010 climatological reference period. Data are from GPCP (https://psl.noaa.gov/data/gridded/data.gpcp.html), ERA5 (https://cds.climate.copernicus.eu/cdsapp#!/dataset/reanalysis-era5-single-levels-monthly-means?tab=overview), and JRA-55 (https://jra.kishou.go.jp/JRA-55/index_en.html). Linear least squares trend lines are also displayed for each dataset. Graphic was updated on 1/10/2026.Annual means composited by decade for near-surface air temperatures (top) and Arctic sea-ice thickness (bottom) through 2025. Temperature anomalies are from ERA5 reanalysis using a baseline climatology of 1951-1980. Sea-ice thickness data is simulated from PIOMAS. Graphic was updated on 2/8/2026.Changes in annual mean surface air temperature anomalies (NOAA Merged Land Ocean Global Surface Temperature Analysis; NOAAGlobalTemp v6.0.0), annual mean Arctic sea ice extent (NSIDC, Sea Ice Index v4), and annual mean sea surface temperature anomalies (NOAA Optimum Interpolation Sea Surface Temperature V2.1; OISSTv21) over the satellite era and within the Arctic (67N+ latitude). NOAAGlobalTemp v6.0.0 is available from 1850 to 2025 at https://www.ncei.noaa.gov/products/land-based-station/noaa-global-temp. OISSTv21 is available from 1982 to 2025 at https://psl.noaa.gov/data/gridded/data.noaa.oisst.v2.highres.html. Updated 2/9/2026.Decadal trends (linear) in annual mean sea surface temperatures for the Arctic from 1982 to 2025. Data are from OISSTv2.1 (https://psl.noaa.gov/data/gridded/data.noaa.oisst.v2.highres.html). See more in our annual Arctic Report Card at https://arctic.noaa.gov/report-card/report-card-2025/sea-surface-temperature-2025/. Graphic updated on 1/4/2026.Decadal trends (linear) in Arctic sea-ice concentration from 1979 to 2025 for each respective month (satellite-era). Data are from NOAA/NSIDC Climate Data Record (CDR) of Passive Microwave Sea Ice Concentration, Version 6 (https://doi.org/10.7265/b18j-z797). Graphic was updated on 1/17/2026.Changes in annual mean Arctic sea ice extent (NSIDC, Sea Ice Index v4) and air temperature anomalies (NOAA Merged Land Ocean Global Surface Temperature Analysis; NOAAGlobalTemp v6.0.0) over the satellite era. NOAAGlobalTemp v6.0.0 is available from 1850 to 2025 at https://www.ncei.noaa.gov/products/land-based-station/noaa-global-temp. Updated 2/9/2026.Monthly temperature anomalies and rankings (1 = warmest, 47 = coldest) from ERA5 reanalysis of 2-m air temperatures in the Arctic (70°N+). Anomalies are computed relative to a climatological baseline of 1981-2010. Figure is updated through 2025 on 2/8/2026.Monthly temperature anomalies and rankings (1 = warmest, 86 = coldest) from ERA5 reanalysis of 2-m air temperatures in the Arctic (64N+) from January 1940 to December 2025. Anomalies for each month/year are computed relative to a climatological baseline of 1951-1980. Figure is updated through 2025 on 2/8/2026.Changes in annual mean Arctic sea ice extent (NSIDC, Sea Ice Index v3) and volume (PIOMAS v2.1, Zhang and Rothrock, 2003) over the satellite era from 1979 to 2025. Updated 1/6/2026.Changes in annual mean Arctic and Antarctic sea-ice extents (NSIDC, Sea Ice Index v4) over the satellite era from 1979 to 2025. The linear least squares trend line is also displayed for each pole (dashed white line). Graphic was updated on 1/4/2026.Annual mean Arctic (thin red line) and Antarctic (dashed blue line) sea-ice extents over the passive microwave satellite record (NSIDC, DMSP SMMR-SSM/I-SSMIS-AMSR2 and JAXA AMSR2) from 1979 to 2025. 2025 observed the 3rd lowest Antarctic sea-ice extent on record and the lowest Arctic sea-ice extent on record. Data is from the NSIDC’s Sea Ice Index v4 (https://nsidc.org/data/seaice_index). Visualization created on 4 January 2026.Change in land ice mass since 2002 (Right: Greenland, Left: Antarctica). Data is measured by NASA’s Gravity Recovery and Climate Experiment (GRACE/GRACE-FO) satellites with observations through March 2026. Additional information can be found at https://science.nasa.gov/earth/explore/earth-indicators/ice-sheets/. Graphic was updated on 5/30/2026.Changes in annual mean Arctic sea ice extent (NSIDC; https://doi.org/10.7265/N5K072F8) over the satellite era (1979-2025) compared to a reconstruction of annual mean Arctic sea ice extent from Brennan et al. (2020; https://doi.org/10.1029/2019GL086843; 1850-2018). Anomalies are computed relative to a 1979-2013 baseline. The blue shading denotes the 2.5-97.5th percentile range of the MPI-HadCRUT4 reconstructed ensemble members. Additional data can be found from Brennan et al. (2020) at https://zenodo.org/record/3717240. Updated 1/4/2026.Changes in annual mean Arctic sea ice extent (NSIDC; https://doi.org/10.7265/N5K072F8) and volume (PIOMAS v2.1; http://psc.apl.uw.edu/research/projects/arctic-sea-ice-volume-anomaly/data/) over the satellite era compared to reconstructions of Arctic sea ice extent (SIBT1850; https://doi.org/10.7265/jj4s-tq79) and volume (PIOMAS-20C v1; https://psc.apl.uw.edu/research/projects/piomas-20c/). Updated 1/6/2026.Current simulated (PIOMAS; Zhang and Rothrock, 2003) sea ice thickness averaged over each year from 1979 to 2025. Updated 2/7/2026.Average sea-ice thickness for each month from January 1979 to December 2025 near the North Pole (averaged north of 85°N latitude). Simulated data is available using PIOMAS v2.1 (https://psc.apl.uw.edu/research/projects/arctic-sea-ice-volume-anomaly/data/model_grid). Learn more about this visualization in my November 2025 blog at https://zacklabe.com/blog-archive-2025/. Graphic updated on 1/4/2026.Temperature rankings (1 = warmest, 48 = coldest) from NCEP/NCAR (R1) reanalysis of Arctic 925 hPa air temperatures (70N+). Figure is updated through February 2026. [Note that R1 has been decommissioned, and this is the final update for this particular visualization. A new version using ERA5 can be found on my “Arctic Air Temperatures” page, which is updated monthly.]Current simulated (GIOMAS; Zhang and Rothrock, 2003) sea ice thickness averaged over each year from 1979 to 2025. Updated 1/18/2026.Annual means composited by decade for near-surface air temperatures in the Antarctic through 2025. Temperature anomalies are from ERA5 reanalysis using a baseline climatology of 1951-1980. Graphic was updated on 2/8/2026.Reconstructed late-summer (August) Arctic sea ice extent during the last 1450 years. Sea ice extent data have been smoothed using a 40-year running mean (light blue). The shading shows the 95% confidence interval (dark blue). Smoothed observational data are compared using a dashed line (red). This figure is reproduced from Figure 3a in Kinnard et al. 2011 (Nature: https://www.nature.com/articles/nature10581).Annual mean temperature anomalies over the last 120 years in the Arctic. Data is from Berkeley Earth Surface Temperatures (BEST; http://berkeleyearth.org/data/) using a reference period of 1951-1980. Graphic updated through 2025 on 2/1/2026.Surface air temperature anomalies over the Arctic during the satellite-era in boreal fall (October to December). This period coincides with the largest Arctic amplification trends. Data is from Berkeley Earth Surface Temperatures (BEST; http://berkeleyearth.org/data/) using a reference period of 1951-1980. Graphic updated from 1979 through 2025 on 2/1/2026.A look at September Arctic sea ice concentration over the last 100 years (through 2017) using the latest NSIDC SIBT gridded 1850- reconstruction from Walsh et al. [2016]. The discontinuity between 1978-1979 is the transition to the passive microwave satellite era.Annual mean surface air temperature anomalies for the Arctic (67-90°N) and for the Antarctic (67°S-90°S) from 1979 to 2025. Linear trend lines (dashed) are also shown over the 1979 to 2025 period. GISS Surface Temperature Analysis (GISTEMPv4) is available from 1880 to 2025 at https://data.giss.nasa.gov/gistemp/ and compared to a 1951-1980 climate baseline. Graphic was updated on 1/17/2026.Annual mean surface air temperature anomalies for the Arctic (67-90°N) and for the Global average (90°S-90°N) from 1950 to 2025. Linear trend lines (dashed) are also shown over the 1990 to 2025 period. GISS Surface Temperature Analysis (GISTEMPv4) is available from 1880 to 2025 at https://data.giss.nasa.gov/gistemp/. Tools including the NOAA/ESRL Physical Sciences Division Web-based Reanalysis Intercomparison Tool: Monthly/Seasonal Time Series (WRIT) have been used for the construction of this plot. Analysis will updated as annual data becomes available. Graphic was updated on 1/17/2026.Sea ice is getting younger and thinner. Here is an animation of Arctic sea ice age during the last week in August from 1984 to 2024. Data is from EASE-Grid Sea Ice Age, Version 4 (https://doi.org/10.5067/UTAV7490FEPB). Graphic was updated on 1/4/2026.Standardized annual-mean Arctic sea ice extents (NSIDC Sea Ice Index v4 : DMSP SSM/I-SSMIS F-18, AMSR2) calculated over the 1979 to 2025 satellite-era. Record high years for each ice basin are displayed with a bright blue bar, and record low years are displayed with a bright red bar. A map of the regions can be found at https://zacklabe.com/wp-content/uploads/2022/08/b203f-nsidc_mapseas.png. The years 2007, 2012, 2016, and 2020 are annotated with a dashed vertical grey line. 2025 is annotated with a dashed vertical white line. The graphic was produced on 1/4/2026.Regional Arctic sea ice extent averaged for each mean June to September period over the 1979 to 2025 satellite-era (NSIDC Sea Ice Index v4 : DMSP SSM/I-SSMIS F-18, AMSR2). A map of the individual regions can be found at https://zacklabe.com/wp-content/uploads/2022/08/b203f-nsidc_mapseas.png. The linear least squares trend line is also displayed over this period for each respective marginal sea (dashed red line). The graphic was produced on 1/4/2026.Daily Arctic sea ice extents (NSIDC, DMSP SSM/I-SSMIS, AMSR2) from 1979 through 2025. Missing data shown in black.Daily Arctic sea ice extent anomalies (NSIDC, DMSP SSM/I-SSMIS, AMSR2) from 1979 through 2025. Missing data shown in black. Anomalies are calculated from an averaged 1981-2010 baseline.Daily Arctic sea ice extent anomalies (NSIDC, DMSP SSM/I-SSMIS, AMSR2) from 1979 through 2025. Missing data shown in black. Z scores are calculated from an averaged 1979-2025 baseline.Monthly record high (blue – #47) and record low (red – #1) Arctic sea ice extents over the satellite era (1979-2025). Data is from the NSIDC Sea Ice Index v4. Graphic updated on 1/4/2026.Daily Arctic sea ice thickness (PIOMASv2.1; Zhang and Rothrock, 2003) from 1 January 1979 through 31 December 2025.Daily Arctic sea ice thickness anomalies (PIOMASv2.1; Zhang and Rothrock, 2003) from 1 January 1979 through 31 December 2025. Anomalies are calculated from an averaged 1981-2010 baseline.Daily Arctic sea ice thickness anomalies (PIOMASv2.1; Zhang and Rothrock, 2003) from 1 January 1979 through 31 December 2025. Data are standardized using a 1979-2025 baseline.Trends in sea ice thickness/volume are another important indicator of Arctic climate change. While sea ice thickness observations are sparse, here we utilize the ocean and sea ice model, PIOMAS (Zhang and Rothrock, 2003) to visualize annual mean sea ice thickness from 1979 to 2025. Sea ice less than 1.5 meters is masked out (black) to emphasize the loss of thicker, older ice. Updated 1/4/2026.Latest PIOMAS (model; Zhang and Rothrock, 2003) sea ice volume (SIV) across the Arctic for each year from 1979 to 2025. Updated 1/6/2026.Animation of annual mean near-surface temperature anomalies in the Arctic for each year from 1950 to 2025. Data is from ERA5 (https://doi.org/10.24381/cds.f17050d7). Anomalies are calculated relative to a 1951 to 1980 climate baseline. Graphic was updated on 1/20/2026.Trends in sea ice thickness are another important indicator of Arctic climate change. While sea ice thickness observations are sparse, here we utilize the ocean and sea ice model, PIOMAS (Zhang and Rothrock, 2003), to visualize mean monthly sea ice thickness from 1979 to 2025. Updated 1/4/2026.Changes in the annual maximum and minimum of daily Arctic sea-ice volume simulated from PIOMAS (Zhang and Rothrock, 2003). Trends are calculated using a linear least squares fit for the white dashed lines between 1979 and 2025. Graphic updated 12/6/2025.Latest GIOMAS (model; Zhang and Rothrock, 2003) simulated sea ice volume (SIV) for the entire globe (Arctic + Antarctic) for each year from 1979 to 2025. Updated 1/18/2026.
My related research
[23] Joh, Y., S-W. Yeh, T.L. Delworth, Z.M. Labe, A.T. Wittenberg, W.F. Cooke, J. Lou, and Y-G. Park (2026). Evolving synchronization of Gulf Stream and Kuroshio-Oyashio Extension in a changing climate. Science Advances, DOI:10.1126/sciadv.adx6366 [HTML][BibTeX][Code][Data]
[22] Timmermans, M.-L. and Z.M. Labe (2025). Sea surface temperature [in “Arctic Report Card 2025”], NOAA, DOI:10.25923/pz7y-3b10 [HTML][BibTeX][Code] [Press Release]
[21] Eayrs, C. and Z.M. Labe (2025). The future of sea ice. Comprehensive Cryospheric Science and Environmental Change, DOI:10.1016/B978-0-323-85242-5.00050-6 [HTML][BibTeX]
[20] Timmermans, M.-L. and Z.M. Labe (2025). [The Arctic] Sea surface temperature [in “State of the Climate in 2024”]. Bull. Amer. Meteor. Soc., DOI:10.1175/BAMS-D-25-0104.1 [HTML][BibTeX][Code] [Press Release]
[19] Timmermans, M.-L. and Z.M. Labe (2024). Sea surface temperature [in “Arctic Report Card 2024”], NOAA, DOI:10.25923/9z96-aq19 [HTML][BibTeX][Code] [Press Release]
[18] Vanek S.B., Z.M. Labe, O. Lauter, K. Shionalyn, M.A. Shadab, E. Adasheva, A. Margevich, M.N. Schaberg, L. Ashokkumar, and J.N. Naoukin (2024). Exploring the past, present, and future of USAPECS: Lessons from a decade of supporting early career research across national and international polar networks. Arctic Yearbook, ISSN 2298-2418 [HTML][BibTeX][PDF]
[17] Timmermans, M.-L. and Z.M. Labe (2024). [The Arctic] Sea surface temperature [in “State of the Climate in 2023”]. Bull. Amer. Meteor. Soc., DOI:10.1175/BAMS-D-24-0101.1 [HTML][BibTeX][Code] [Press Release]
[16] Bushuk, M., S. Ali, D. Bailey, Q. Bao, L. Batte, U.S. Bhatt, E. Blanchard-Wrigglesworth, E. Blockley, G. Cawley, J. Chi, F. Counillon, P. Goulet Coulombe, R. Cullather, F.X. Diebold, A. Dirkson, E. Exarchou, M. Gobel, W. Gregory, V. Guemas, L. Hamilton, B. He, S. Horvath, M. Ionita, J. E. Kay, E. Kim, N. Kimura, D. Kondrashov, Z.M. Labe, W. Lee, Y.J. Lee, C. Li, X. Li, Y. Lin, Y. Liu, W. Maslowski, F. Massonnet, W.N. Meier, W.J. Merryfield, H. Myint, J.C. Acosta Navarro, A. Petty, F. Qiao, D. Schroder, A. Schweiger, Q. Shu, M. Sigmond, M. Steele, J. Stroeve, N. Sun, S. Tietsche, M. Tsamados, K. Wang, J. Wang, W. Wang, Y. Wang, Y. Wang, J. Williams, Q. Yang, X. Yuan, J. Zhang, and Y. Zhang (2024). Predicting September Arctic sea ice: A multi-model seasonal skill comparison. Bulletin of the American Meteorological Society, DOI:10.1175/BAMS-D-23-0163.1 [HTML][BibTeX][Code]
[14] Timmermans, M.-L. and Z.M. Labe (2023). [The Arctic] Sea surface temperature [in “State of the Climate in 2022”]. Bull. Amer. Meteor. Soc., DOI:10.1175/BAMS-D-23-0079.1 [HTML][BibTeX][Code] [Press Release]
[13] Timmermans, M.-L. and Z.M. Labe (2022). Sea surface temperature [in “Arctic Report Card 2022”], NOAA, DOI:10.25923/p493-2548 [HTML][BibTeX][Code] [Press Release]
[12] Timmermans, M.-L. and Z.M. Labe (2022). [The Arctic] Sea surface temperature [in “State of the Climate in 2021”]. Bull. Amer. Meteor. Soc., DOI:10.1175/BAMS-D-22-0082.1 [HTML][BibTeX][Code] [Press Release]
[11]Labe, Z.M. and E.A. Barnes (2022), Comparison of climate model large ensembles with observations in the Arctic using simple neural networks. Earth and Space Science, DOI:10.1029/2022EA002348 [HTML][BibTeX][Code] [Plain Language Summary]
[10] Timmermans, M.-L. and Z.M. Labe (2021). Sea surface temperature [in “Arctic Report Card 2021”], NOAA, DOI:10.25923/2y8r-0e49 [HTML][BibTeX][Code] [Press Release]
[9] Timmermans, M.-L. and Z.M. Labe (2021). [The Arctic] Sea surface temperature [in “State of the Climate in 2020”]. Bull. Amer. Meteor. Soc., DOI:10.1175/BAMS-D-21-0086.1 [HTML][BibTeX][Code] [Press Release]
[7] Timmermans, M.-L. and Z.M. Labe (2020). Sea surface temperature [in “Arctic Report Card 2020”], NOAA, DOI:10.25923/v0fs-m920 [HTML][BibTeX][Code] [Press Release]
[6] Timmermans, M.-L., Z.M. Labe, and C. Ladd (2020). [The Arctic] Sea surface temperature [in “State of the Climate in 2019”], Bull. Amer. Meteor. Soc., DOI:10.1175/BAMS-D-20-0086.1 [HTML][BibTeX][Code] [Press Release]
[4] Thoman, R.L., U. Bhatt, P. Bieniek, B. Brettschneider, M. Brubaker, S. Danielson, Z.M. Labe, R. Lader, W. Meier, G. Sheffield, and J. Walsh (2019): The record low Bering Sea ice extent in 2018: Context, impacts and an assessment of the role of anthropogenic climate change [in “Explaining Extreme Events of 2018 from a Climate Perspective”]. Bull. Amer. Meteor. Soc, DOI:10.1175/BAMS-D-19-0175.1 [HTML][BibTeX][Code] [Press Release]
[3]Labe, Z.M., Y. Peings, and G. Magnusdottir (2019). The effect of QBO phase on the atmospheric response to projected Arctic sea ice loss in early winter, Geophysical Research Letters, DOI:10.1029/2019GL083095 [HTML][BibTeX] [Plain Language Summary]
[2]Labe, Z.M., Y. Peings, and G. Magnusdottir (2018), Contributions of ice thickness to the atmospheric response from projected Arctic sea ice loss, Geophysical Research Letters, DOI:10.1029/2018GL078158 [HTML][BibTeX] [Plain Language Summary][Arctic Today]
[1]Labe, Z.M., G. Magnusdottir, and H.S. Stern (2018), Variability of Arctic sea ice thickness using PIOMAS and the CESM Large Ensemble, Journal of Climate, DOI:10.1175/JCLI-D-17-0436.1 [HTML][BibTeX] [Plain Language Summary]
For more visualizations, follow me on Twitter (or Mastodon). All of the Python code used to generate these figures are available from my GitHub account. Most scripts use data sets that are generated via ftp retrieval.
*These figures may be freely distributed (with credit). Information about the data can be found on my references page and methods page.


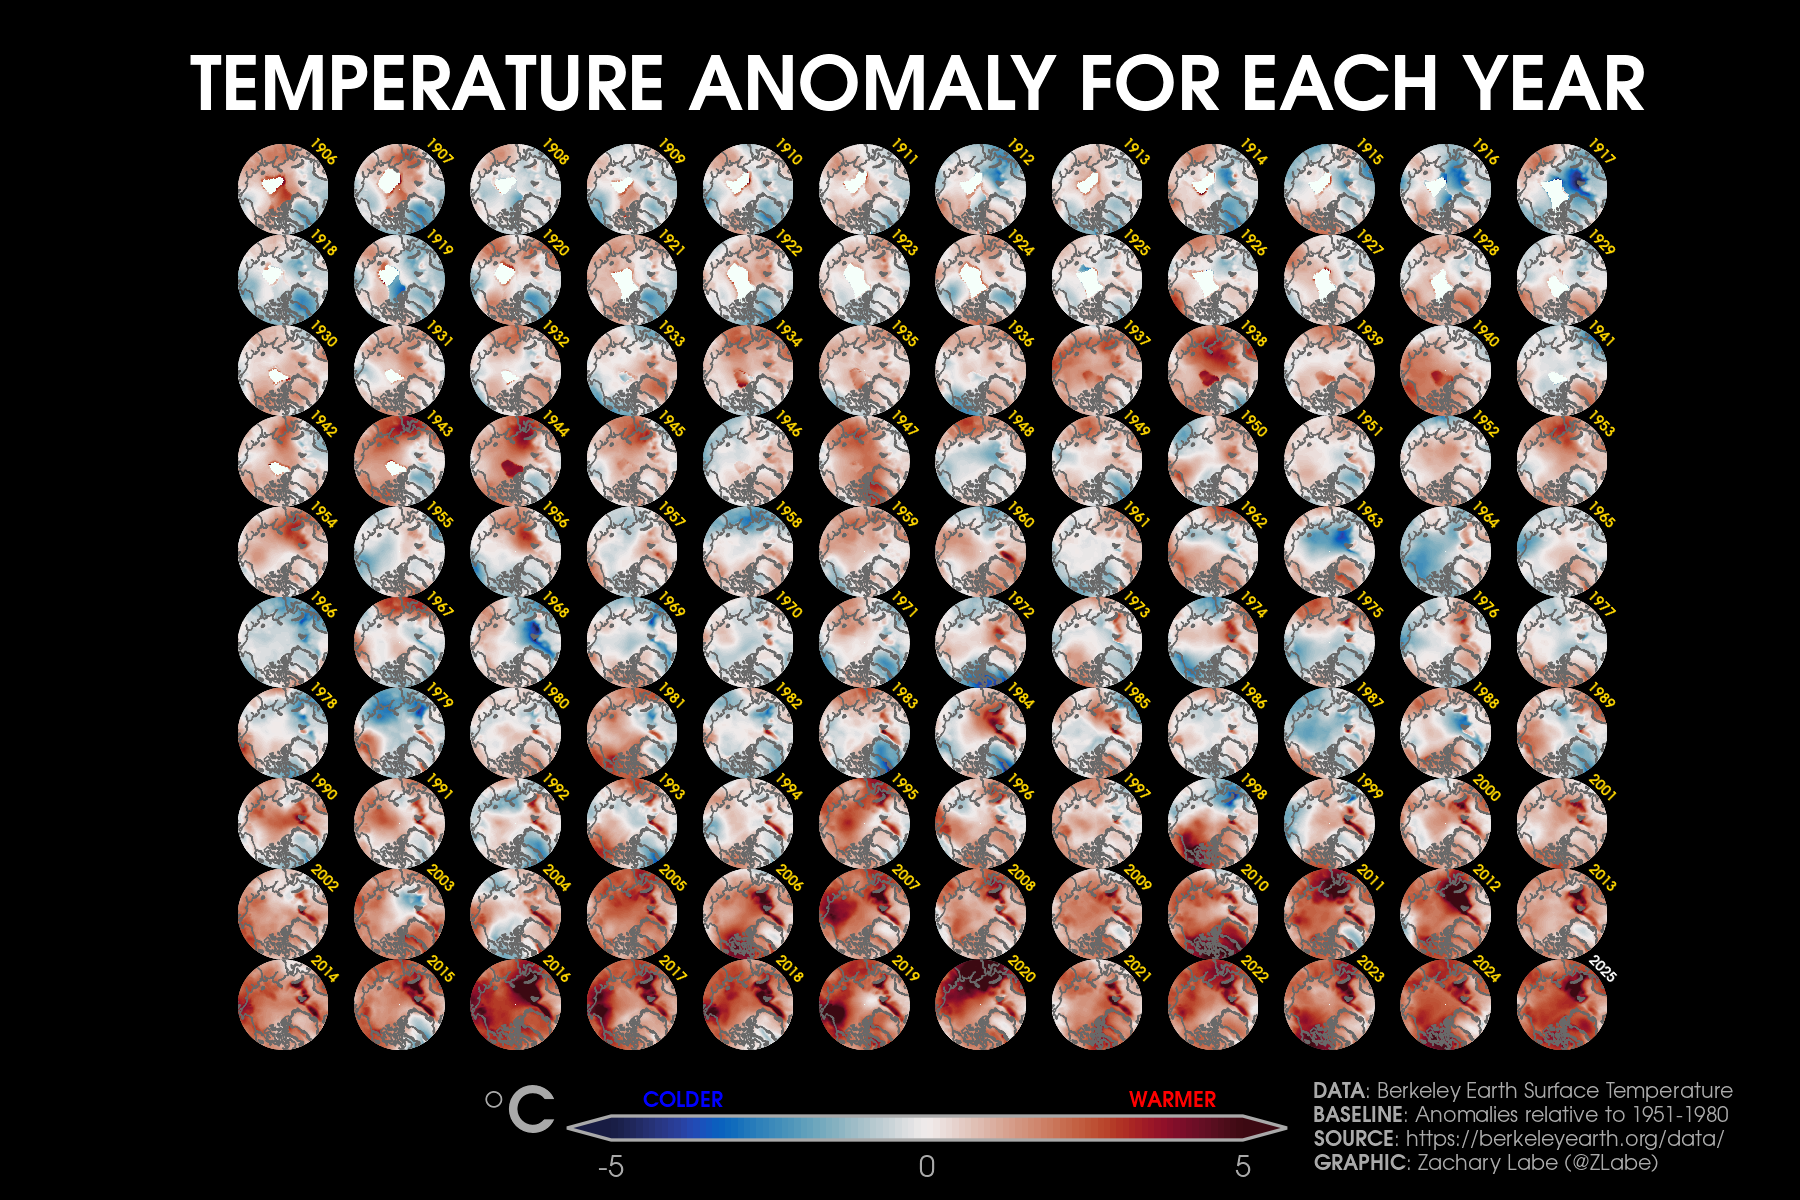
