Near real-time visualizations
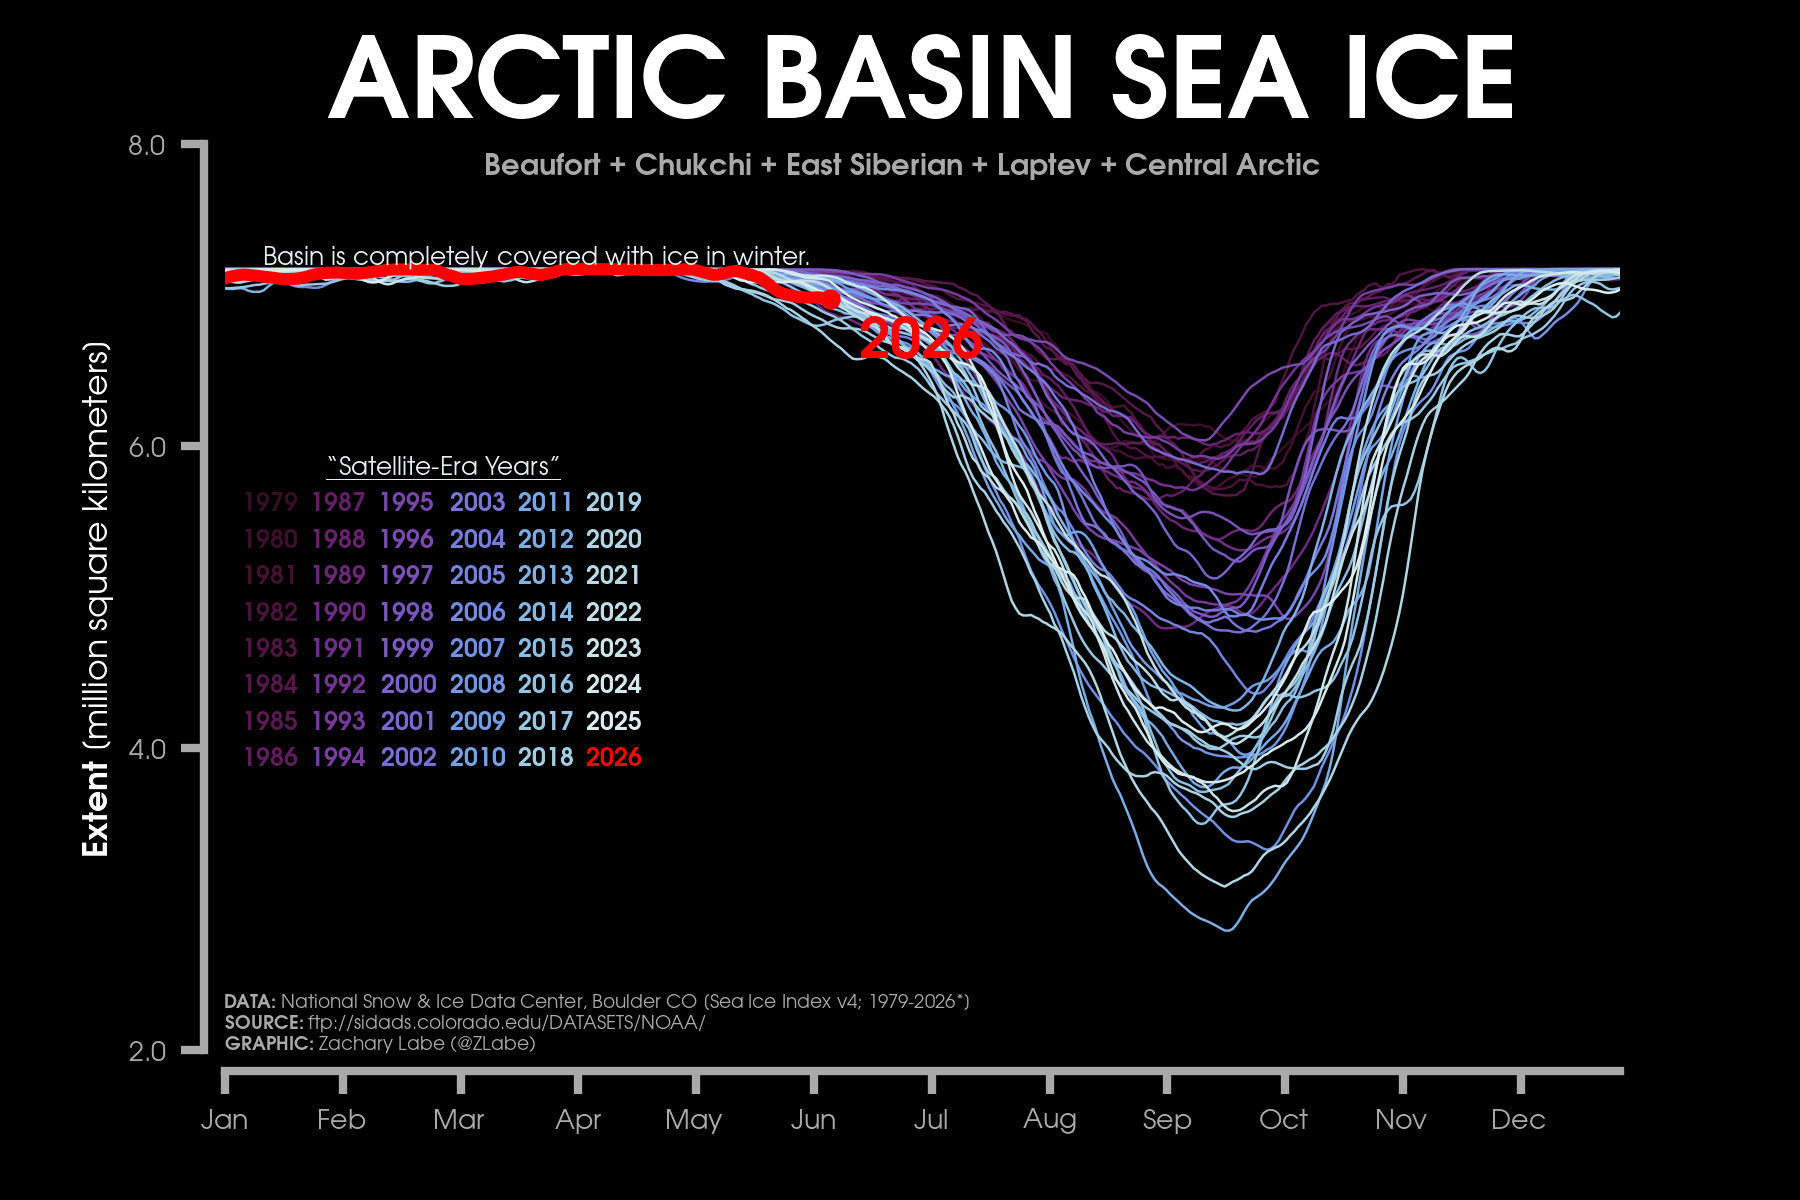
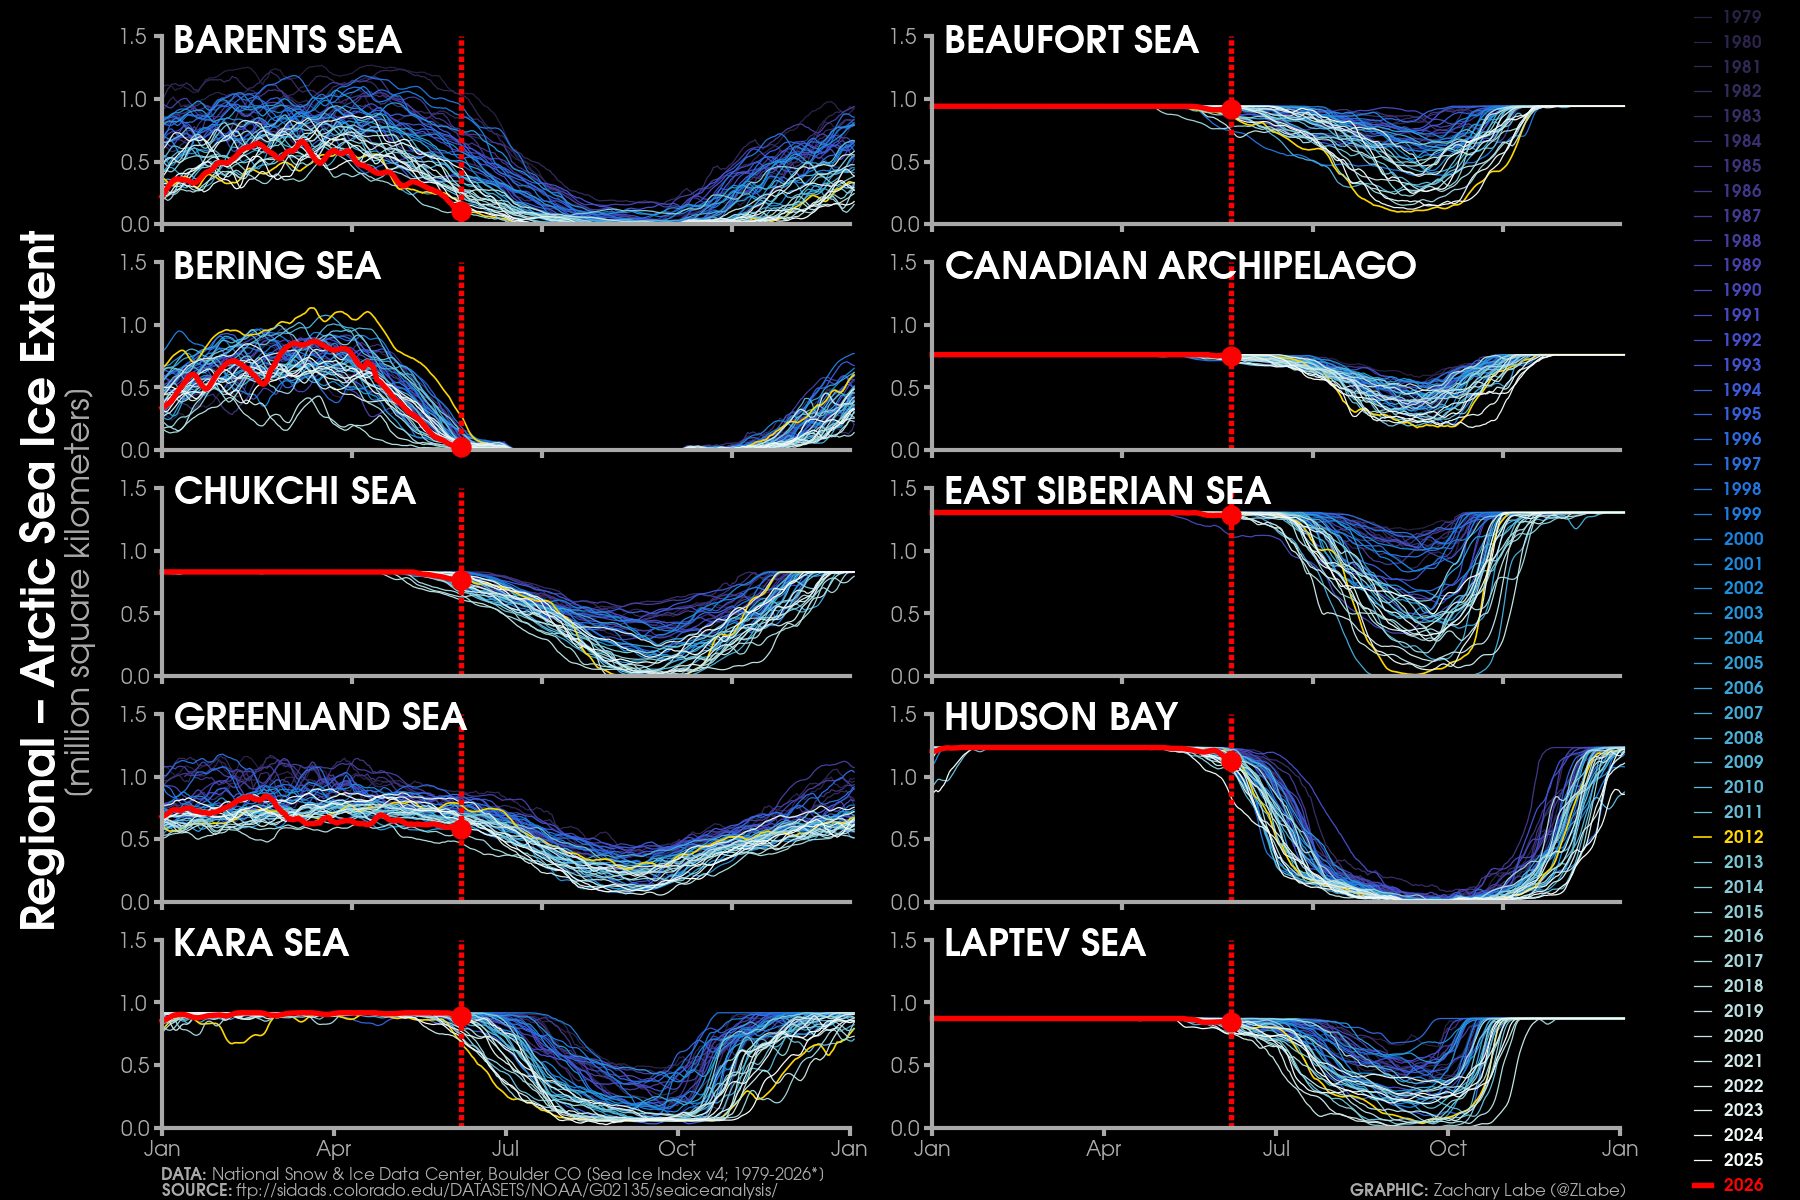
[Arctic Climate Seasonality and Variability]
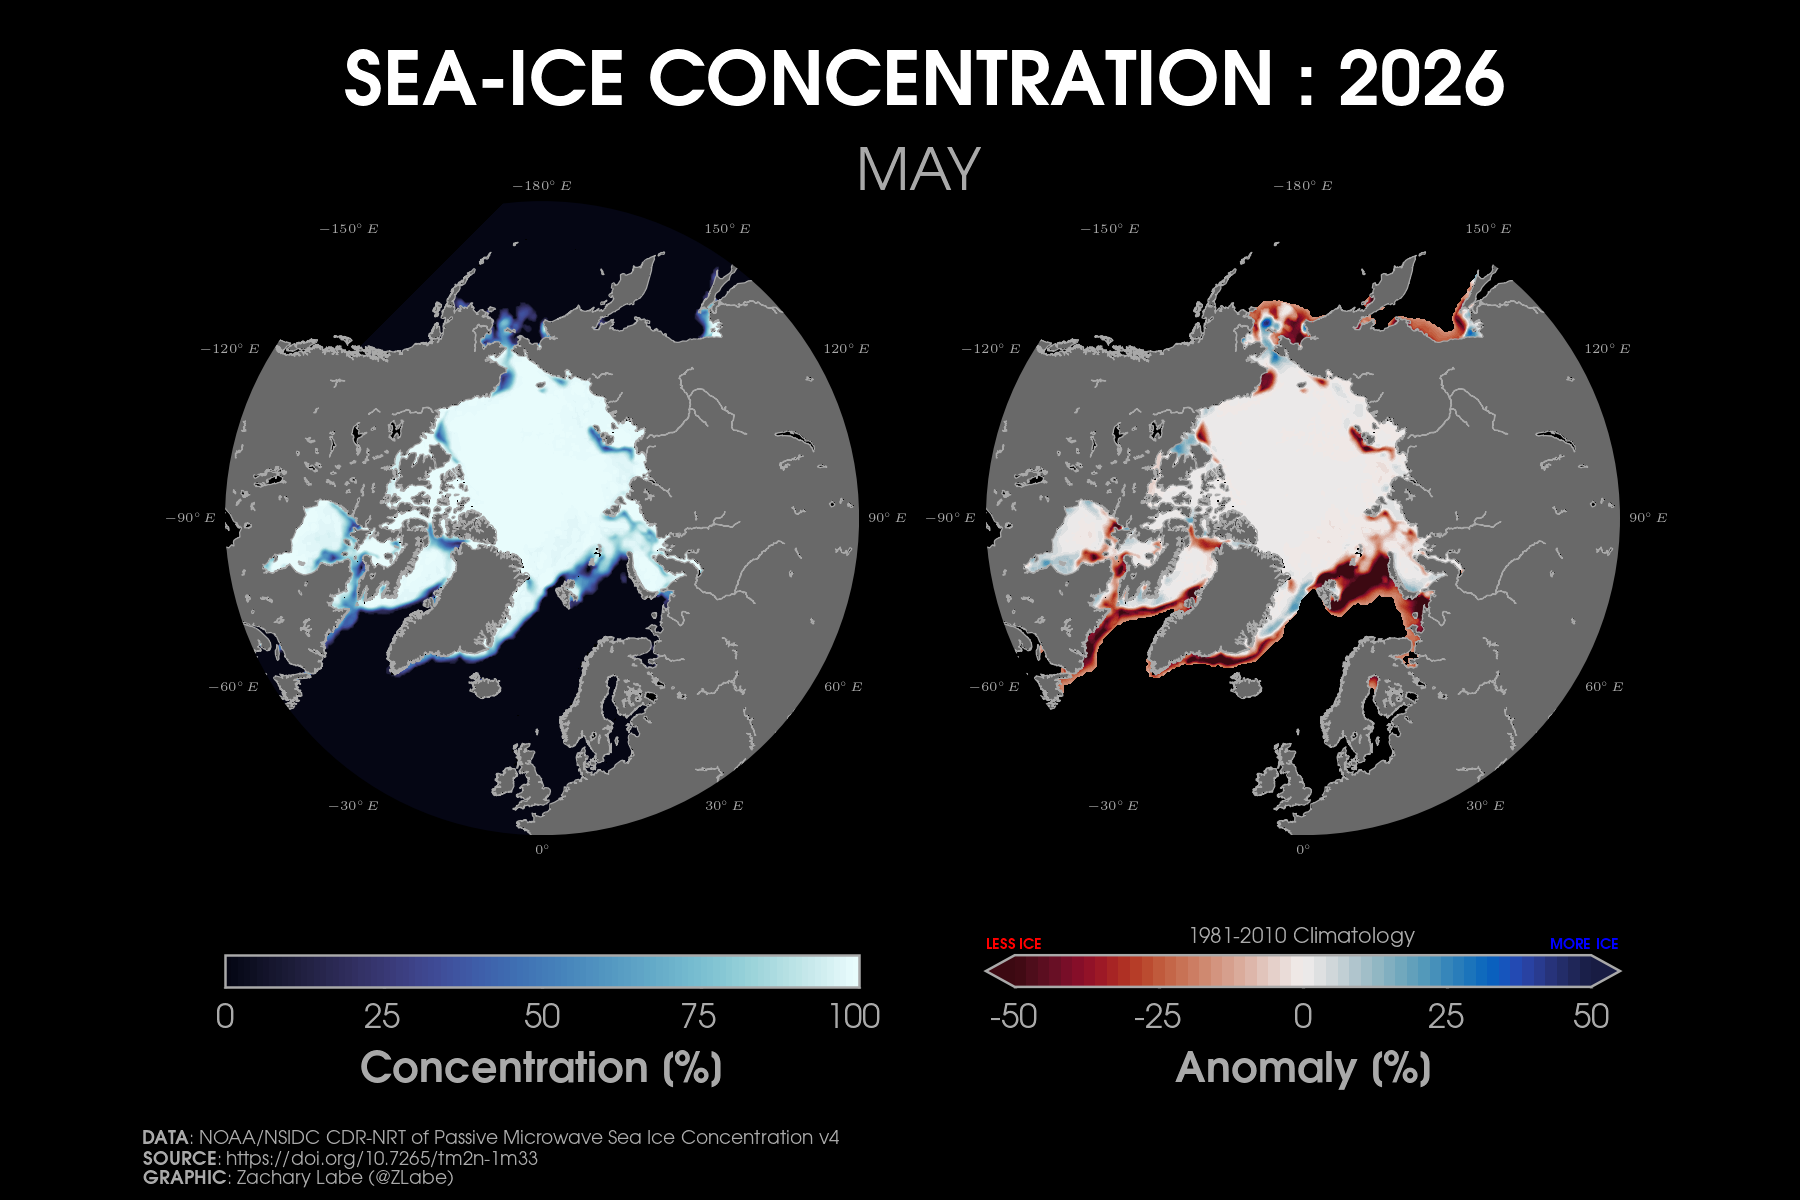
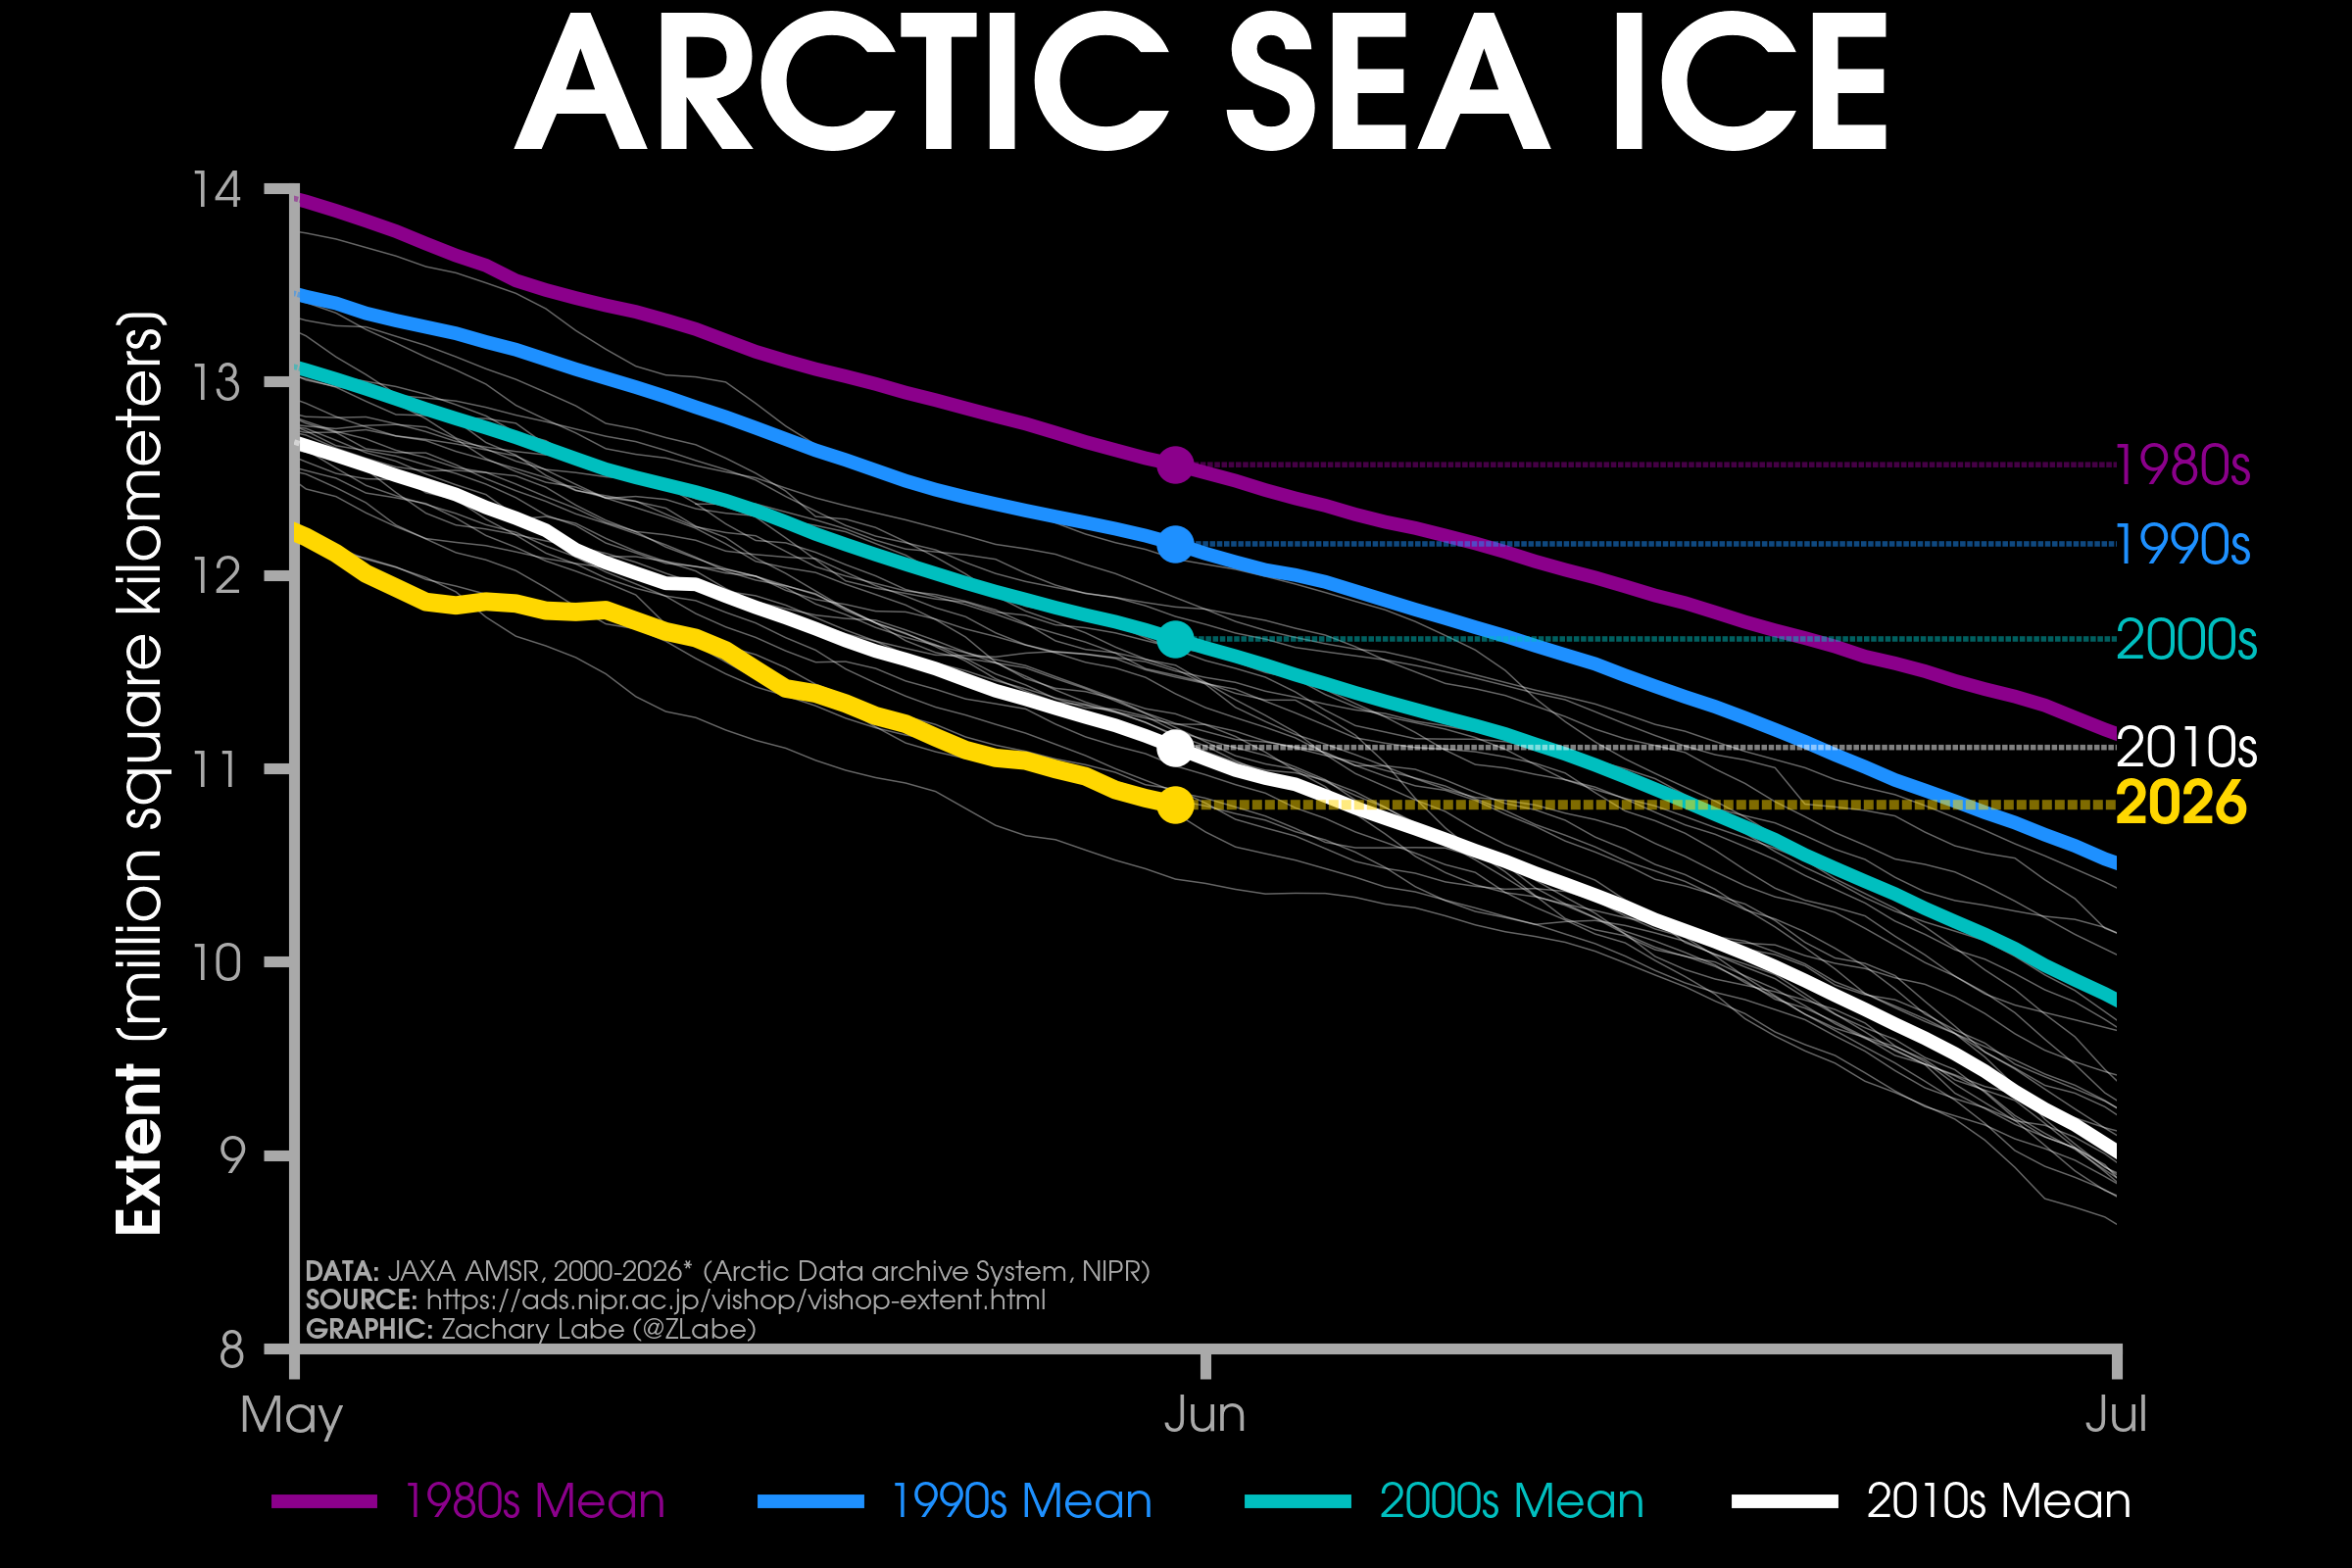
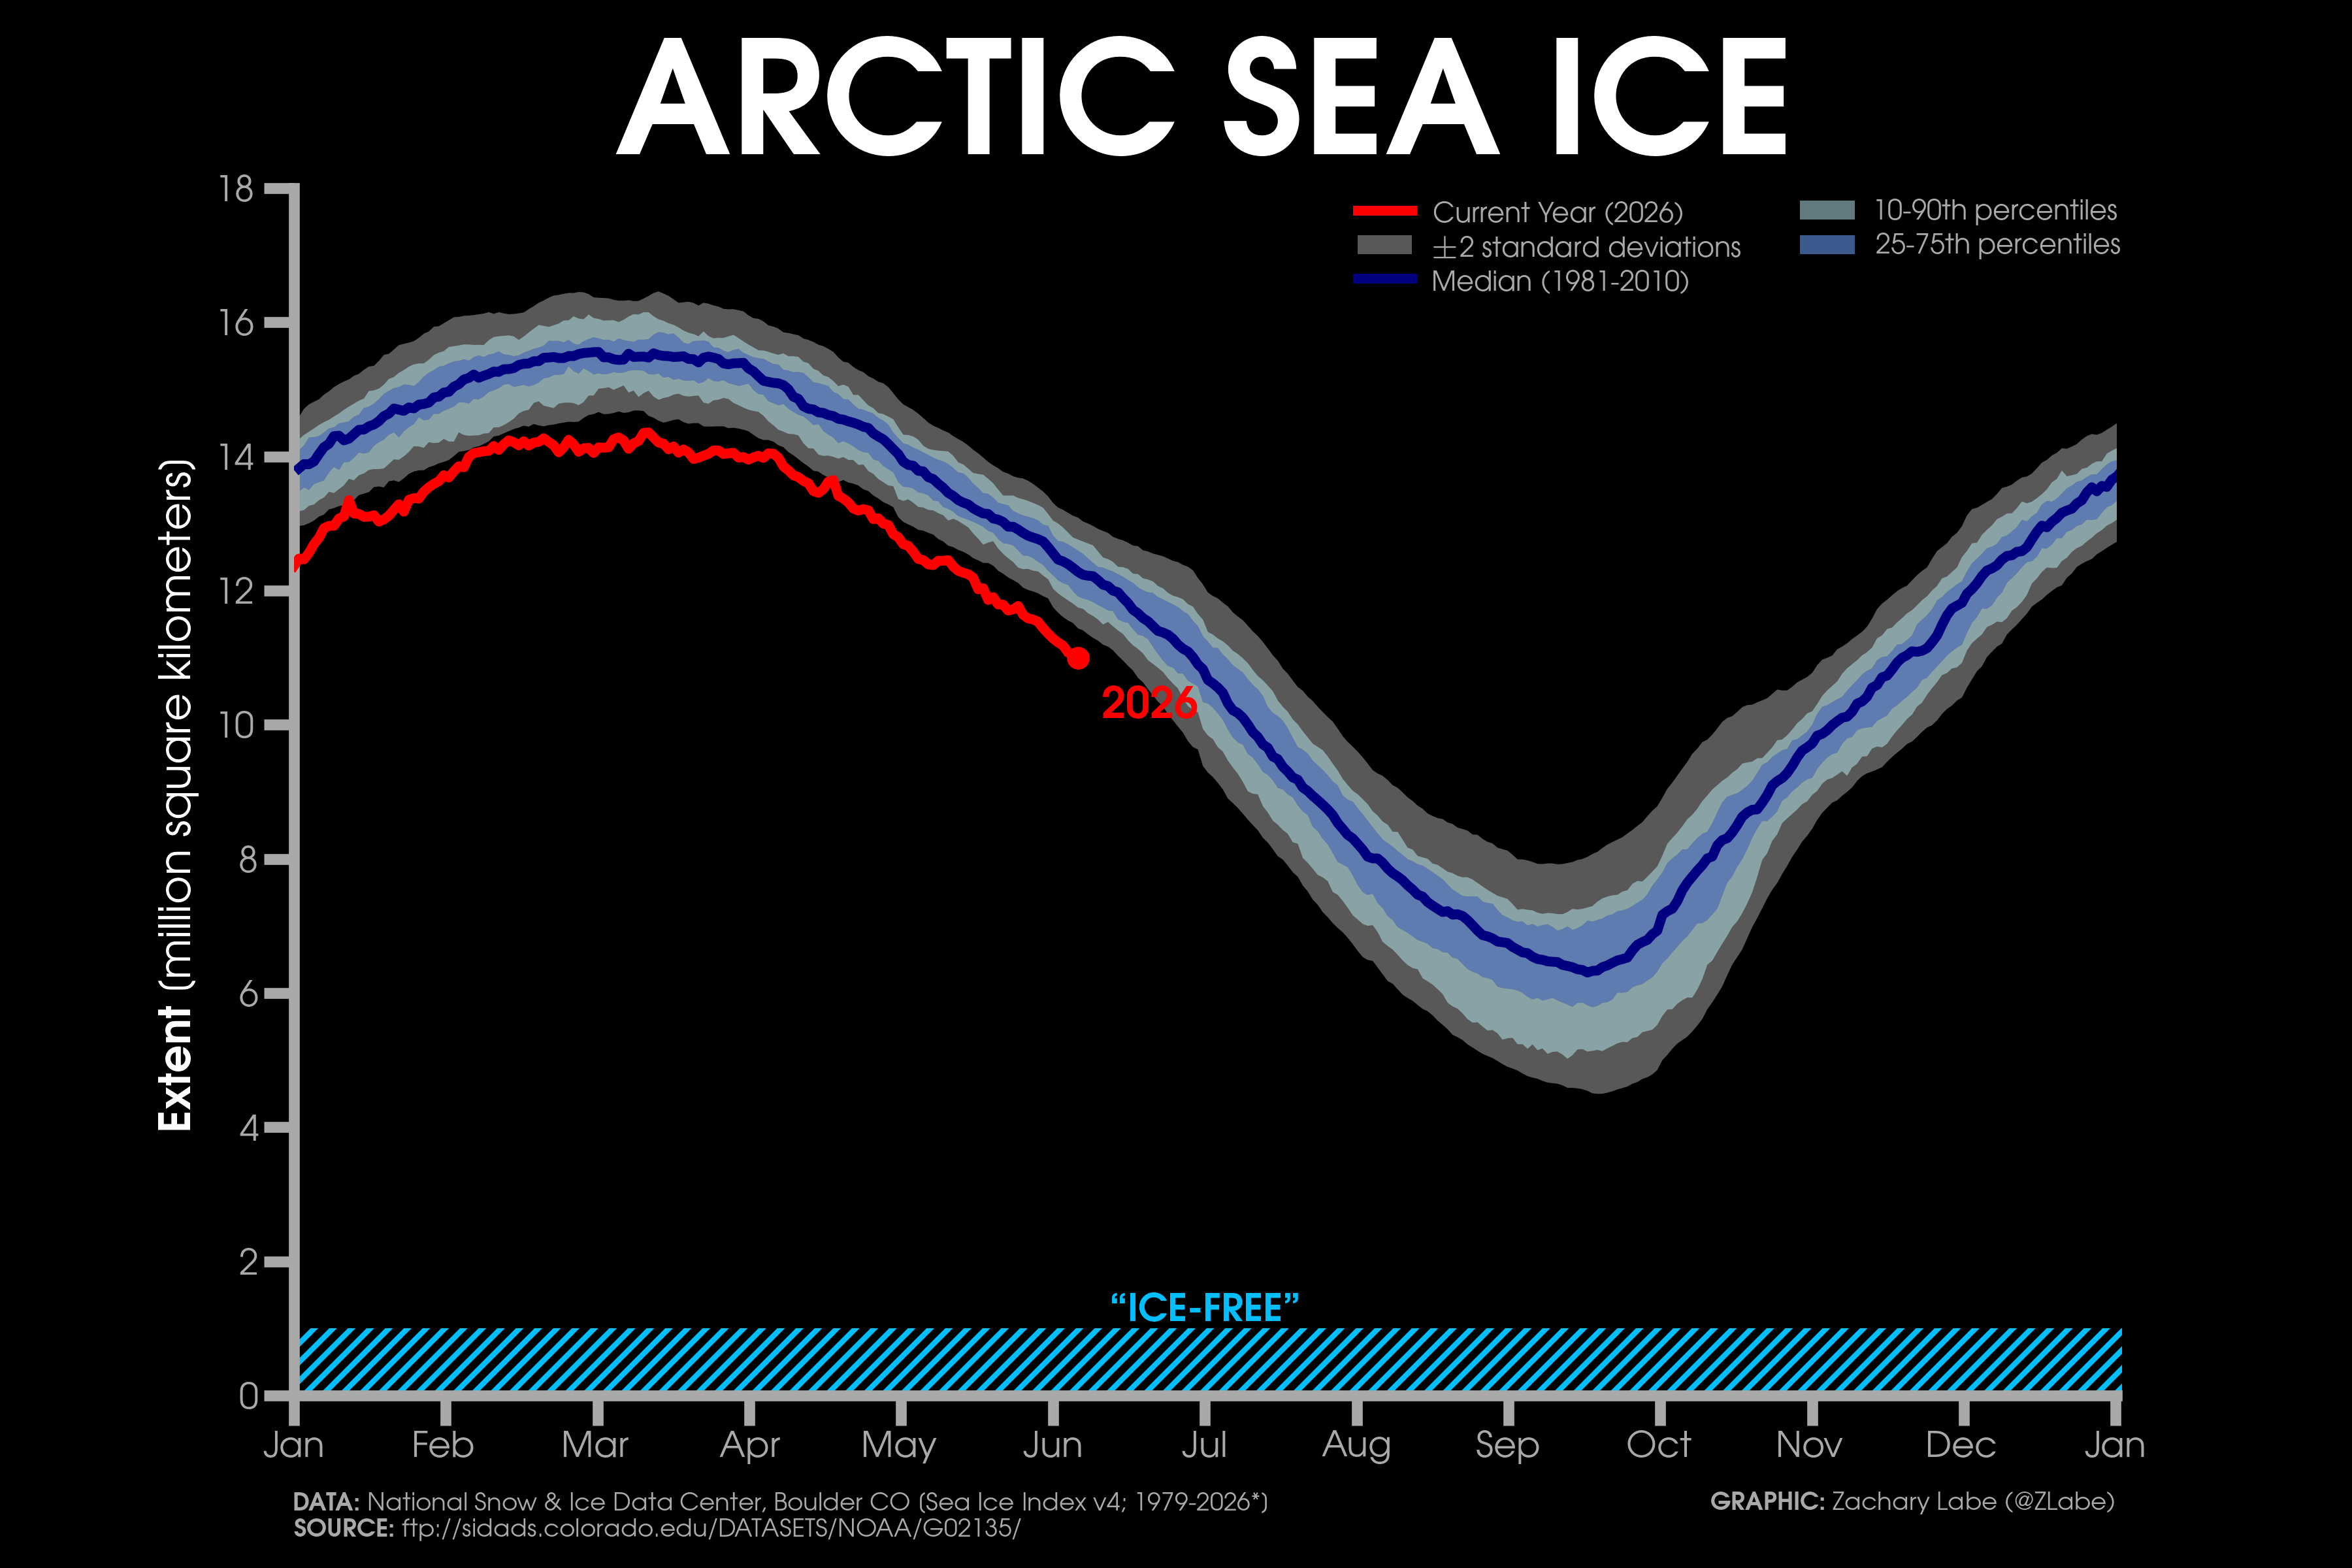
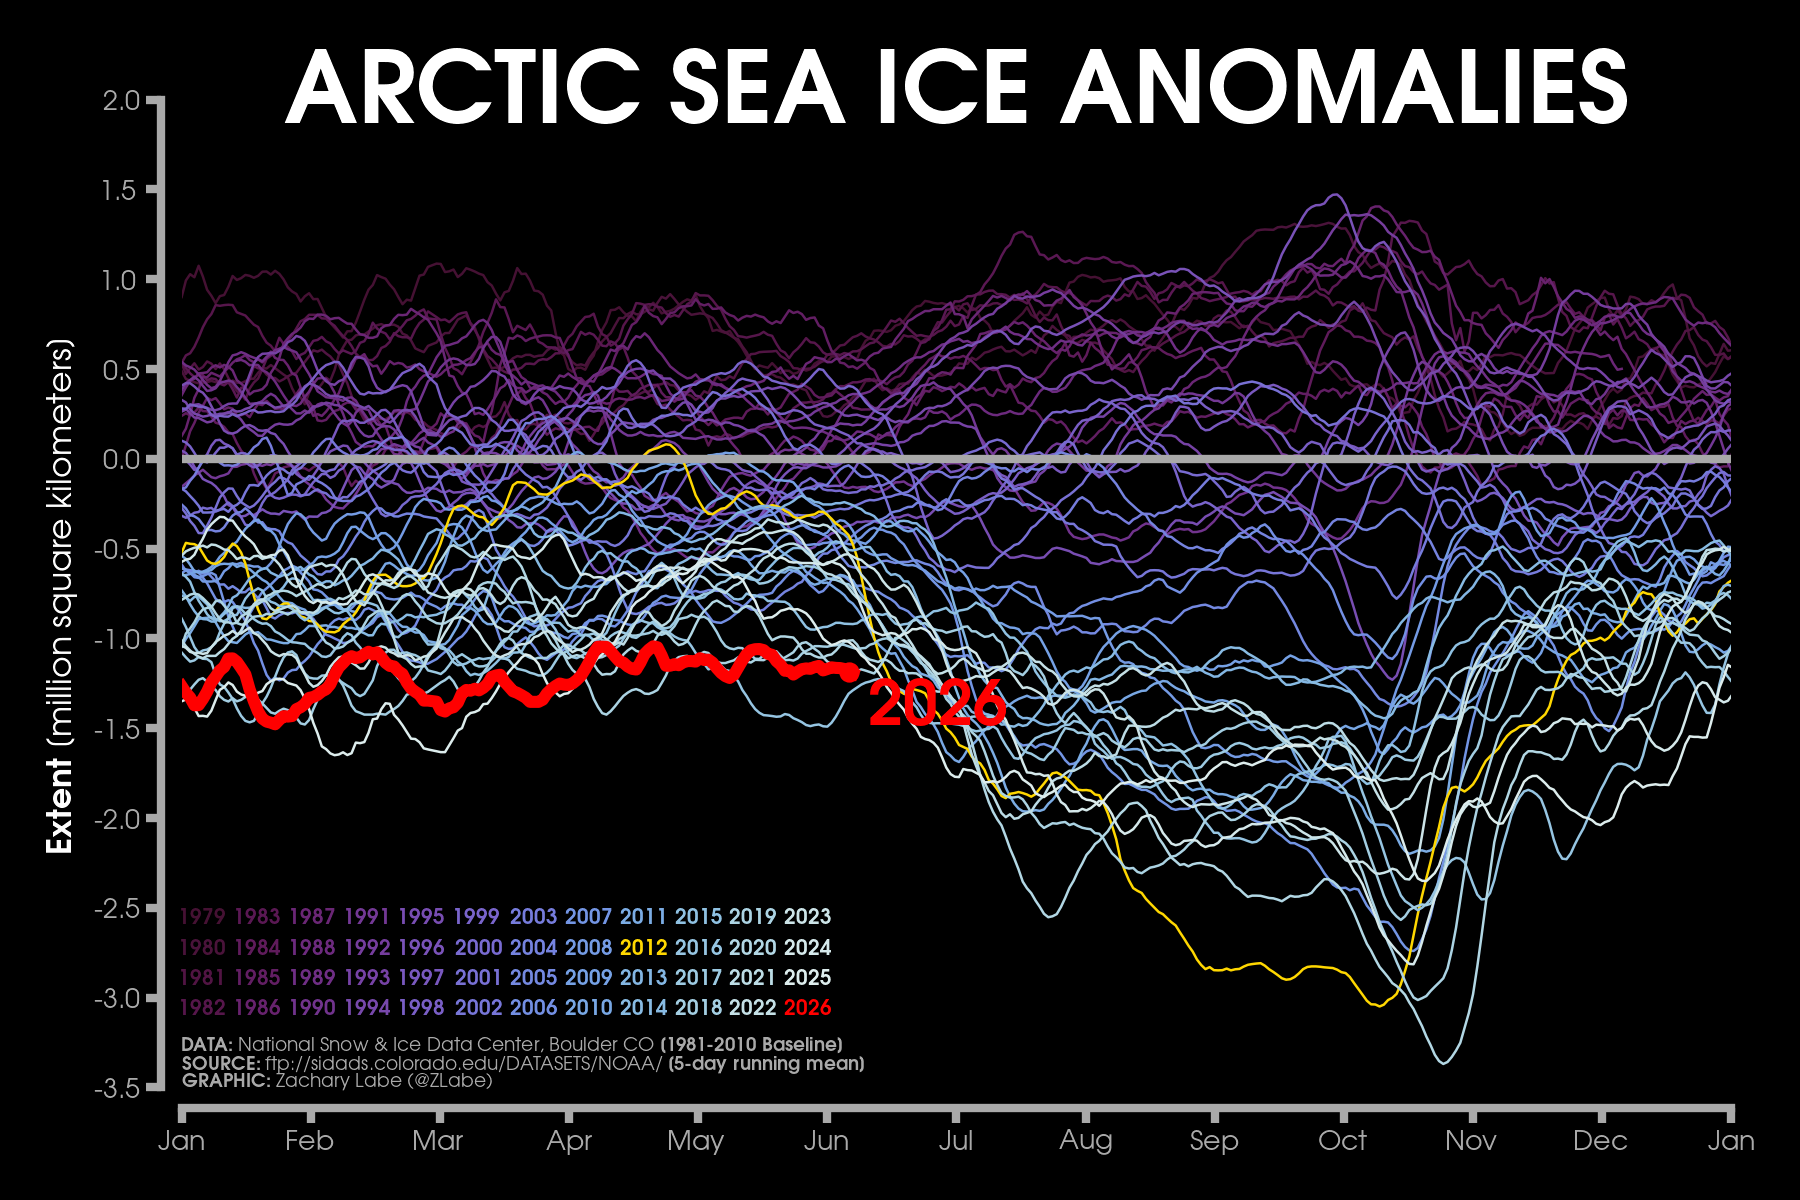
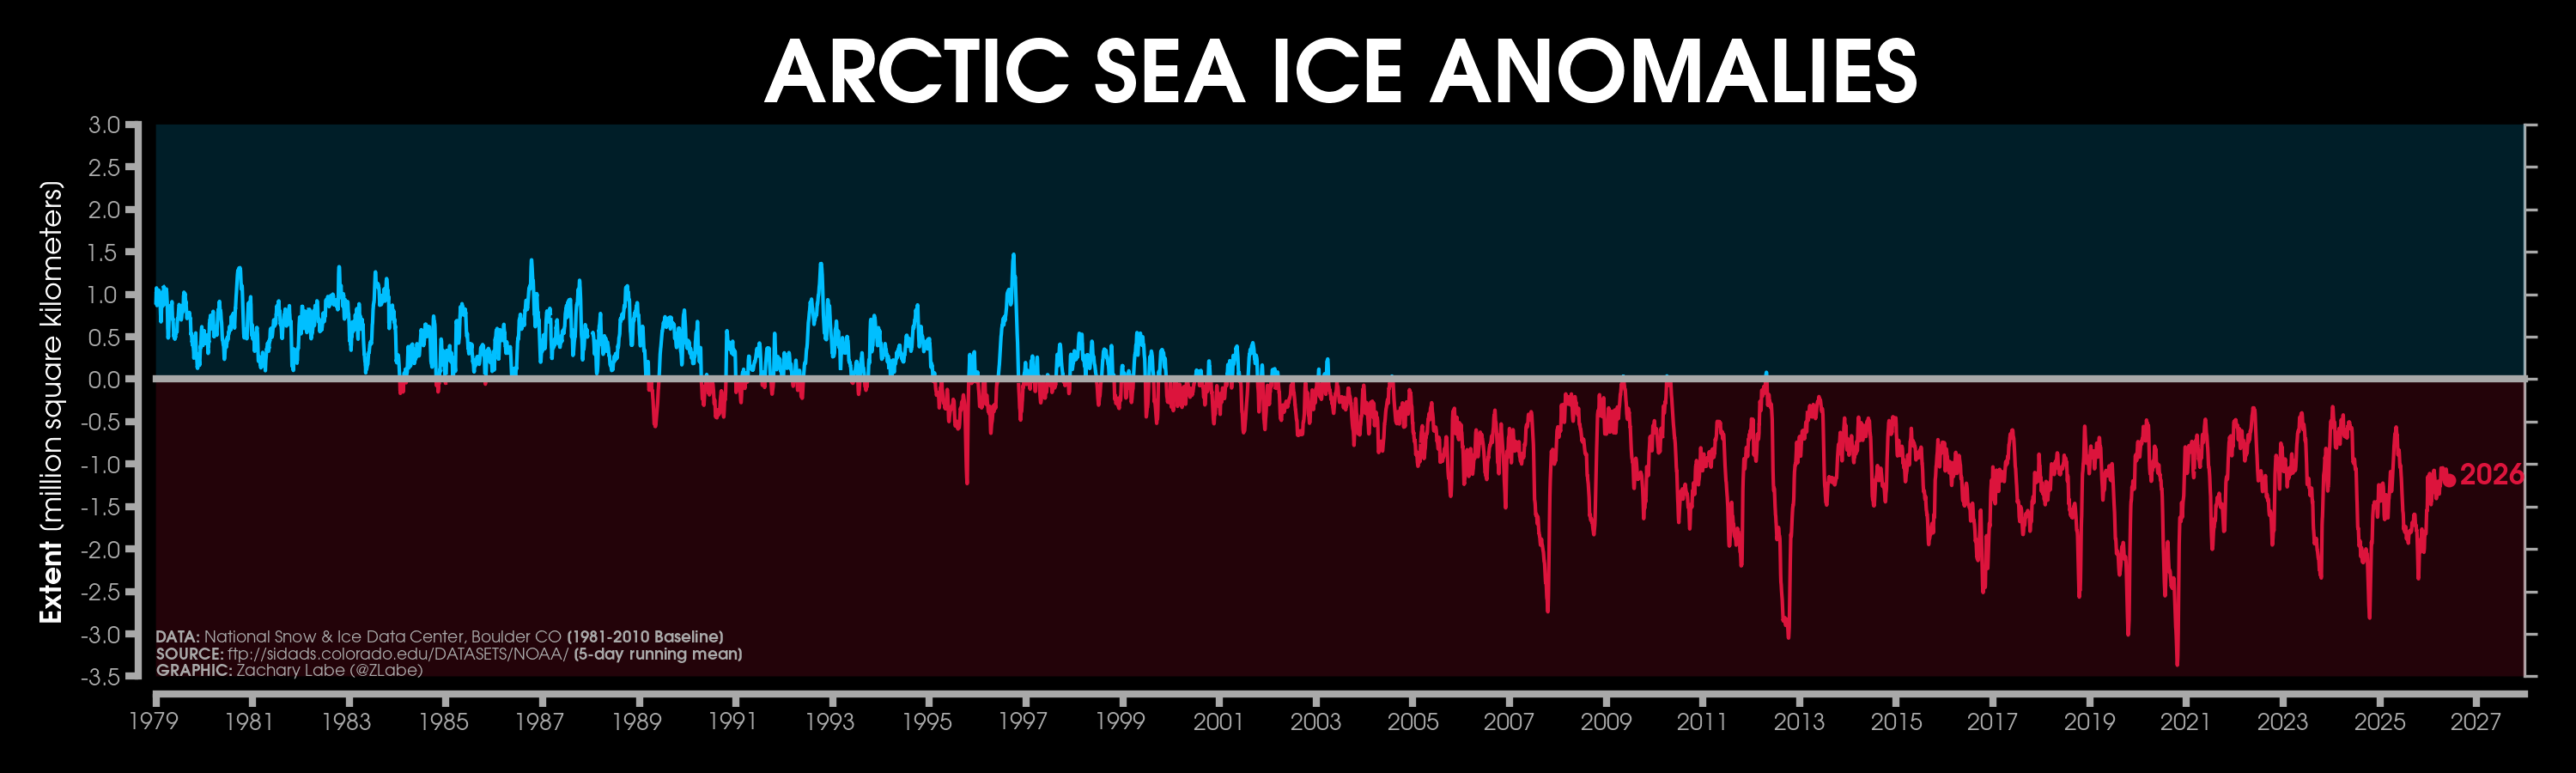
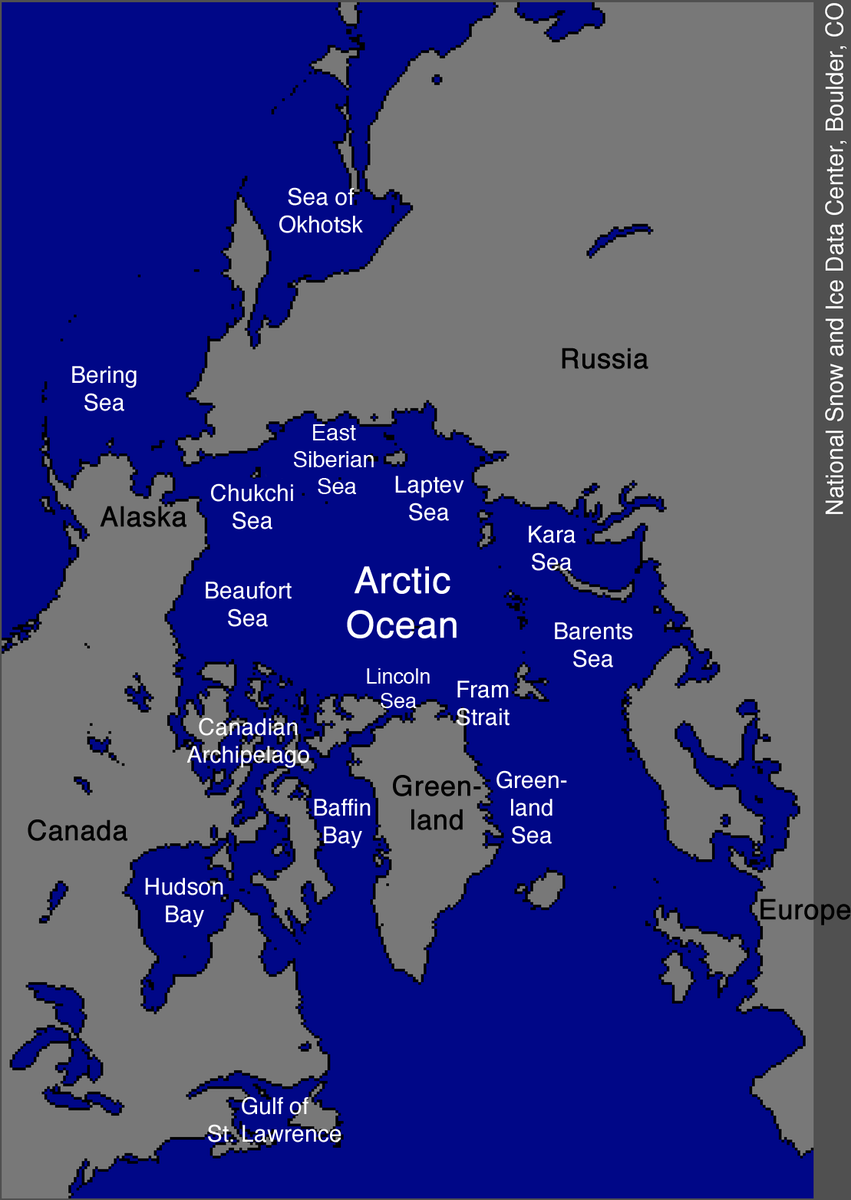
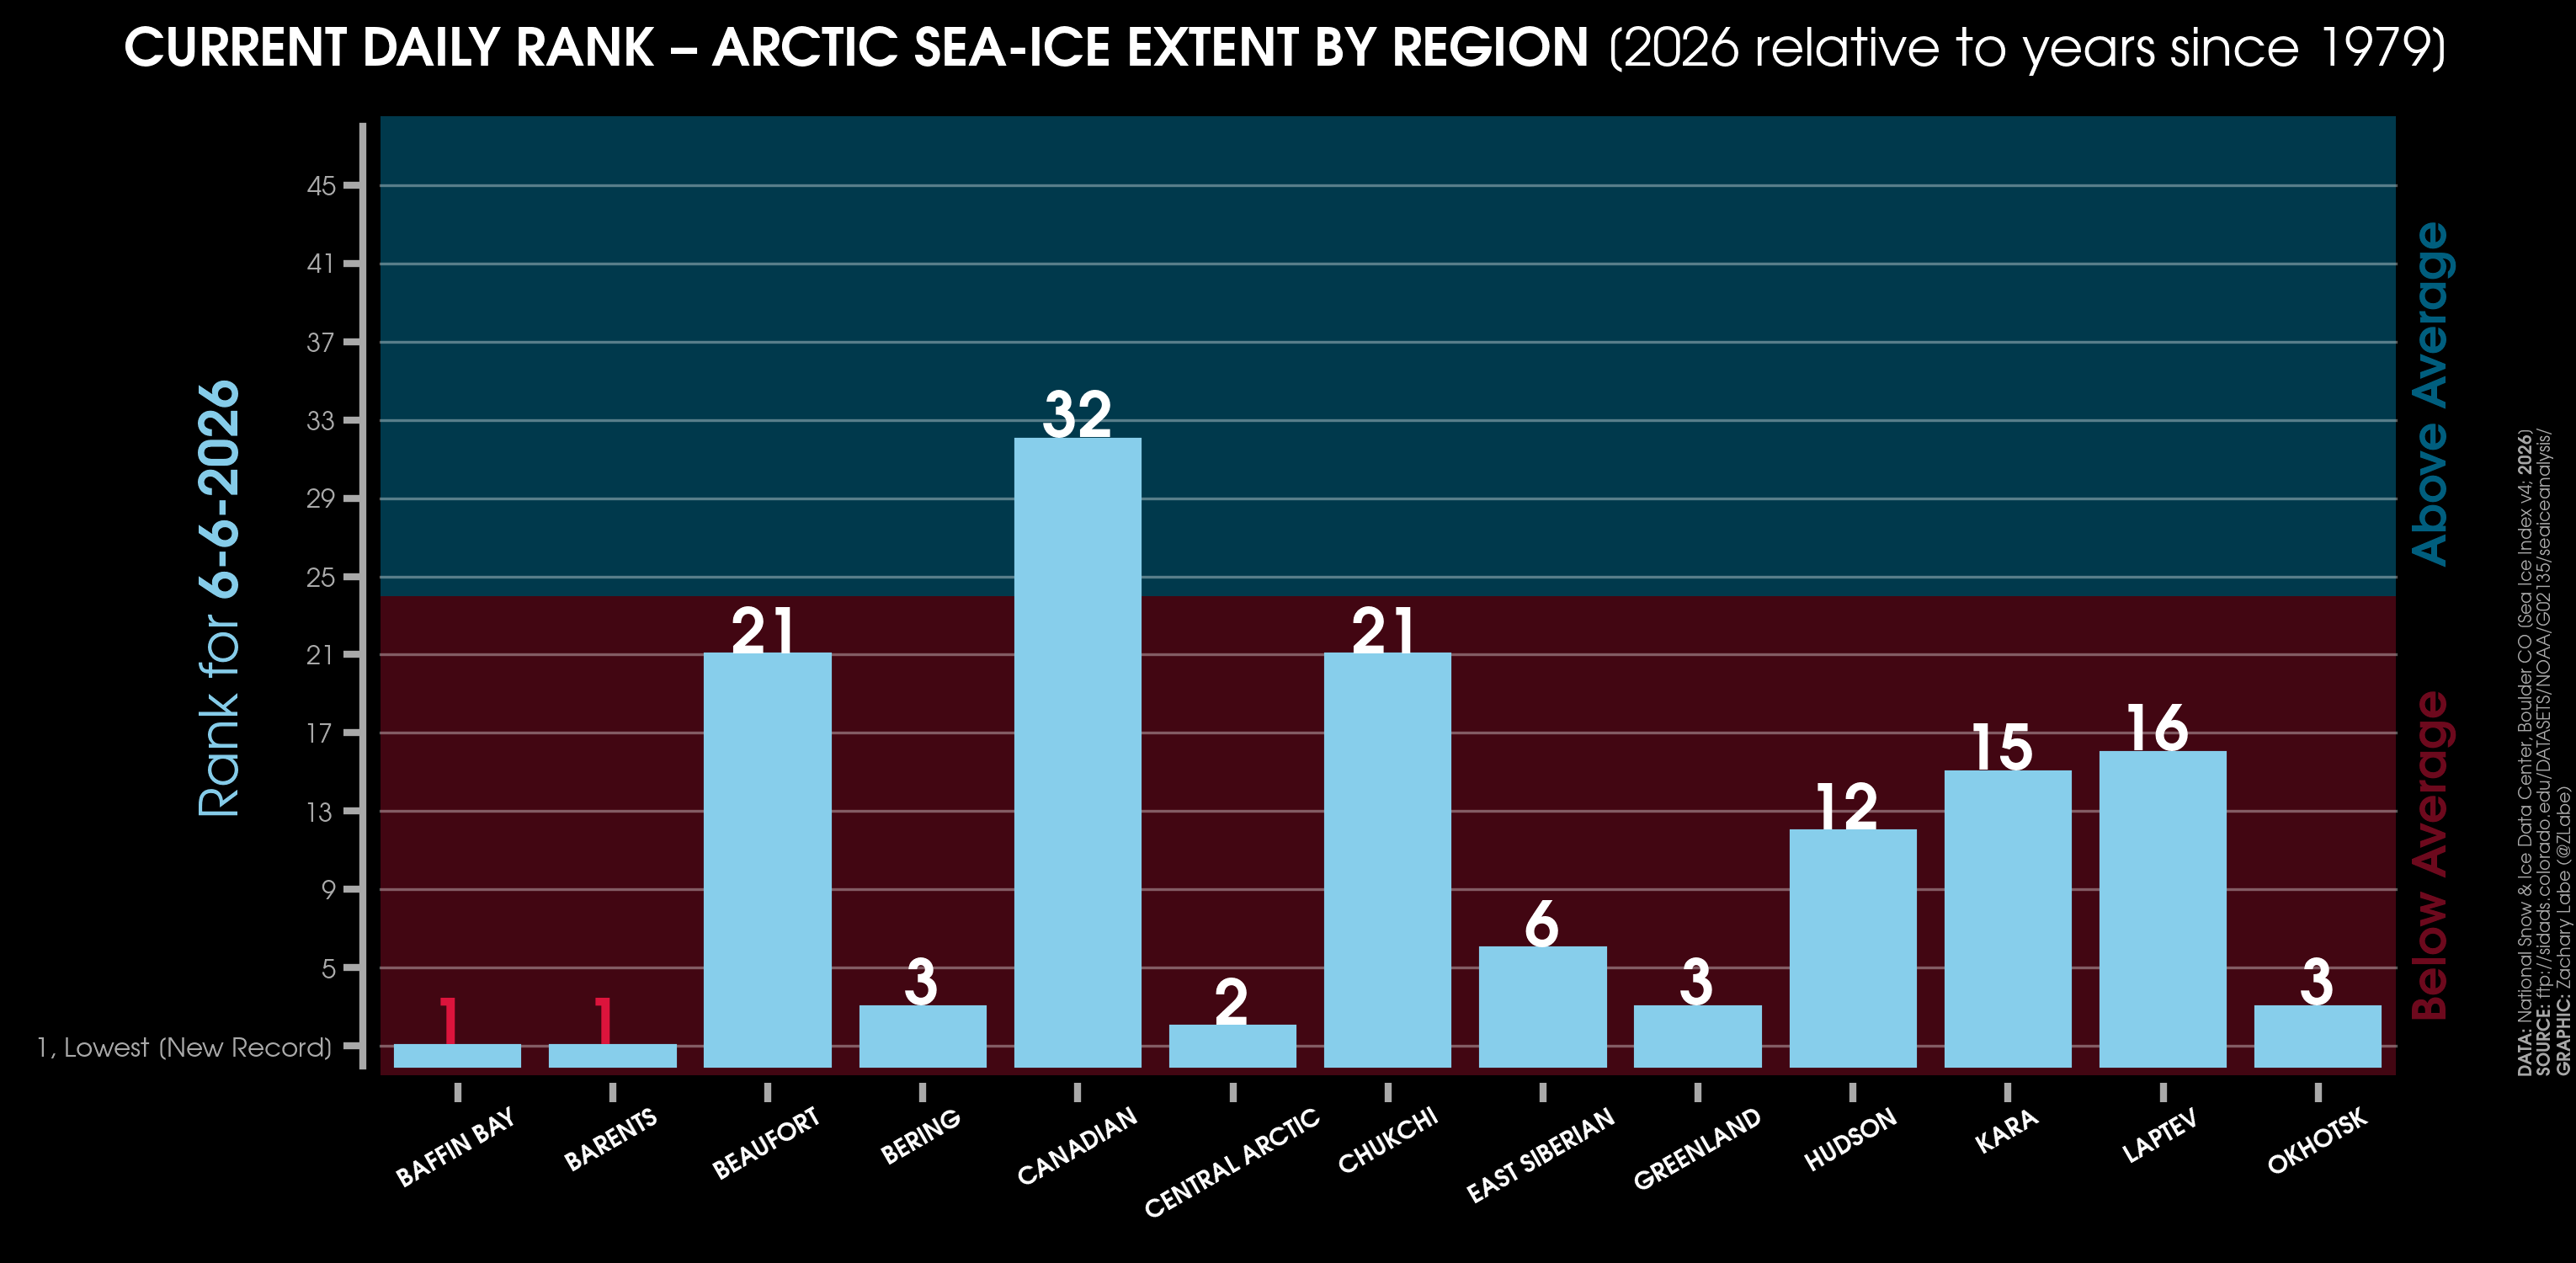
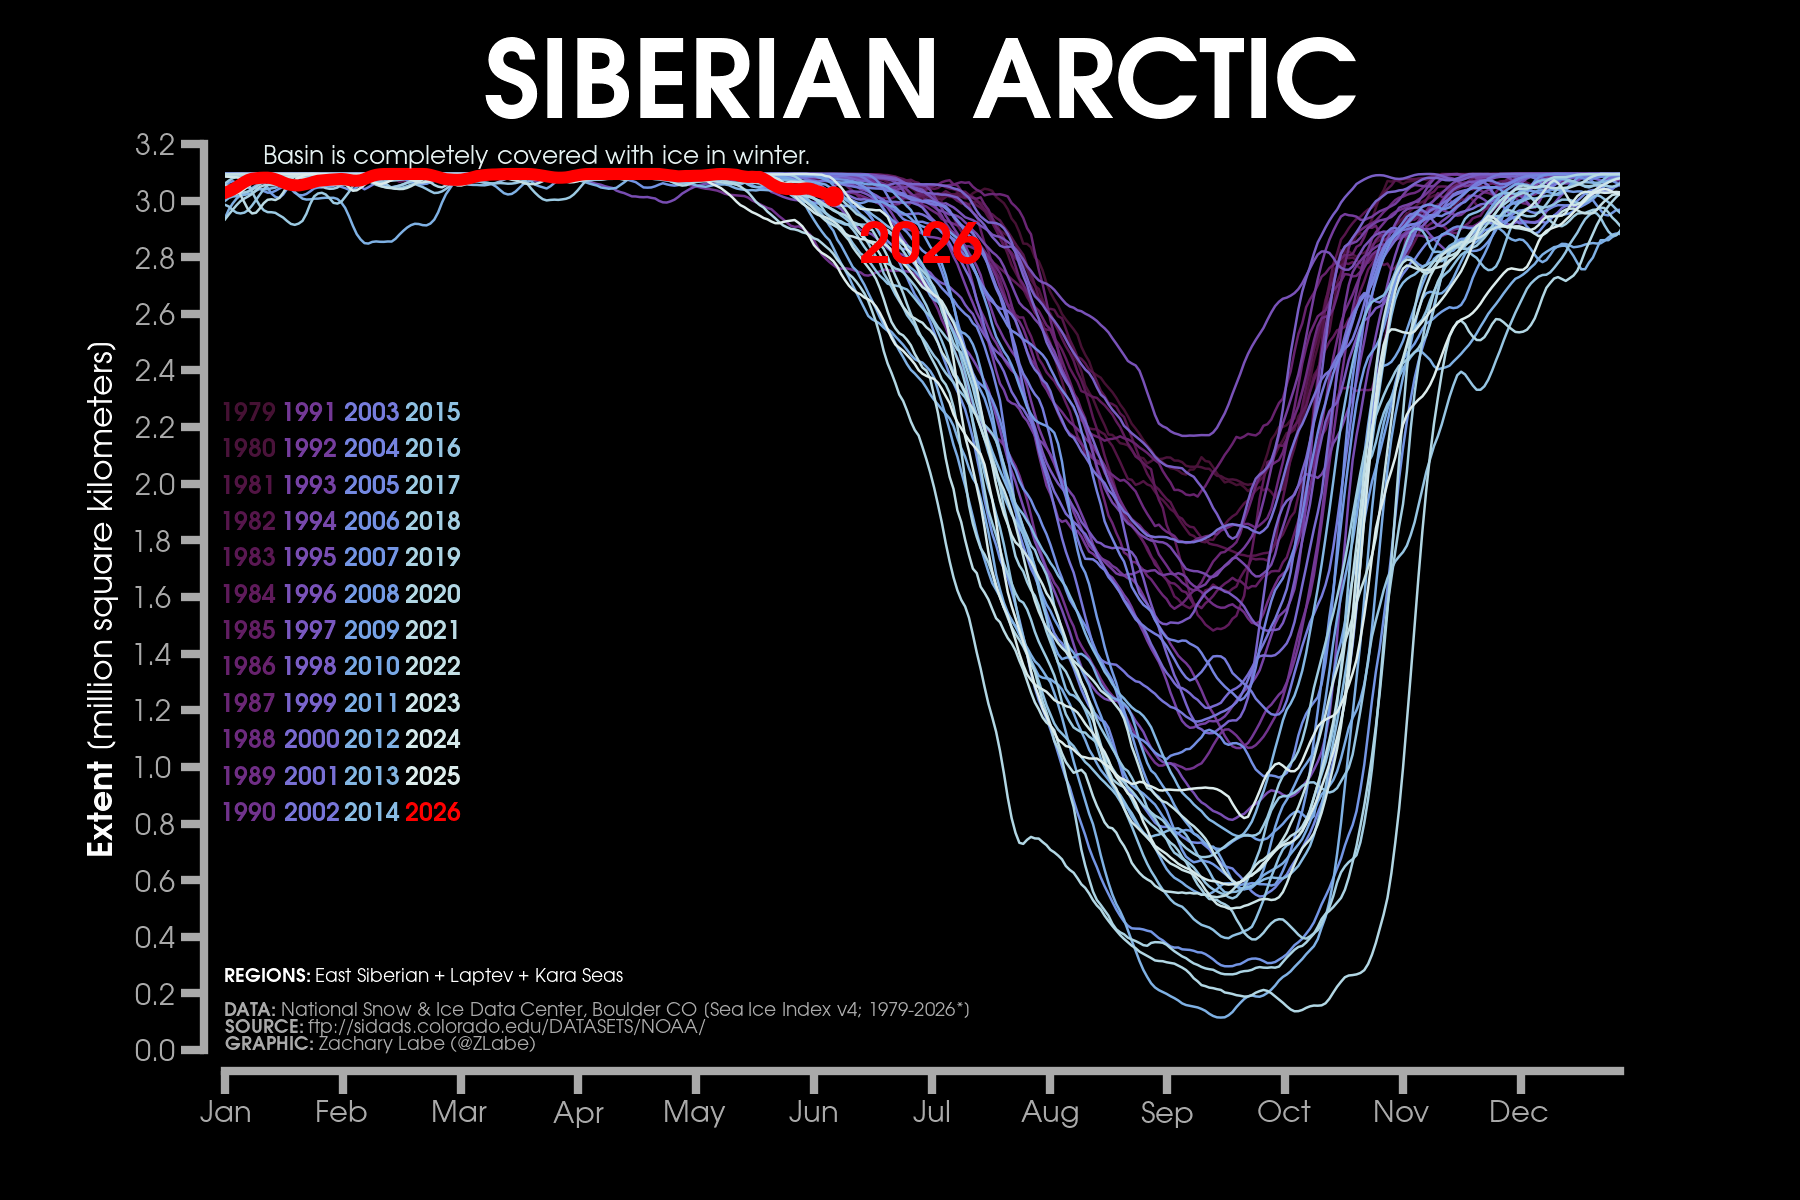
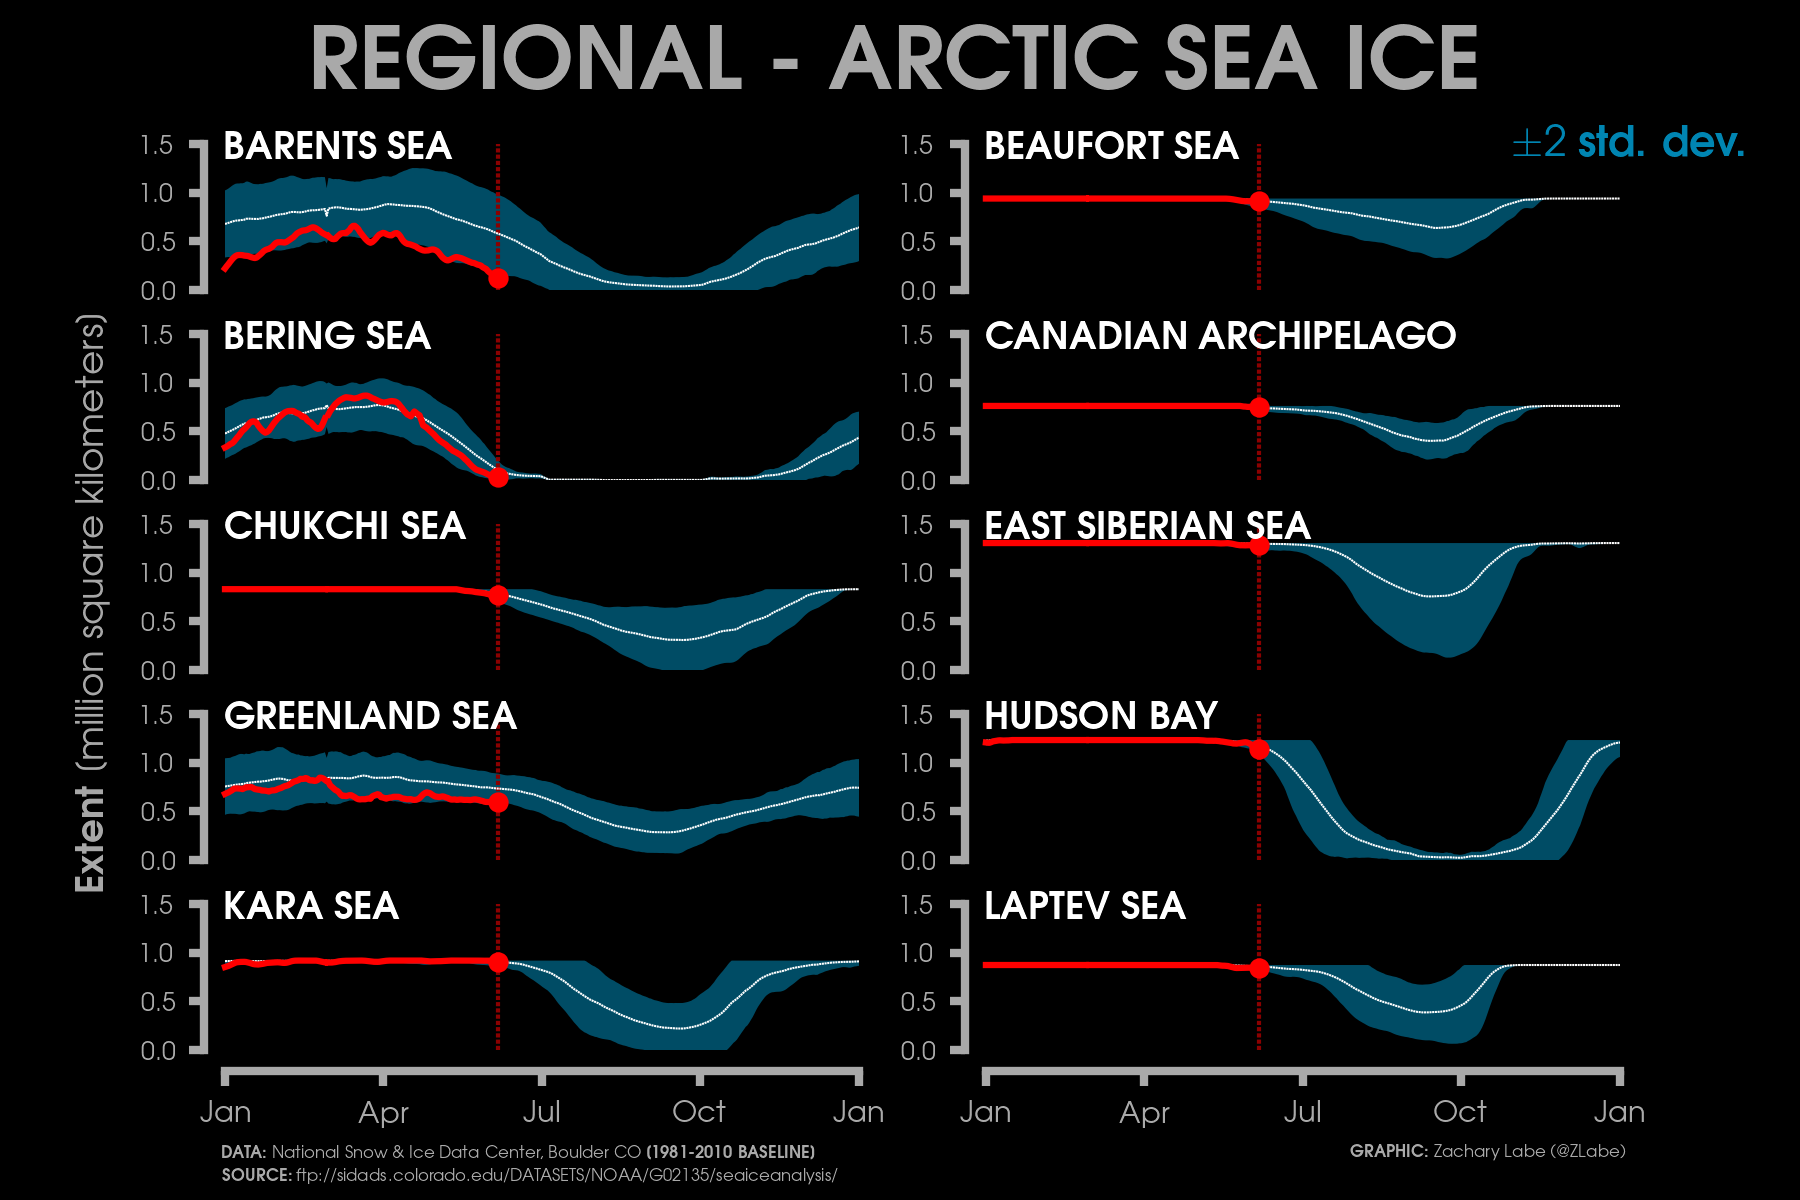
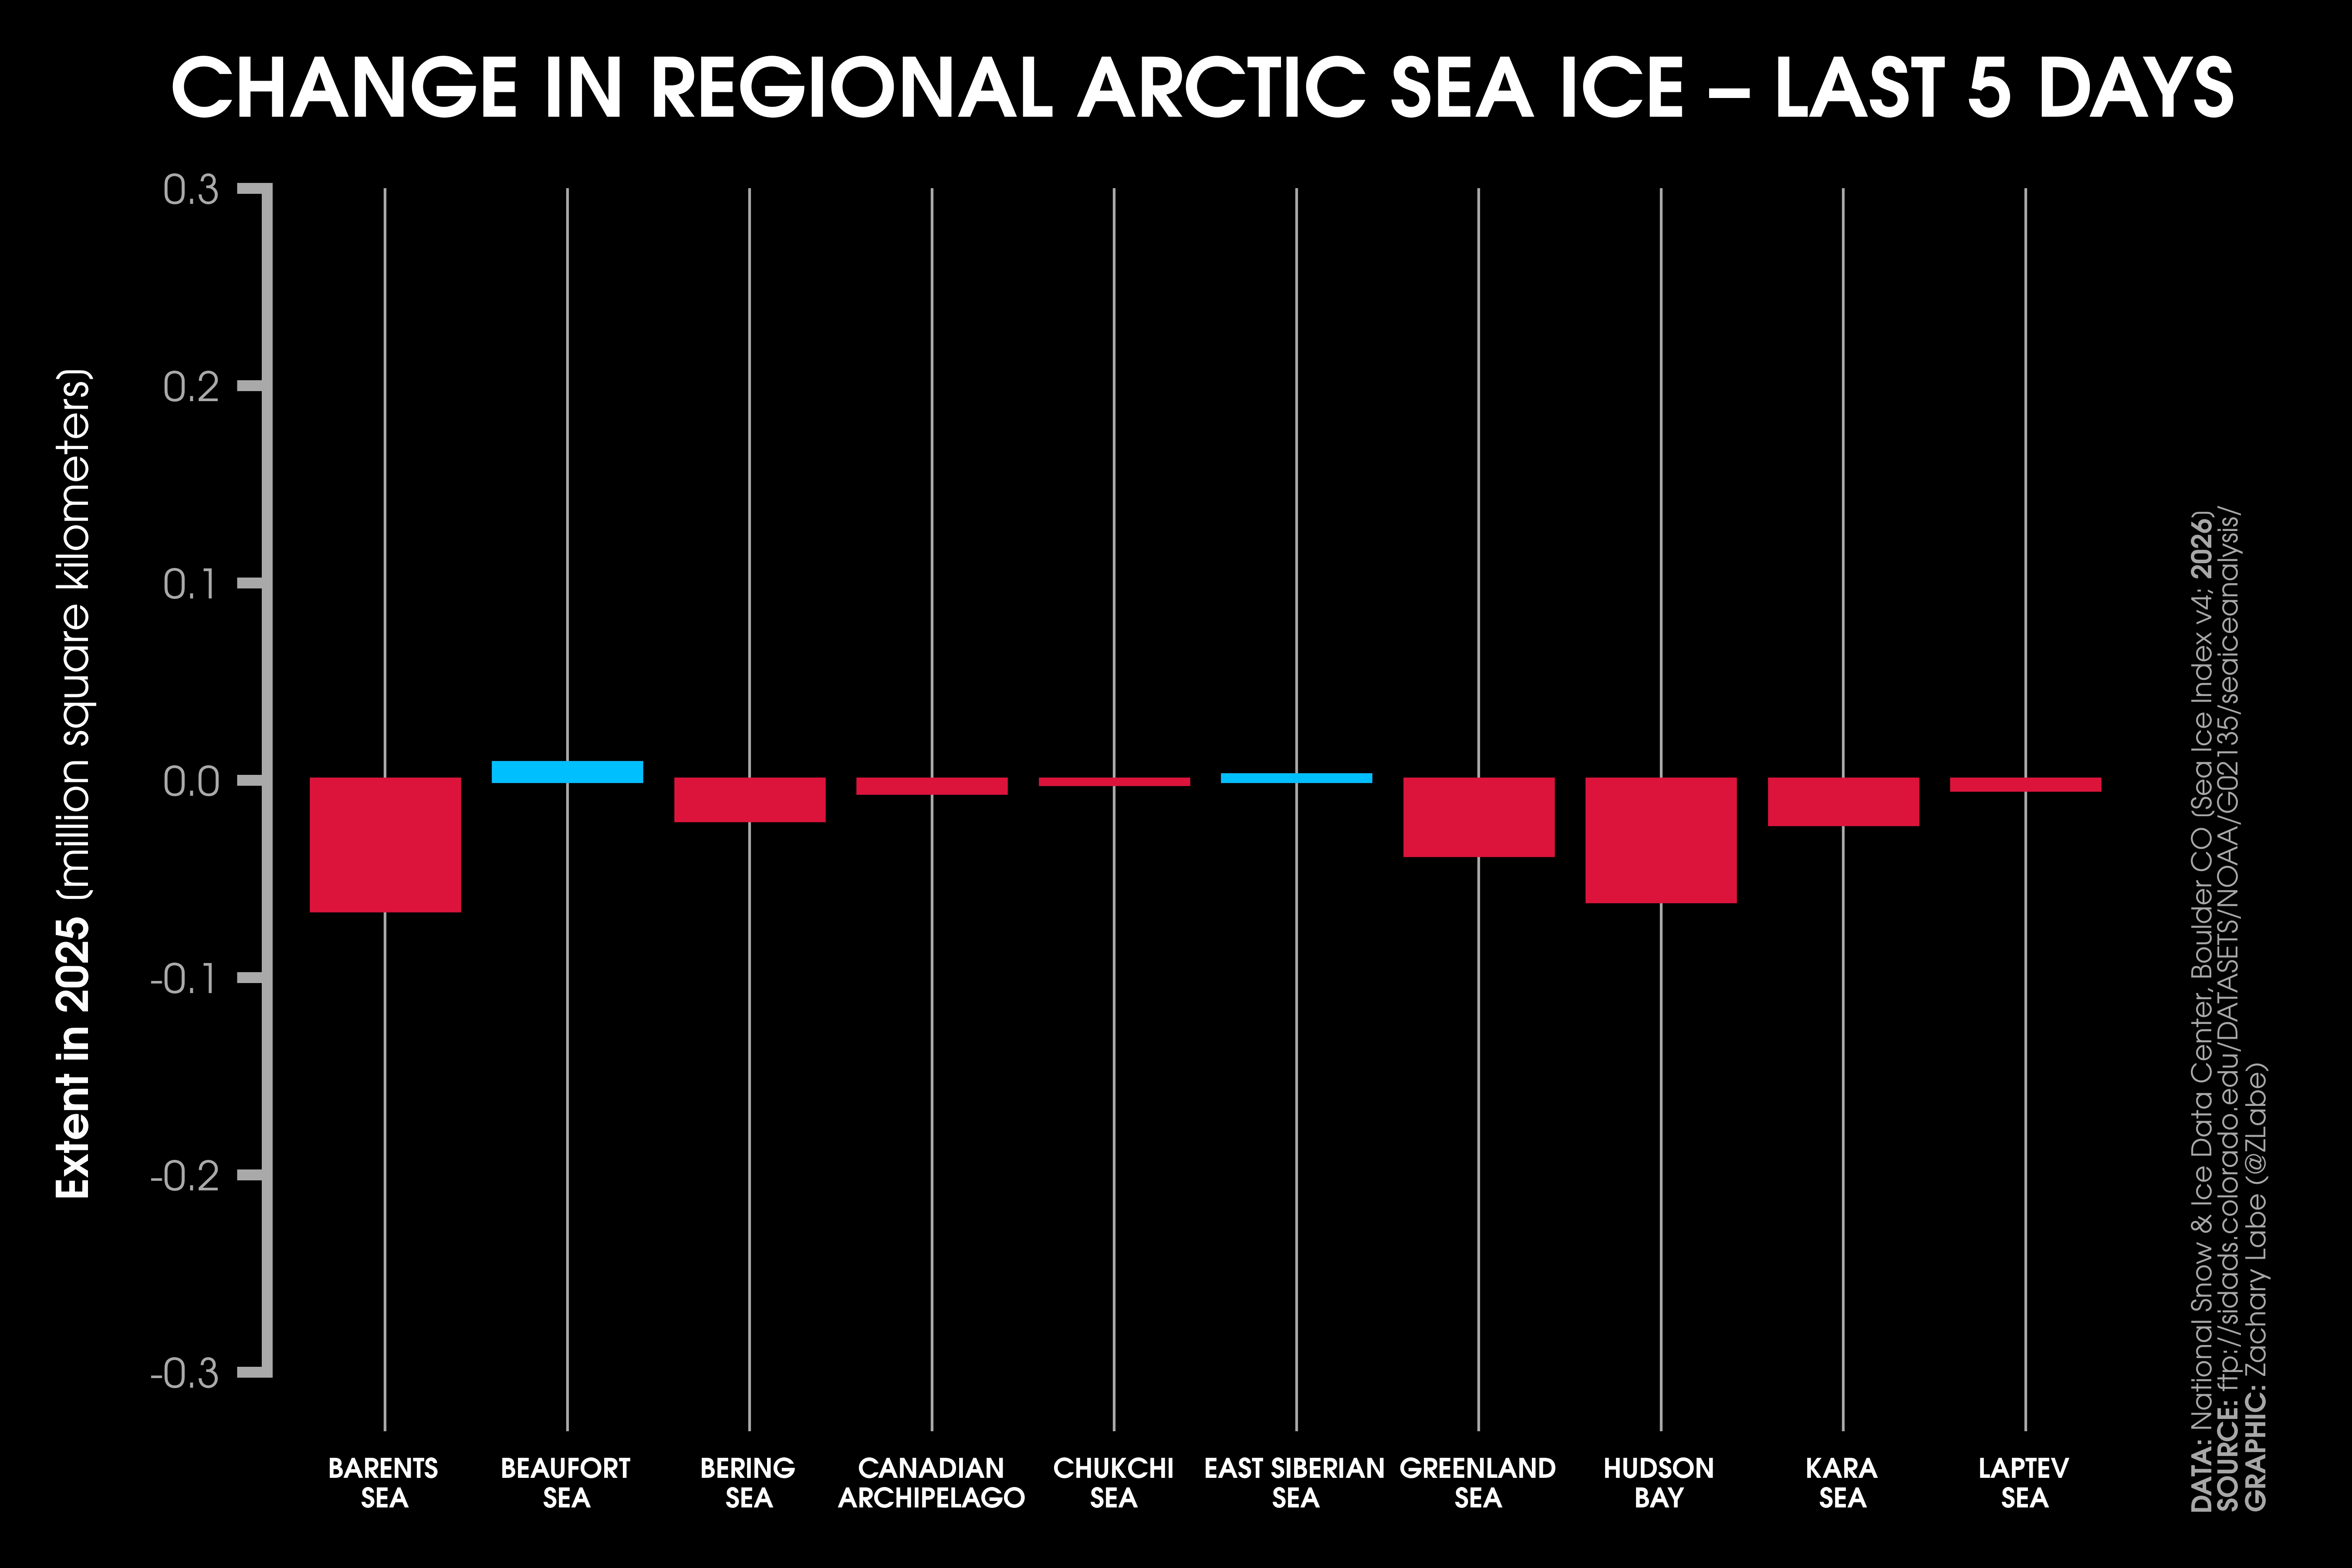
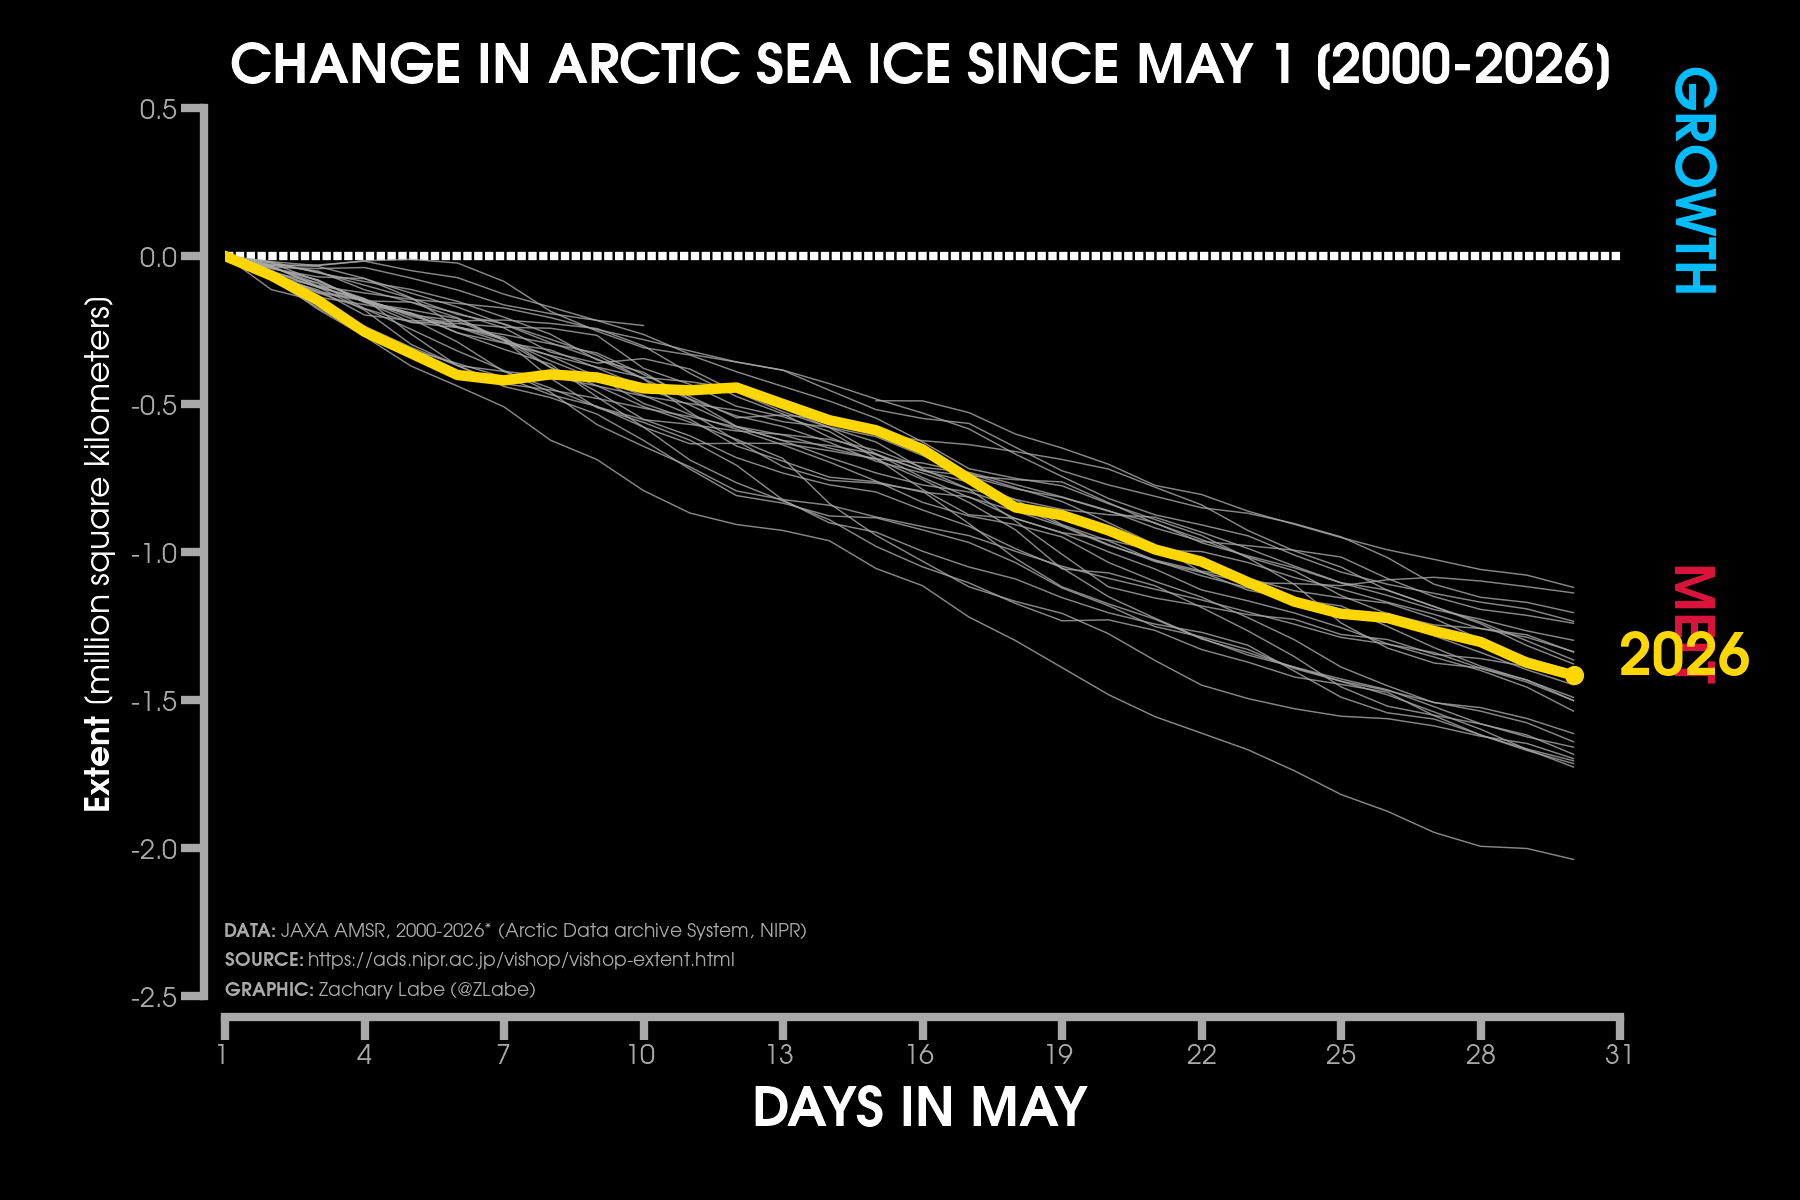
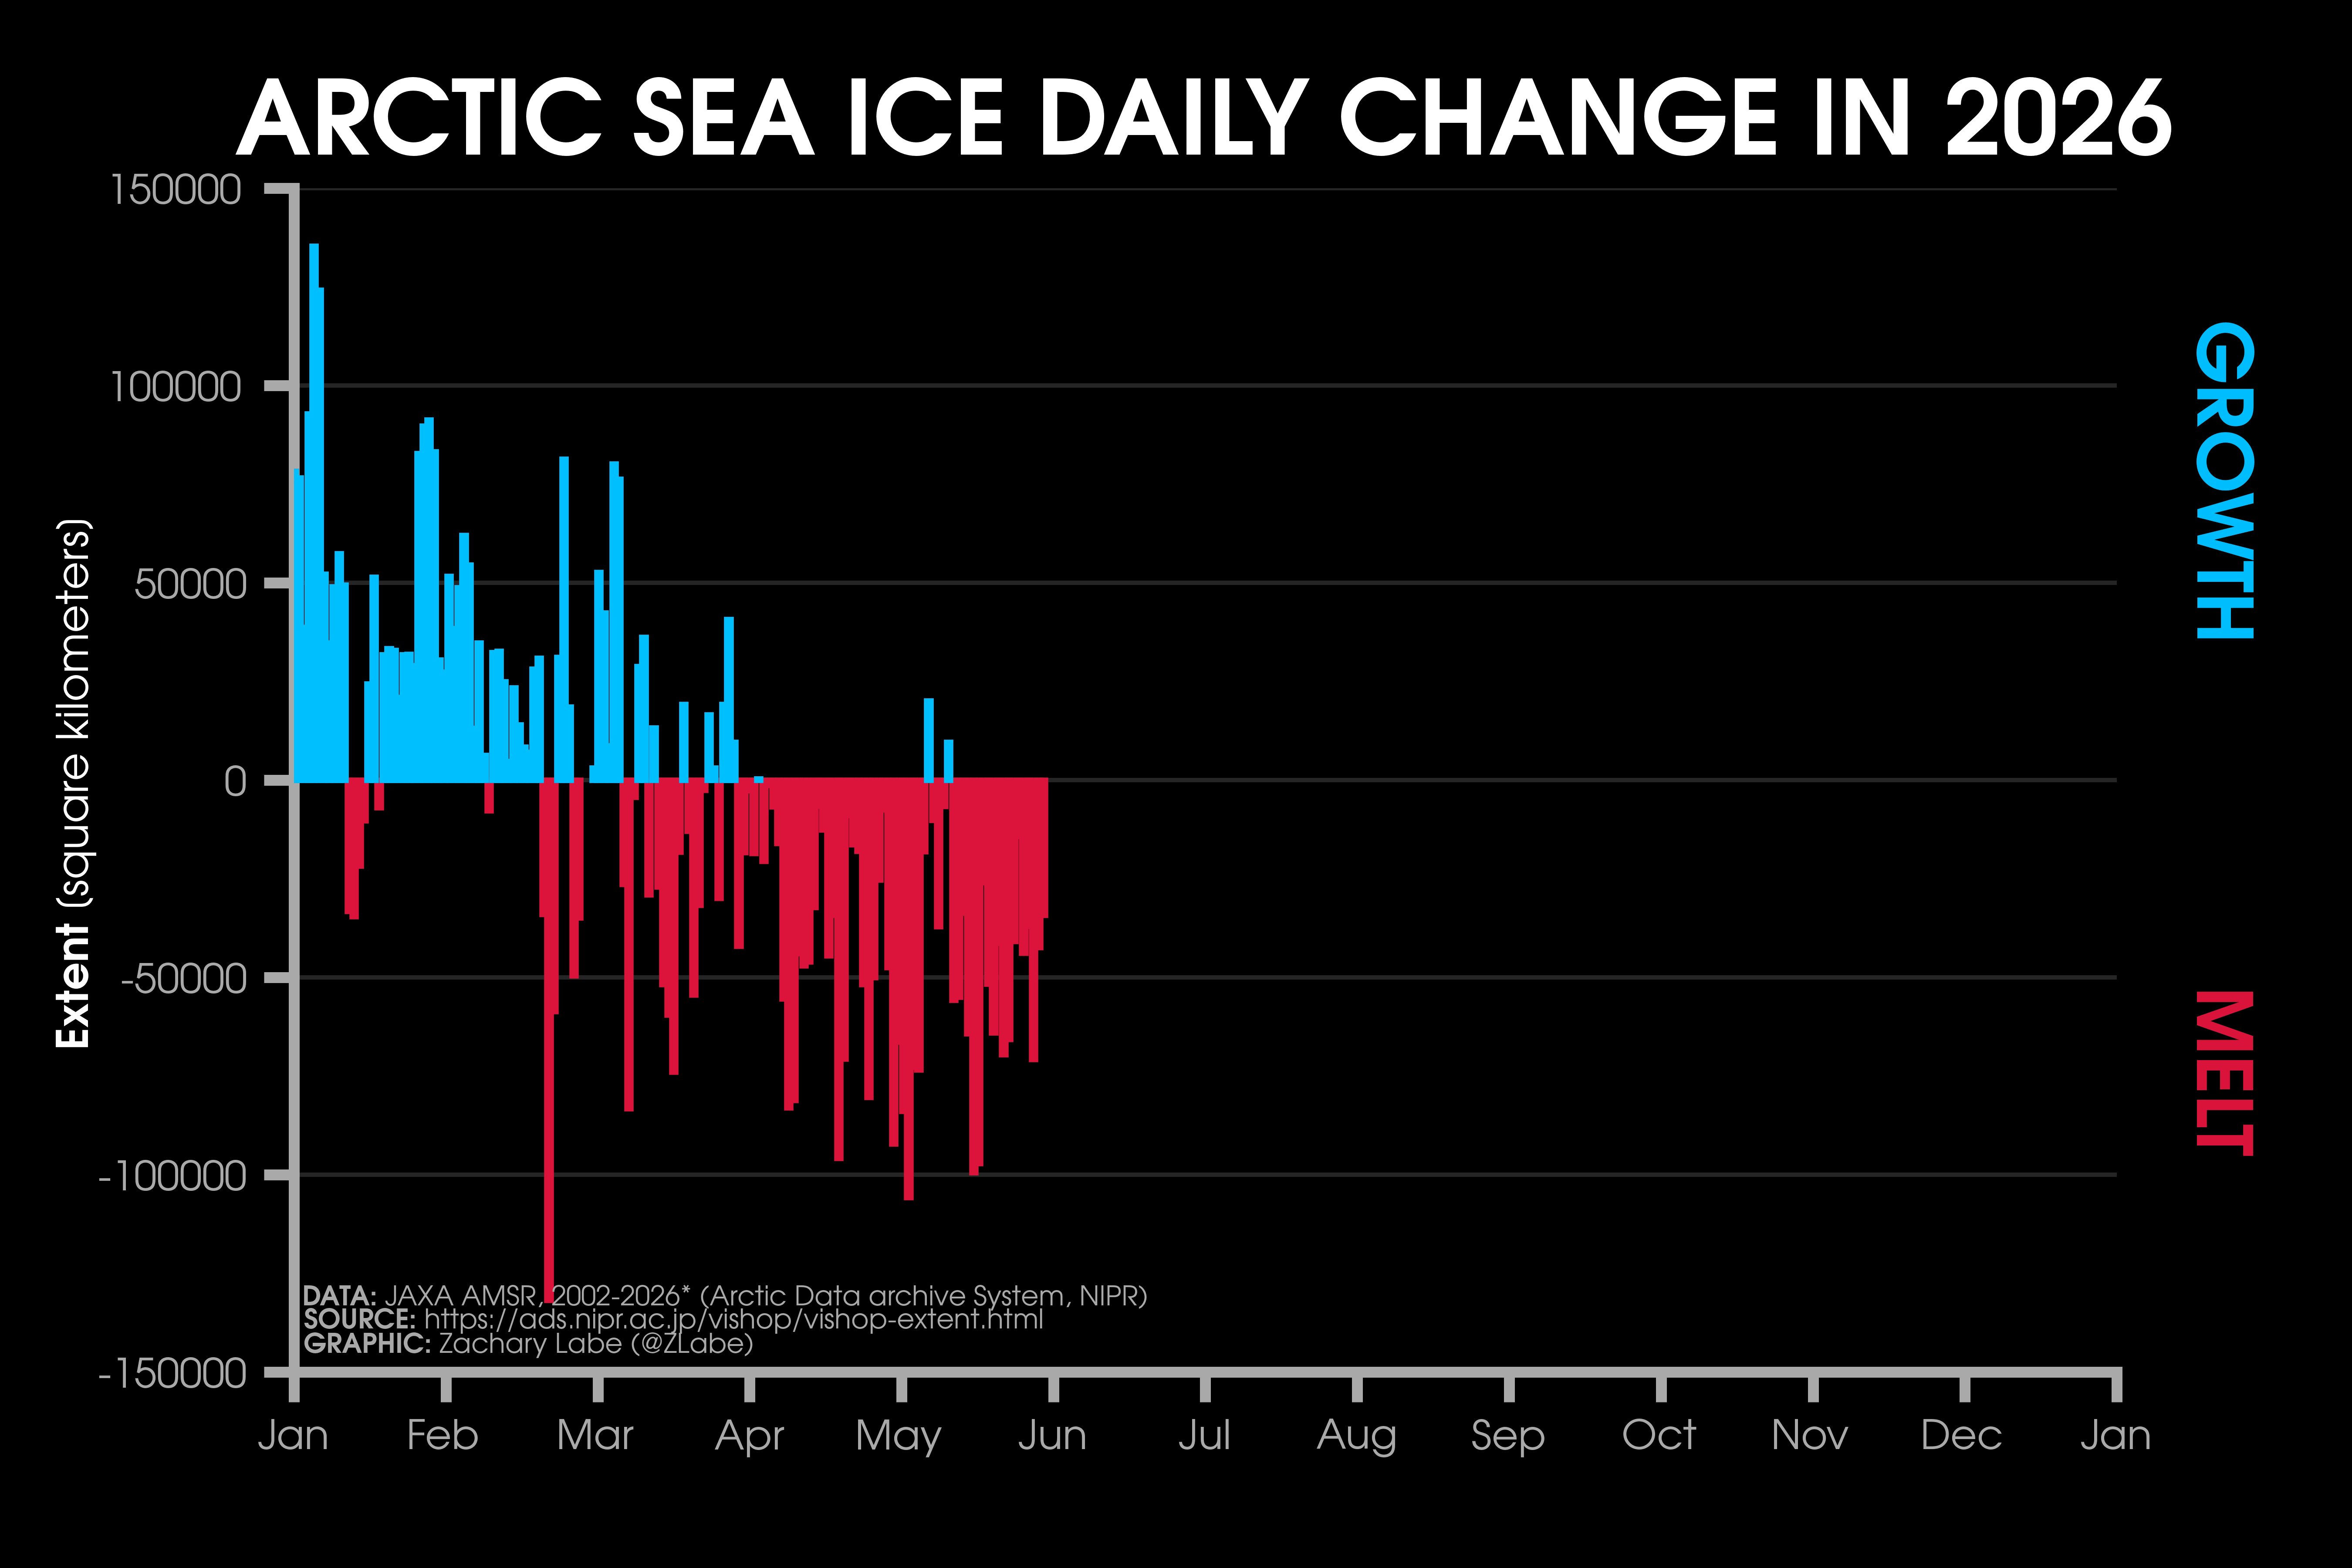
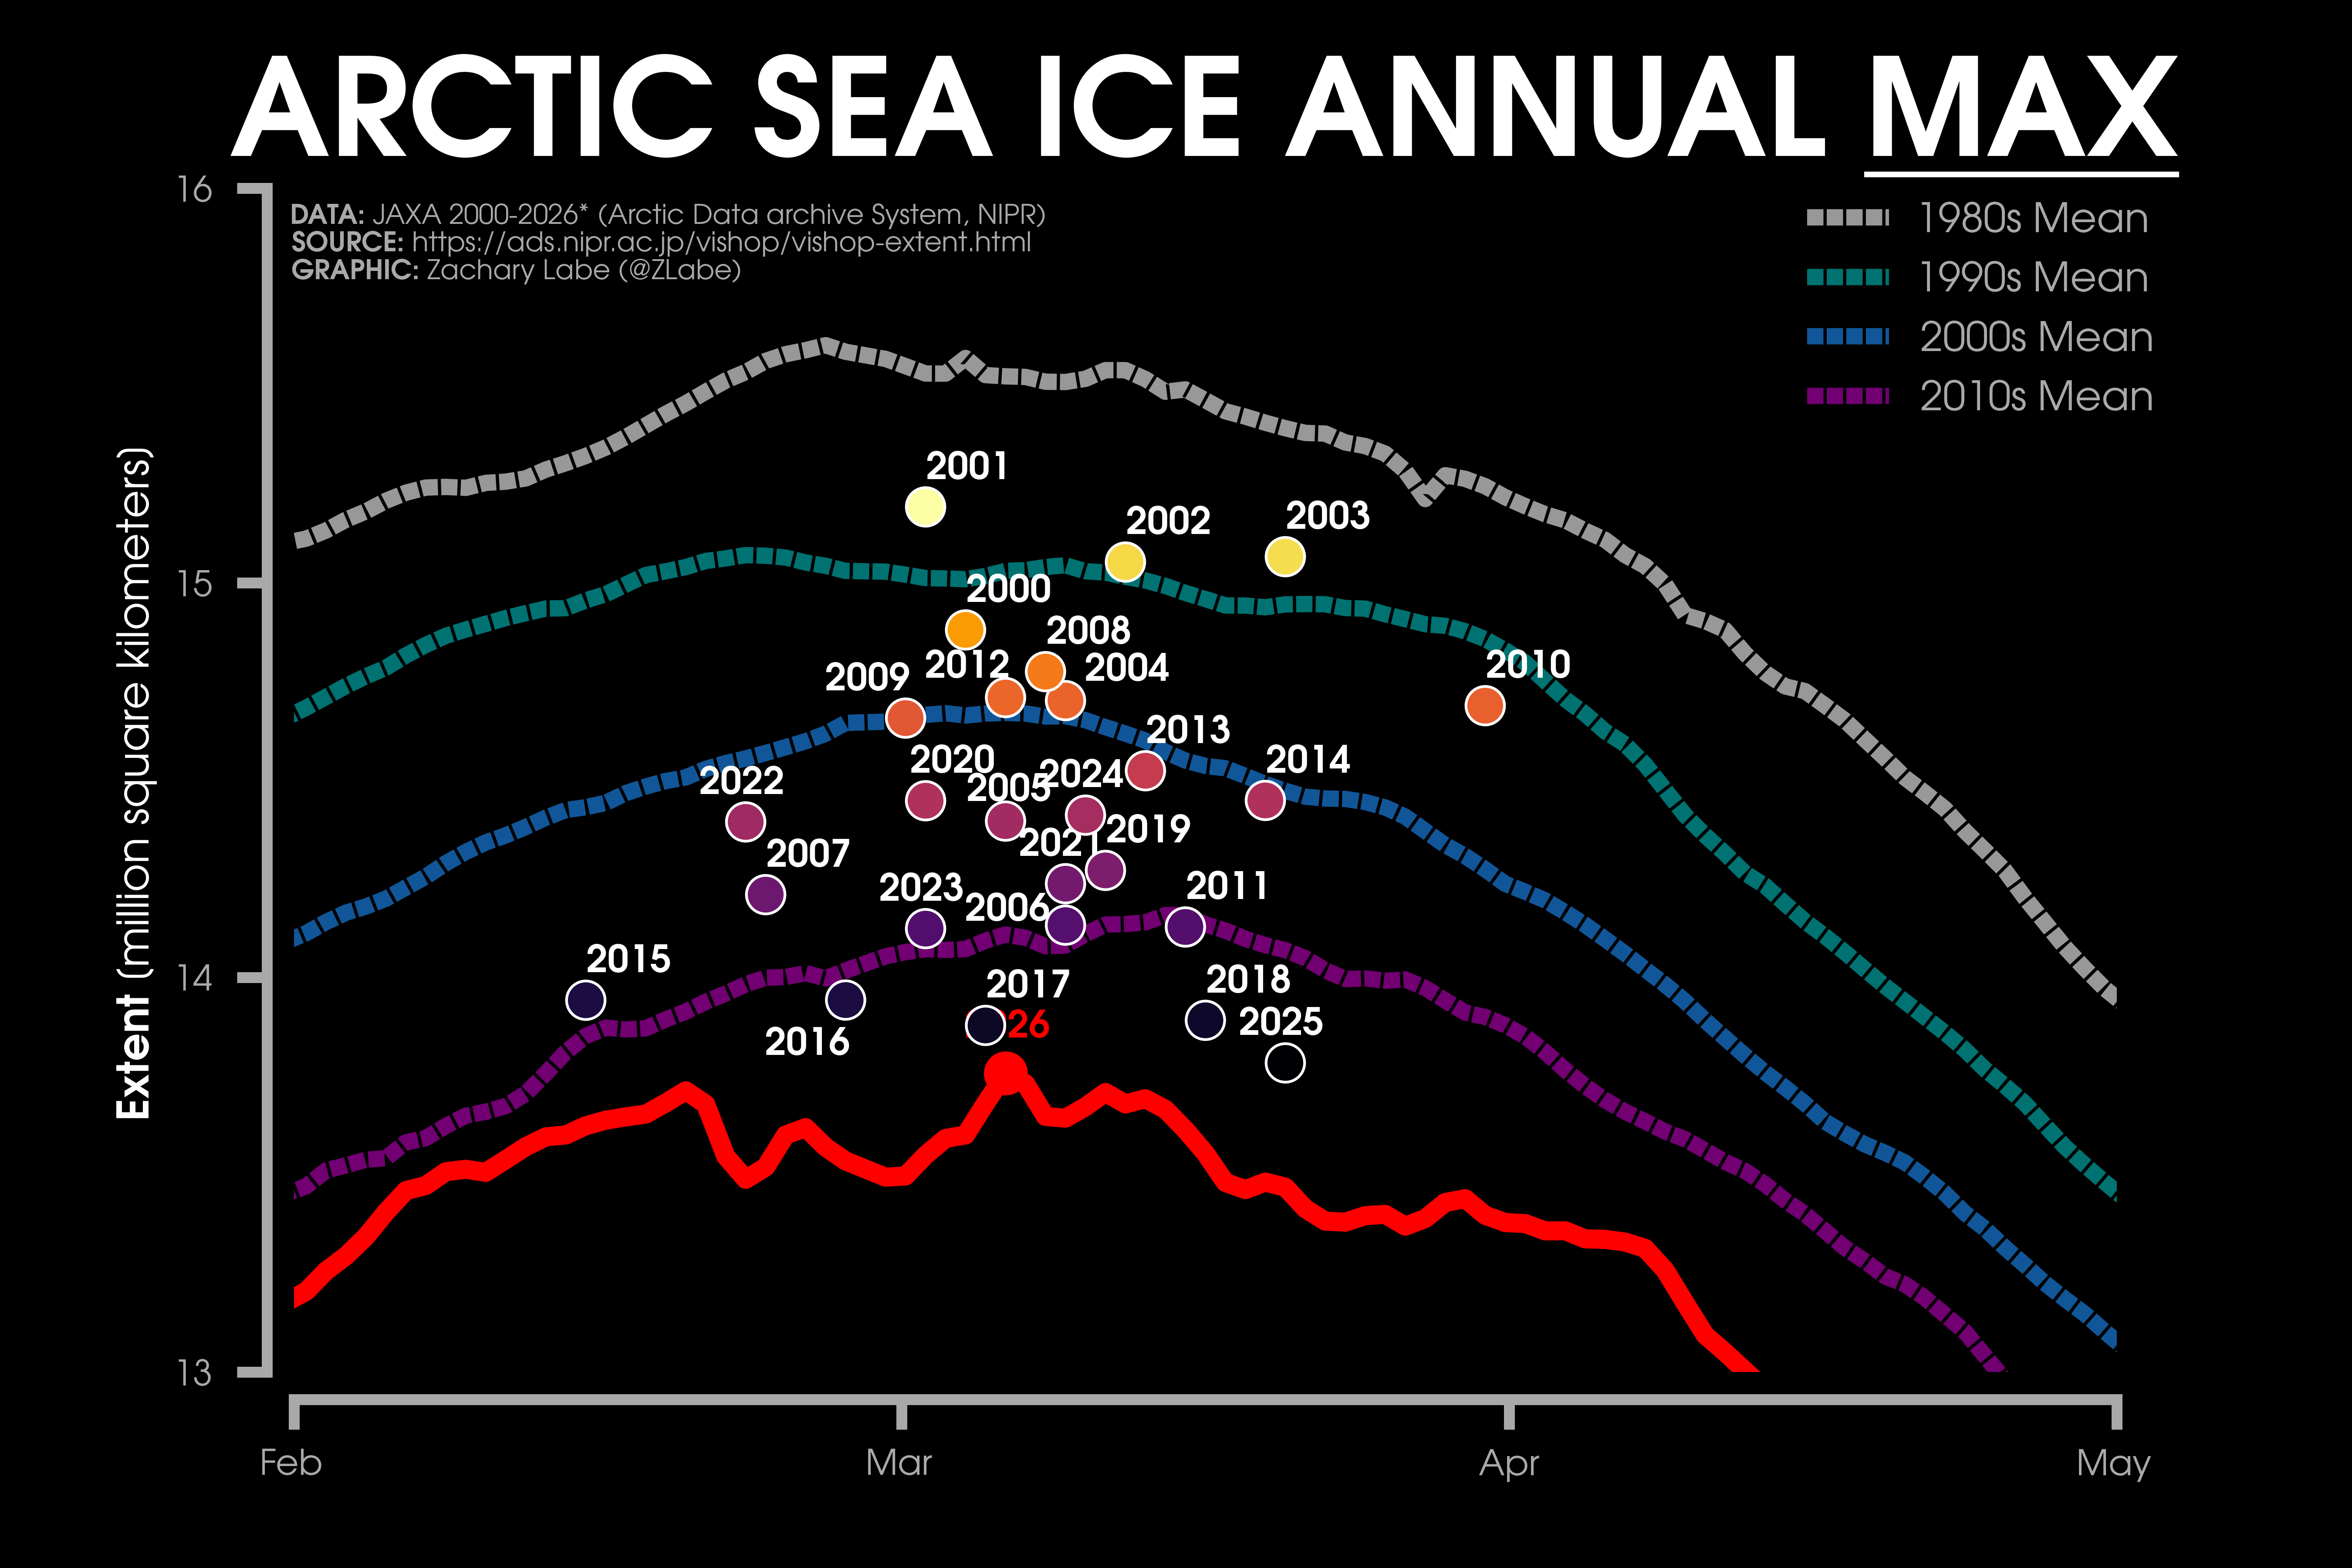
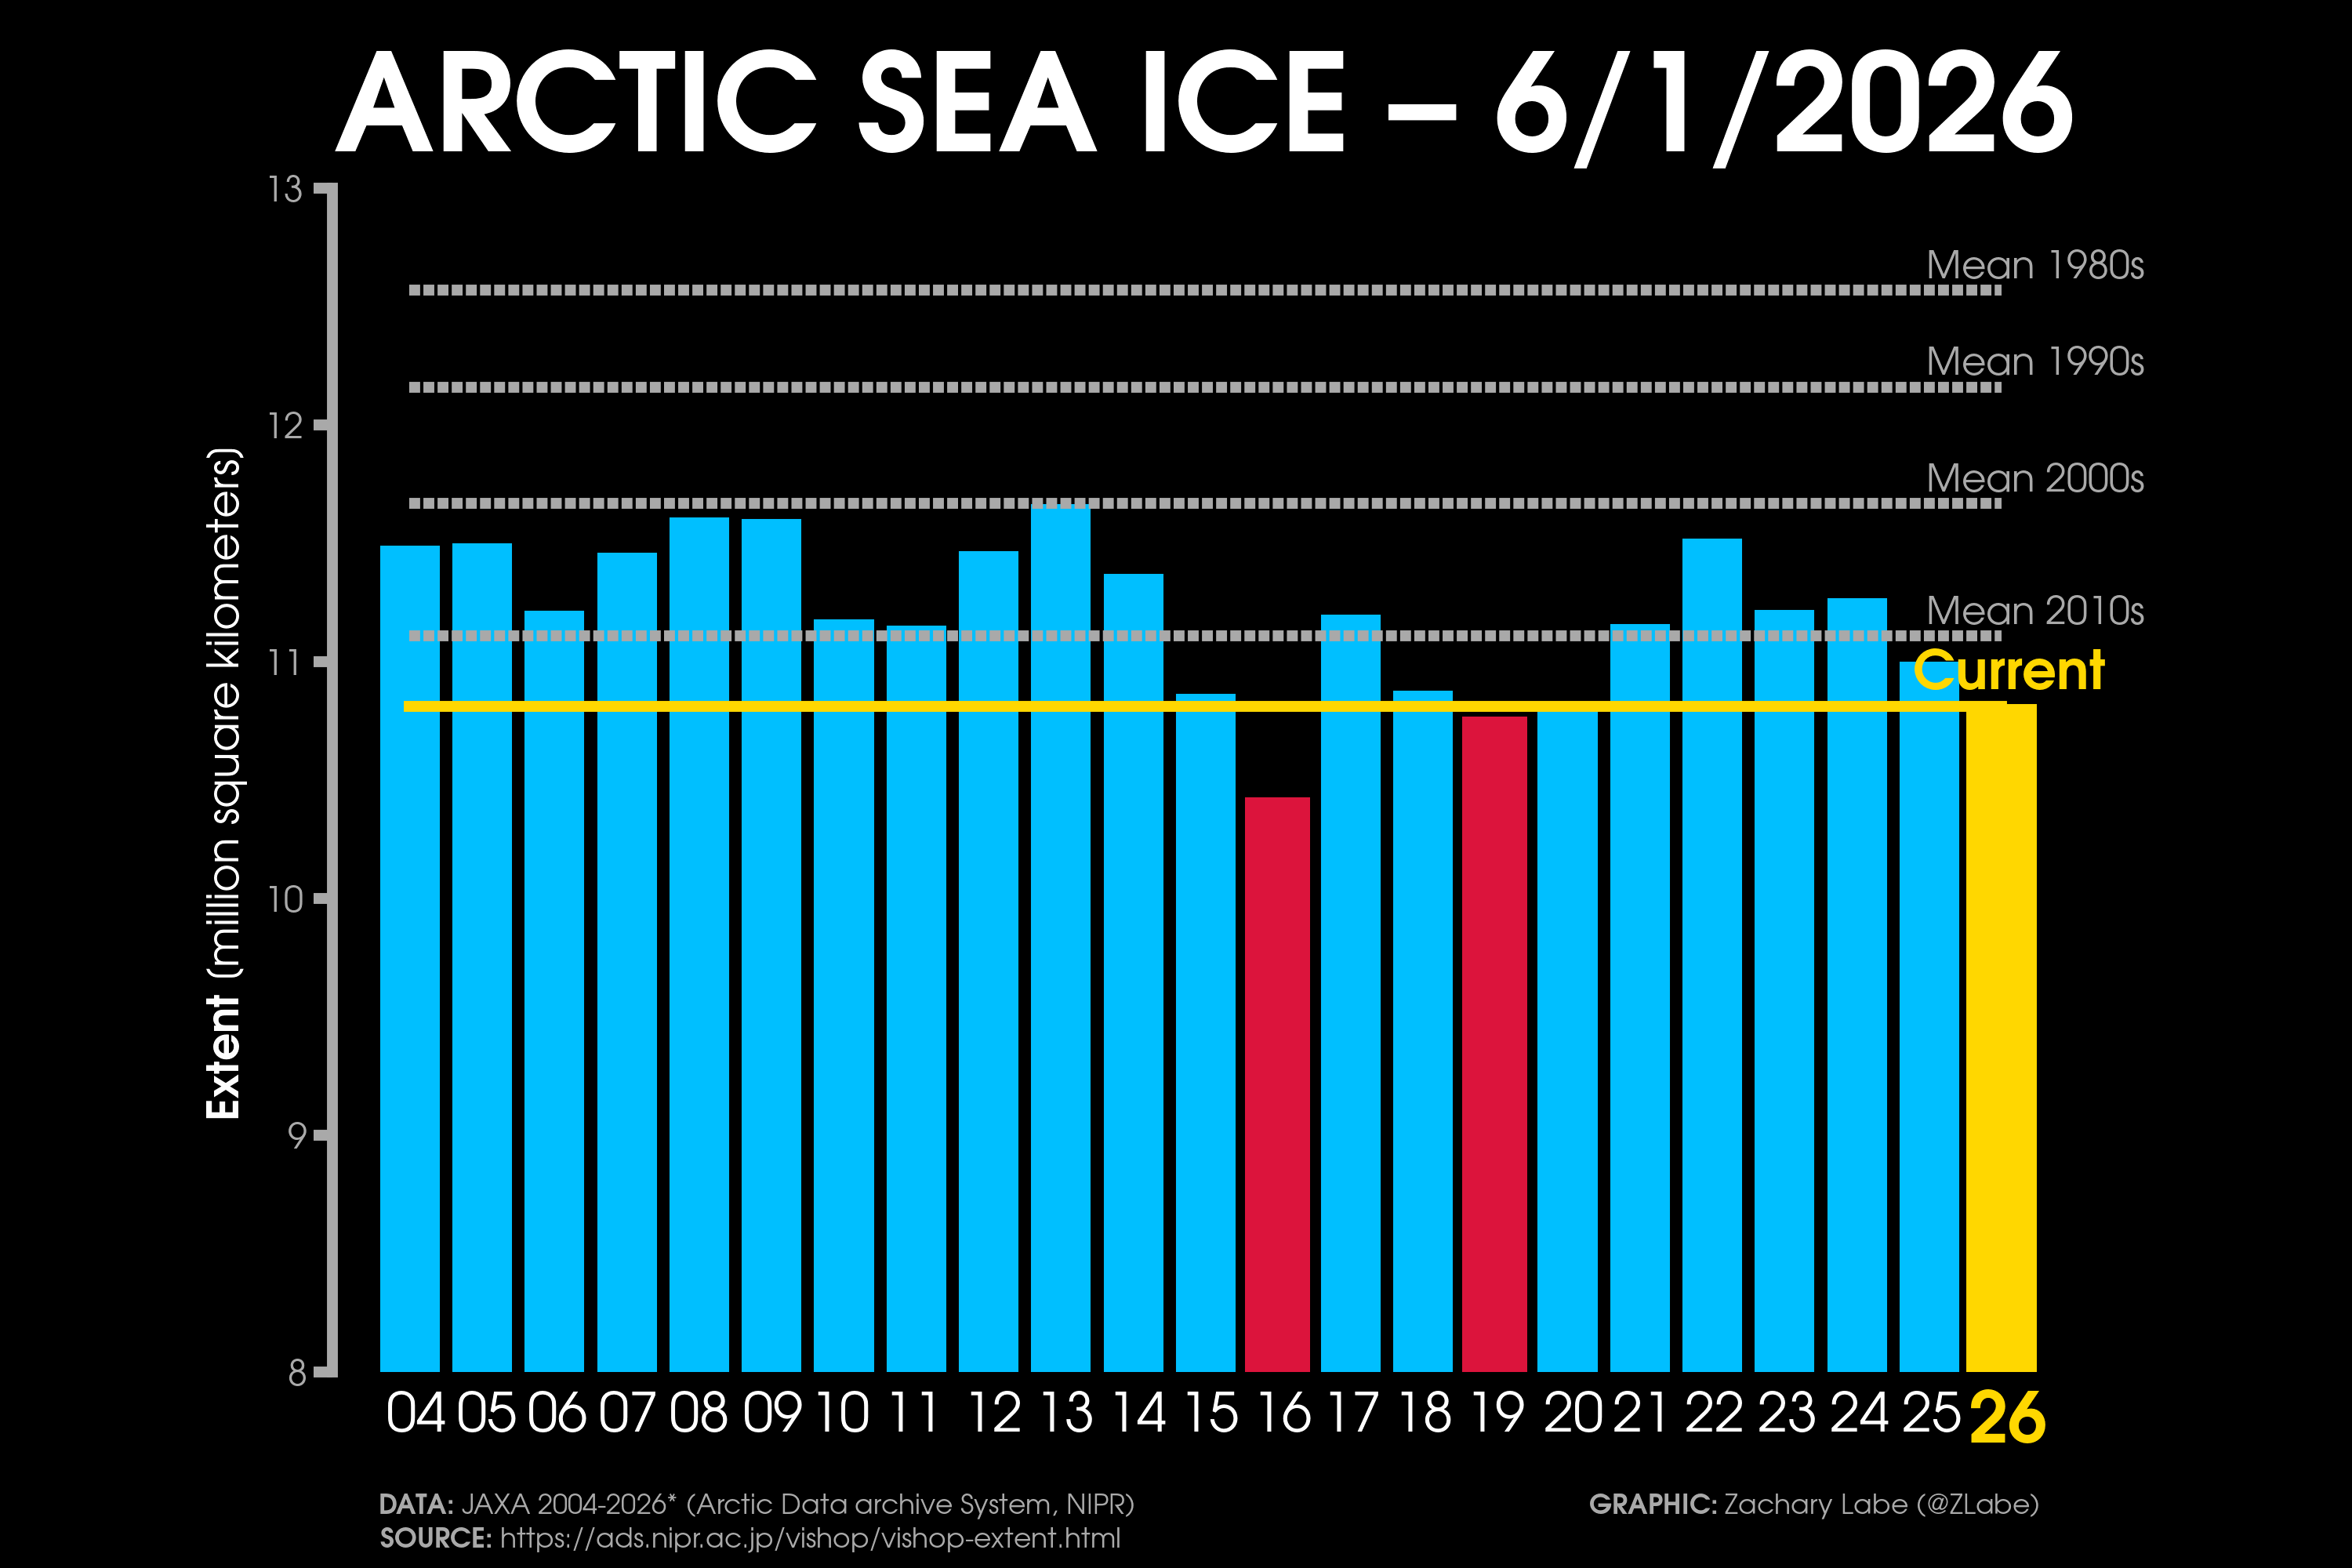
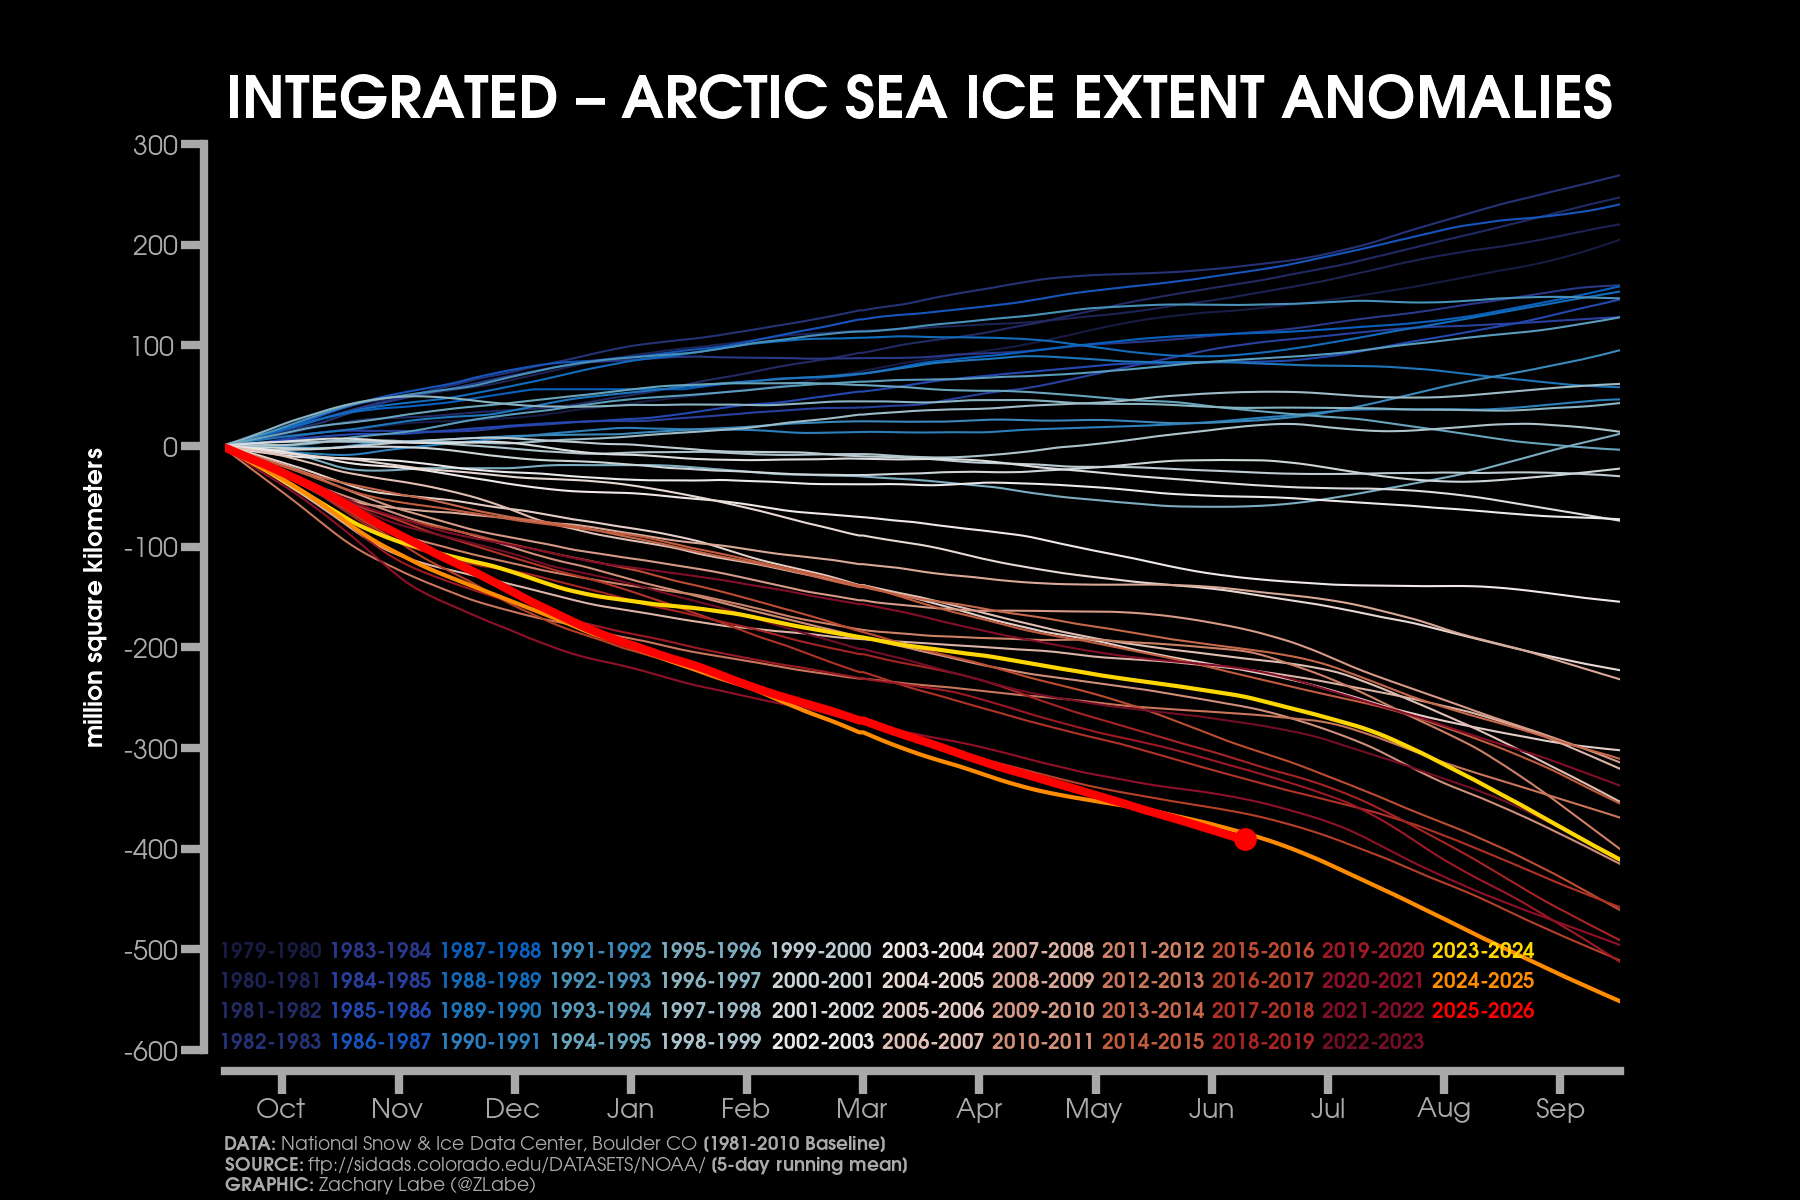
[Arctic Sea-Ice Extent and Concentration]
[Arctic Sea-Ice Volume and Thickness]
[Arctic Temperatures]
[Antarctic Sea-Ice Extent, Concentration, and Thickness]
[Climate Change Indicators]
[United States Climate Indicators]
[Climate model projections compared to observations in the Arctic]
[Global Sea-Ice Extent and Concentration]
[Polar Climate Change Figures]
[[My Blog] Climate Viz of the Month]


My visualizations:
My related research
[23] Joh, Y., S-W. Yeh, T.L. Delworth, Z.M. Labe, A.T. Wittenberg, W.F. Cooke, J. Lou, and Y-G. Park (2026). Evolving synchronization of Gulf Stream and Kuroshio-Oyashio Extension in a changing climate. Science Advances, DOI:10.1126/sciadv.adx6366
[HTML][BibTeX][Code][Data]
[22] Timmermans, M.-L. and Z.M. Labe (2025). Sea surface temperature [in “Arctic Report Card 2025”], NOAA, DOI:10.25923/pz7y-3b10
[HTML][BibTeX][Code]
[Press Release]
[21] Eayrs, C. and Z.M. Labe (2025). The future of sea ice. Comprehensive Cryospheric Science and Environmental Change, DOI:10.1016/B978-0-323-85242-5.00050-6
[HTML][BibTeX]
[20] Timmermans, M.-L. and Z.M. Labe (2025). [The Arctic] Sea surface temperature [in “State of the Climate in 2024”]. Bull. Amer. Meteor. Soc., DOI:10.1175/BAMS-D-25-0104.1
[HTML][BibTeX][Code]
[Press Release]
[19] Timmermans, M.-L. and Z.M. Labe (2024). Sea surface temperature [in “Arctic Report Card 2024”], NOAA, DOI:10.25923/9z96-aq19
[HTML][BibTeX][Code]
[Press Release]
[18] Vanek S.B., Z.M. Labe, O. Lauter, K. Shionalyn, M.A. Shadab, E. Adasheva, A. Margevich, M.N. Schaberg, L. Ashokkumar, and J.N. Naoukin (2024). Exploring the past, present, and future of USAPECS: Lessons from a decade of supporting early career research across national and international polar networks. Arctic Yearbook, ISSN 2298-2418
[HTML][BibTeX][PDF]
[17] Timmermans, M.-L. and Z.M. Labe (2024). [The Arctic] Sea surface temperature [in “State of the Climate in 2023”]. Bull. Amer. Meteor. Soc., DOI:10.1175/BAMS-D-24-0101.1
[HTML][BibTeX][Code]
[Press Release]
[16] Bushuk, M., S. Ali, D. Bailey, Q. Bao, L. Batte, U.S. Bhatt, E. Blanchard-Wrigglesworth, E. Blockley, G. Cawley, J. Chi, F. Counillon, P. Goulet Coulombe, R. Cullather, F.X. Diebold, A. Dirkson, E. Exarchou, M. Gobel, W. Gregory, V. Guemas, L. Hamilton, B. He, S. Horvath, M. Ionita, J. E. Kay, E. Kim, N. Kimura, D. Kondrashov, Z.M. Labe, W. Lee, Y.J. Lee, C. Li, X. Li, Y. Lin, Y. Liu, W. Maslowski, F. Massonnet, W.N. Meier, W.J. Merryfield, H. Myint, J.C. Acosta Navarro, A. Petty, F. Qiao, D. Schroder, A. Schweiger, Q. Shu, M. Sigmond, M. Steele, J. Stroeve, N. Sun, S. Tietsche, M. Tsamados, K. Wang, J. Wang, W. Wang, Y. Wang, Y. Wang, J. Williams, Q. Yang, X. Yuan, J. Zhang, and Y. Zhang (2024). Predicting September Arctic sea ice: A multi-model seasonal skill comparison. Bulletin of the American Meteorological Society, DOI:10.1175/BAMS-D-23-0163.1
[HTML][BibTeX][Code]
[15] Timmermans, M.-L. and Z.M. Labe (2023). Sea surface temperature [in “Arctic Report Card 2023”], NOAA, DOI:10.25923/e8jc-f342
[HTML][BibTeX][Code]
[Press Release][NOAA Climate(dot)gov]
[14] Timmermans, M.-L. and Z.M. Labe (2023). [The Arctic] Sea surface temperature [in “State of the Climate in 2022”]. Bull. Amer. Meteor. Soc., DOI:10.1175/BAMS-D-23-0079.1
[HTML][BibTeX][Code]
[Press Release]
[13] Timmermans, M.-L. and Z.M. Labe (2022). Sea surface temperature [in “Arctic Report Card 2022”], NOAA, DOI:10.25923/p493-2548
[HTML][BibTeX][Code]
[Press Release]
[12] Timmermans, M.-L. and Z.M. Labe (2022). [The Arctic] Sea surface temperature [in “State of the Climate in 2021”]. Bull. Amer. Meteor. Soc., DOI:10.1175/BAMS-D-22-0082.1
[HTML][BibTeX][Code]
[Press Release]
[11] Labe, Z.M. and E.A. Barnes (2022), Comparison of climate model large ensembles with observations in the Arctic using simple neural networks. Earth and Space Science, DOI:10.1029/2022EA002348
[HTML][BibTeX][Code]
[Plain Language Summary]
[10] Timmermans, M.-L. and Z.M. Labe (2021). Sea surface temperature [in “Arctic Report Card 2021”], NOAA, DOI:10.25923/2y8r-0e49
[HTML][BibTeX][Code]
[Press Release]
[9] Timmermans, M.-L. and Z.M. Labe (2021). [The Arctic] Sea surface temperature [in “State of the Climate in 2020”]. Bull. Amer. Meteor. Soc., DOI:10.1175/BAMS-D-21-0086.1
[HTML][BibTeX][Code]
[Press Release]
[8] Peings, Y., Z.M. Labe, and G. Magnusdottir (2021), Are 100 ensemble members enough to capture the remote atmospheric response to +2°C Arctic sea ice loss? Journal of Climate, DOI:10.1175/JCLI-D-20-0613.1
[HTML][BibTeX][Code]
[Plain Language Summary][CLIVAR Research Highlight]
[7] Timmermans, M.-L. and Z.M. Labe (2020). Sea surface temperature [in “Arctic Report Card 2020”], NOAA, DOI:10.25923/v0fs-m920
[HTML][BibTeX][Code]
[Press Release]
[6] Timmermans, M.-L., Z.M. Labe, and C. Ladd (2020). [The Arctic] Sea surface temperature [in “State of the Climate in 2019”], Bull. Amer. Meteor. Soc., DOI:10.1175/BAMS-D-20-0086.1
[HTML][BibTeX][Code]
[Press Release]
[5] Labe, Z.M., Y. Peings, and G. Magnusdottir (2020). Warm Arctic, cold Siberia pattern: role of full Arctic amplification versus sea ice loss alone, Geophysical Research Letters, DOI:10.1029/2020GL088583
[HTML][BibTeX]
[Plain Language Summary][CBS News][Science Magazine][The Washington Post]
[4] Thoman, R.L., U. Bhatt, P. Bieniek, B. Brettschneider, M. Brubaker, S. Danielson, Z.M. Labe, R. Lader, W. Meier, G. Sheffield, and J. Walsh (2020): The record low Bering Sea ice extent in 2018: Context, impacts and an assessment of the role of anthropogenic climate change [in “Explaining Extreme Events of 2018 from a Climate Perspective”]. Bull. Amer. Meteor. Soc, DOI:10.1175/BAMS-D-19-0175.1
[HTML][BibTeX][Code]
[Press Release]
[3] Labe, Z.M., Y. Peings, and G. Magnusdottir (2019). The effect of QBO phase on the atmospheric response to projected Arctic sea ice loss in early winter, Geophysical Research Letters, DOI:10.1029/2019GL083095
[HTML][BibTeX]
[Plain Language Summary]
[2] Labe, Z.M., Y. Peings, and G. Magnusdottir (2018), Contributions of ice thickness to the atmospheric response from projected Arctic sea ice loss, Geophysical Research Letters, DOI:10.1029/2018GL078158
[HTML][BibTeX]
[Plain Language Summary][Arctic Today]
[1] Labe, Z.M., G. Magnusdottir, and H.S. Stern (2018), Variability of Arctic sea ice thickness using PIOMAS and the CESM Large Ensemble, Journal of Climate, DOI:10.1175/JCLI-D-17-0436.1
[HTML][BibTeX]
[Plain Language Summary]
All of the Python code used to generate these figures are available from my GitHub account. Most scripts use data sets that are generated via ftp retrieval.
*These figures may be freely distributed (with credit). Information about the data can be found on my references page and methods page.