The linkages between future Arctic climate change and mid-latitude weather continue to remain unclear in climate model experiments (see Barnes et al. 2015, Cohen et al. 2020). This is a result of internal variability in the climate system, competing influences on the jet stream from projected upper-troposphere tropical warming and Arctic surface warming (see Peings et al. 2019), nonlinear interactions, and model biases. In association with the next IPCC report (AR6) and Coupled Model Intercomparison Project Phase 6 (CMIP6), a coordinated series of modeling experiments called the Polar Amplification Model Intercomparison Project (PAMIP) will try to answer some of these questions (see Smith et al. 2019).
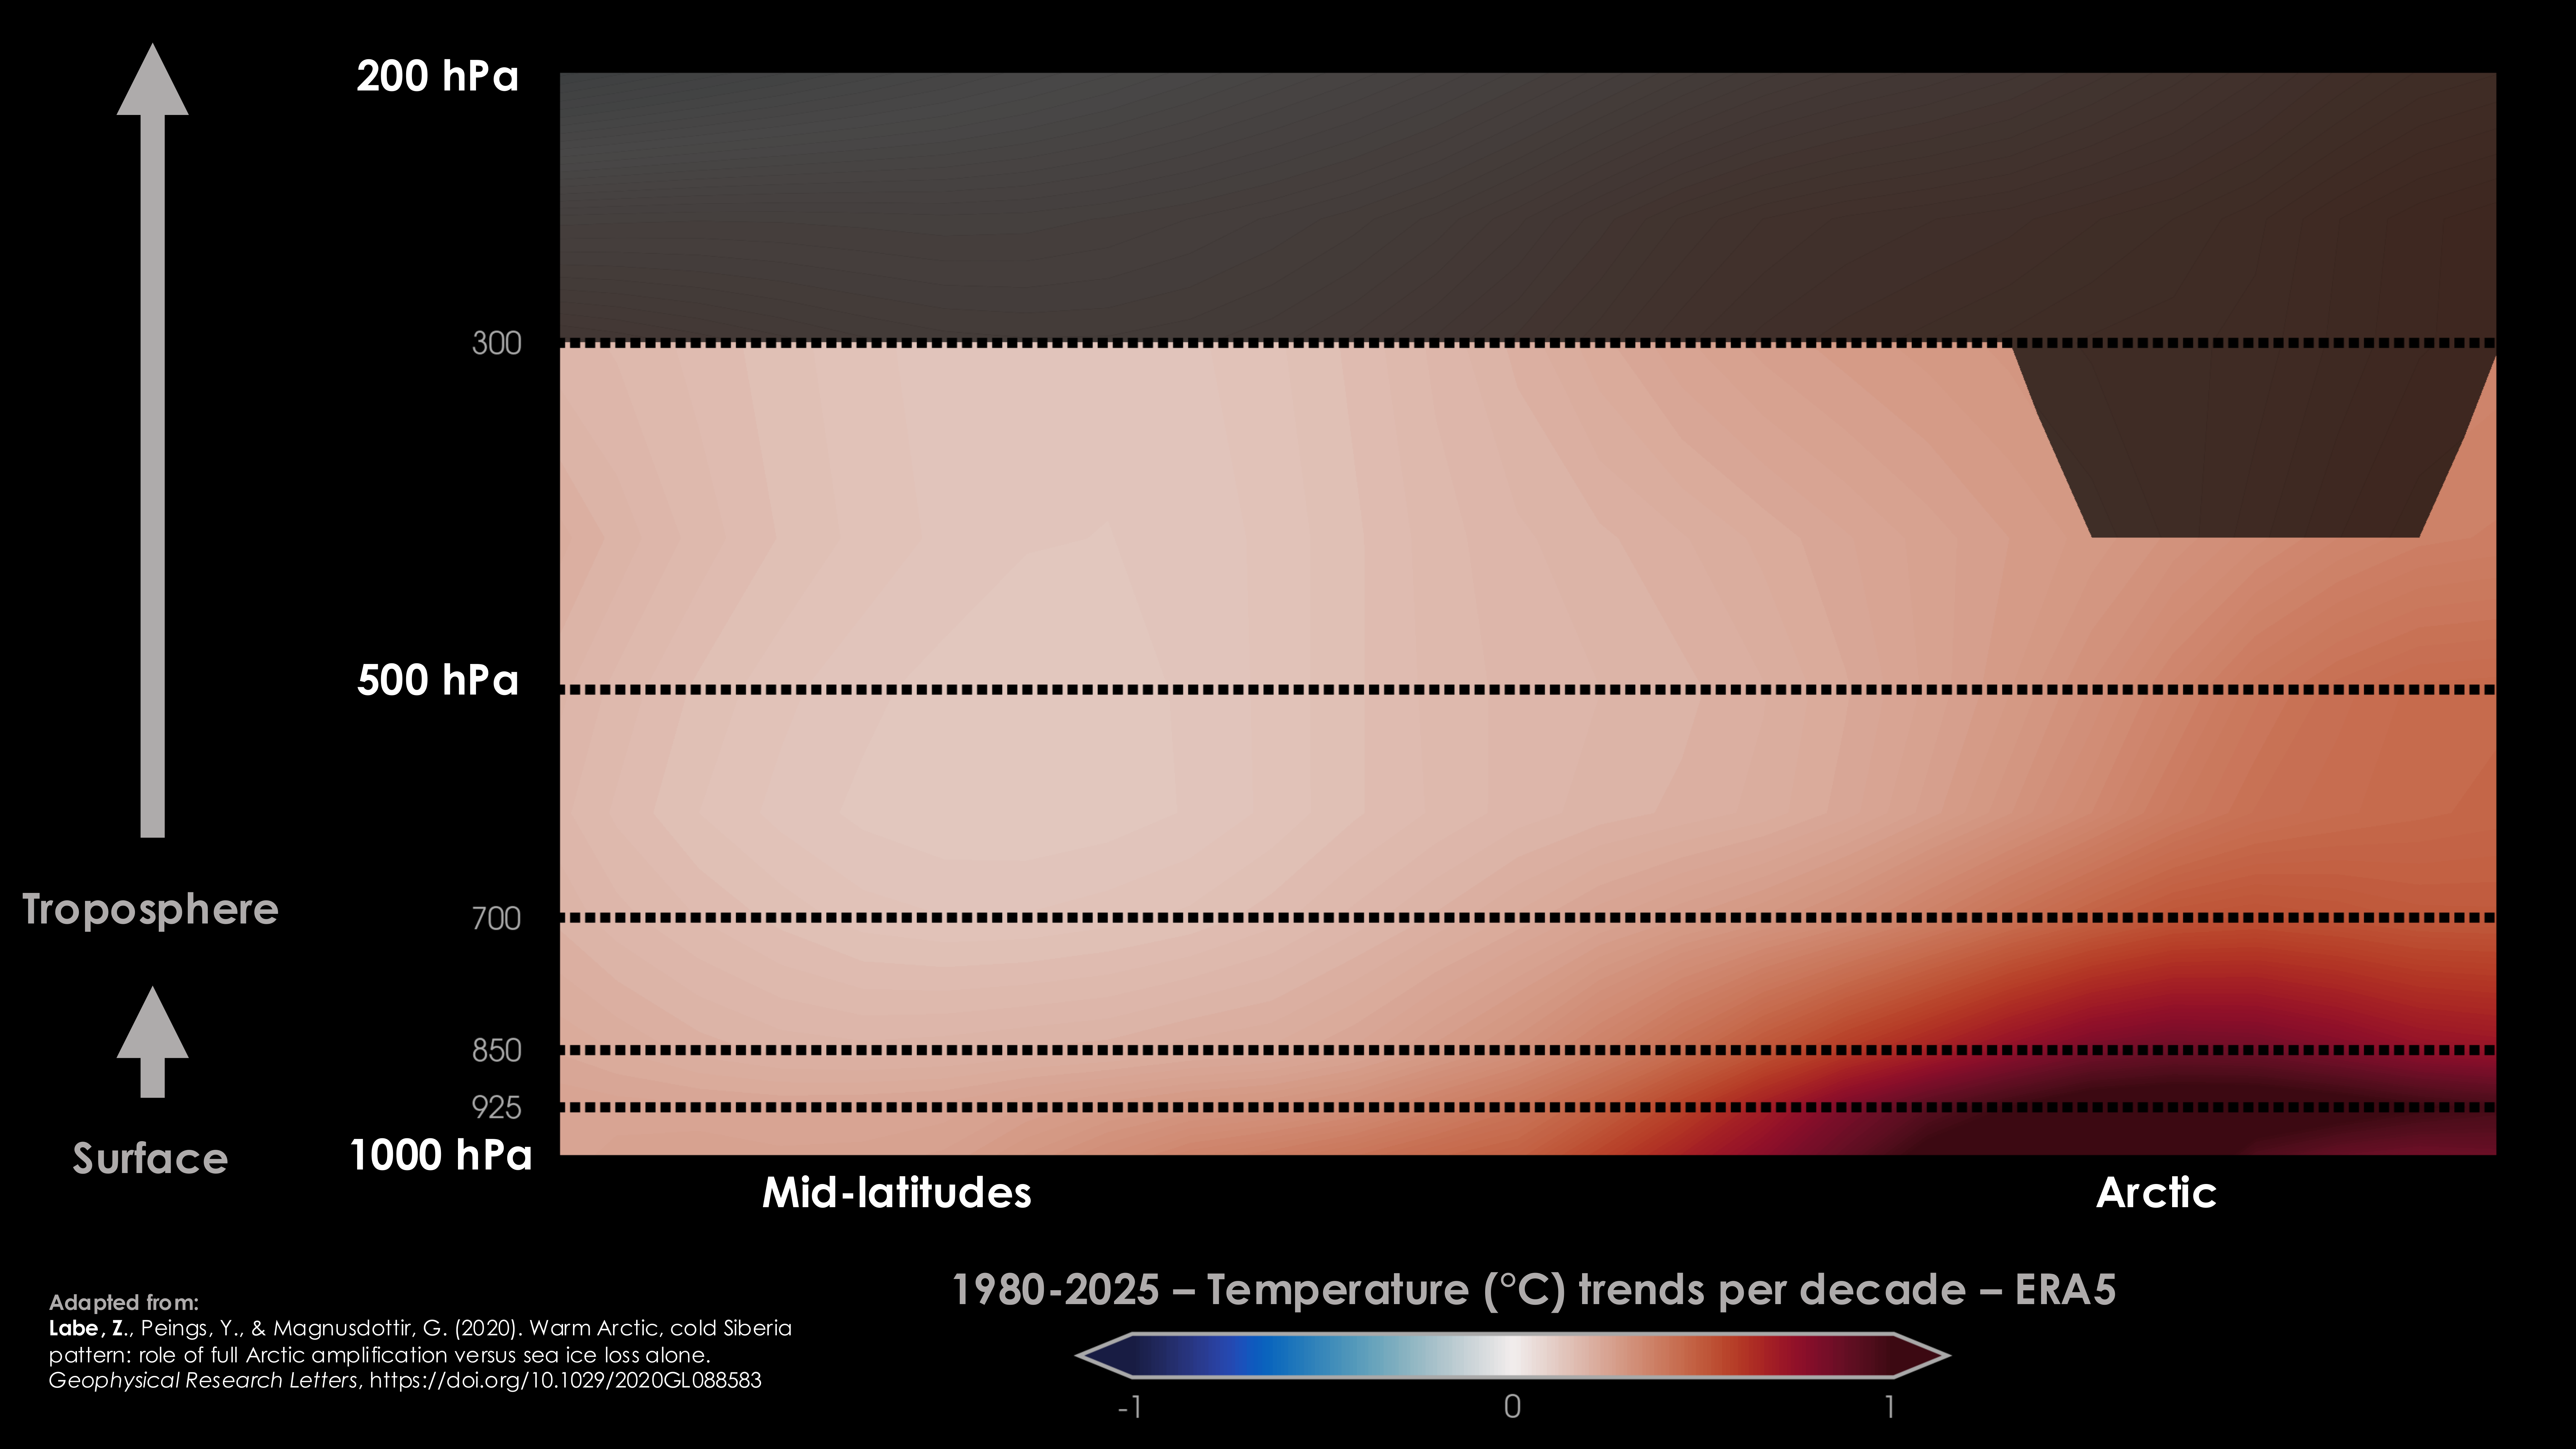
The majority of modeling studies evaluating weather/climate linkages between the Arctic and mid-latitudes have prescribed changes in Arctic sea ice over the 21st century (see Screen et al. 2018). However, sea-ice loss is only one contributing factor to Arctic amplification (Arctic is warming more than three times as fast as the global mean temperature). Other positive feedbacks in the climate system, such as remote sea surface temperatures, changes to water vapor and cloud cover, the lapse rate feedback, shifts in the storm track, the Planck feedback, and ocean heat transport, all contribute to the accelerated warming in the Arctic (see review at Goosse et al. 2018). Moreover, numerous studies have shown that the warming response due to sea-ice loss is mostly confined to the surface (see Francis, 2017). While the greatest warming trends have indeed been found near the surface during the satellite-era (since 1979), observations (radiosonde and reanalysis data) also show warming extending up into the middle and upper troposphere (Fig 1). Future global climate model projections also indicate that warming will extend into mid-troposphere as well. Therefore, model experiments that prescribe only changes in sea ice will not capture the total warming of the lower atmosphere due to Arctic climate change. A recent study (He et al. 2020) found a stronger connection between Arctic warming and Siberian cold spells in historical simulations when there was greater warming in the mid-troposphere. We build off of these results by assessing future projections of Arctic climate change (Labe et al. 2020).
To assess the role of Arctic sea-ice loss compared with the total effect of Arctic amplification on the large-scale atmospheric circulation, we have conducted numerous climate model perturbation experiments in our latest study. We use two atmospheric general circulation models with well-resolved stratospheres: the Whole Atmosphere Community Climate Model version 4 (SC-WACCM4; with specified chemistry) and the Energy Exascale Earth System Model version 1 (E3SMv1). The first set of experiments impose warming from Arctic amplification found in the CESM-Large Ensemble (RCP8.5 – extreme climate change scenario) at levels near 2030, 2060, and 2090. This large forcing (perturbation) in our sensitivity experiments help us to identify the physical mechanisms linking the Arctic and the mid-latitudes. In our second set of experiments, we conduct a series of sea-ice loss simulations following the PAMIP protocol using a forcing of 2°C of global warming relative to the pre-industrial era. While these experiments have the same amount of sea-ice loss, we compare changes in sea-ice thickness to sea-ice concentration and the role of ocean feedbacks. Finally, we evaluate model experiments that simulate present-day sea-ice loss during the satellite-era. A list of all of these experiments can be found in our Table 1.
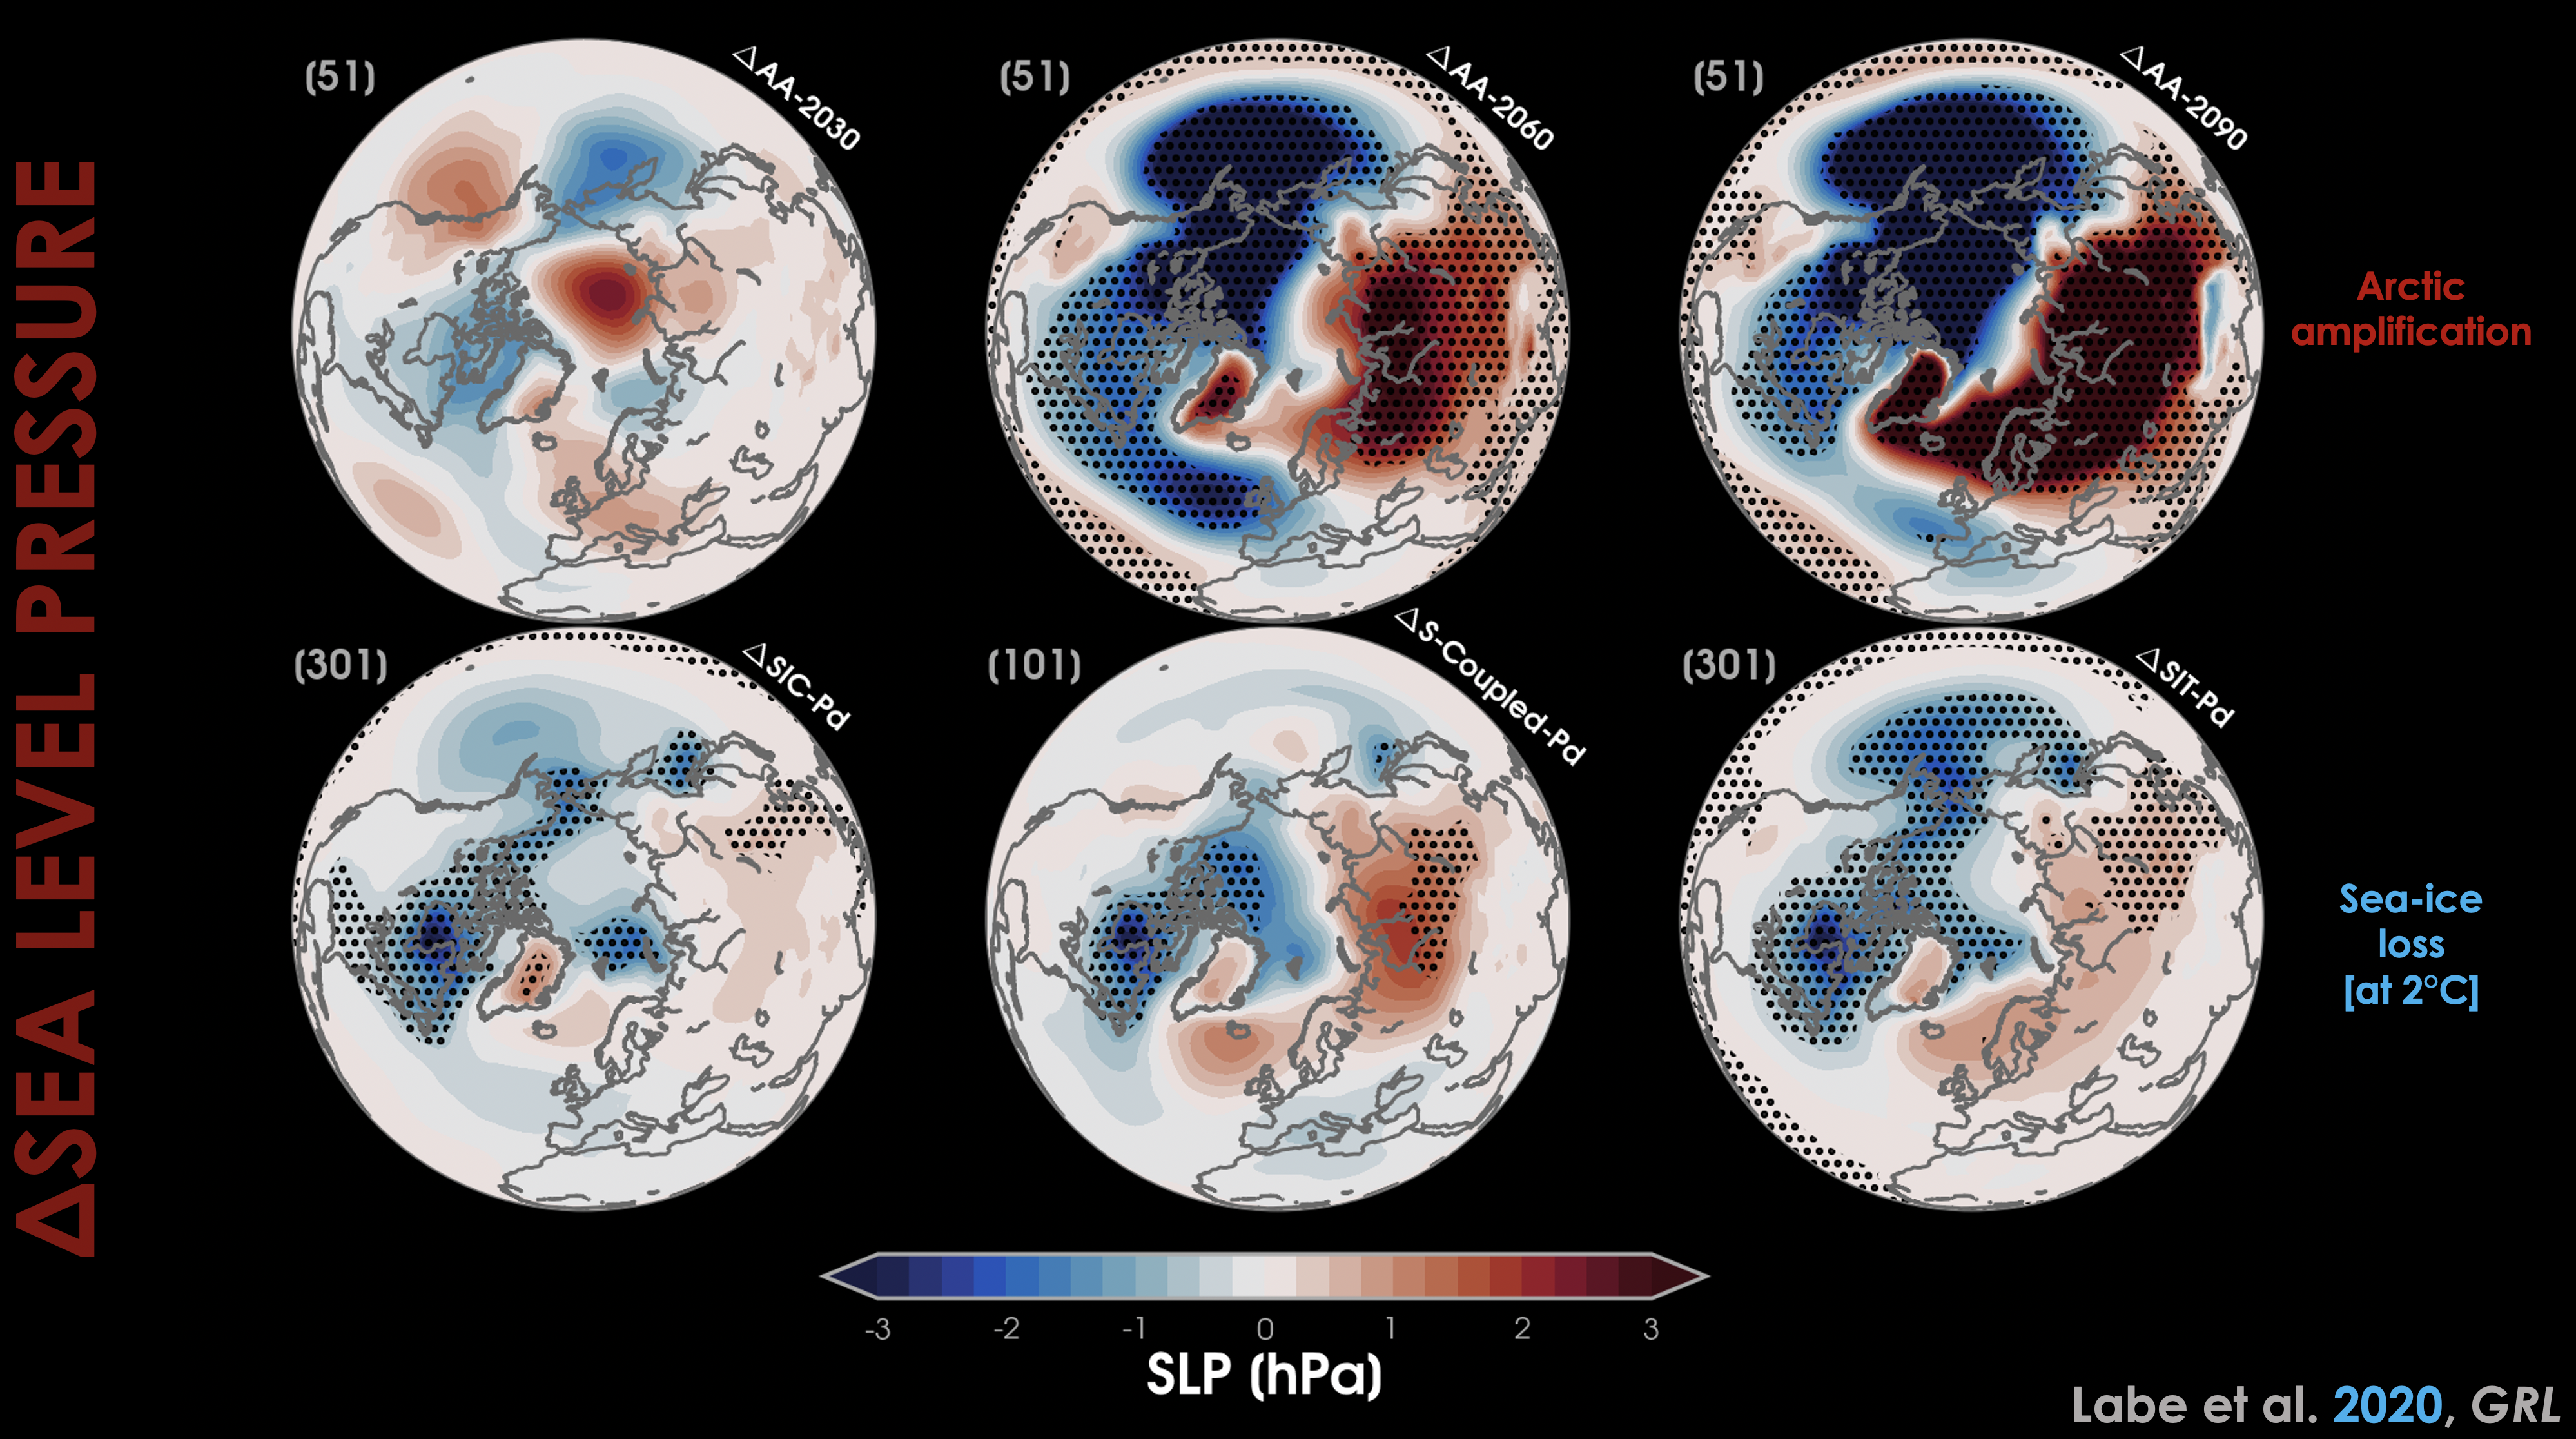
Despite the differences in model set-up, we find a strikingly similar pattern of sea level pressure response – increase in sea level pressure over Eurasia and decrease in sea level pressure over the Arctic Ocean and North Pacific (Fig. 2). However, the strength of this sea level pressure response is substantially greater when there is more warming in the middle to upper Arctic troposphere. The stronger Siberian/Ural high is connected to a cooling downstream over eastern Asia, which is due to cold air advection. Thus, without including the total effect of Arctic amplification (compared to only sea-ice loss), studies may not observe the complete role of Arctic-mid-latitude climate teleconnections. In agreement with our earlier study (Labe et al. 2018), we find that loss of Arctic sea-ice thickness reinforces the large-scale atmospheric response to sea-ice concentration decline (e.g., further temperature warming).
In summary, we show that the ‘warm Arctic, cold Siberia’ temperature anomaly pattern is closely connected to the extent of warming in the Arctic mid-troposphere. While the experiments are idealized, our results further suggest the importance of simulating the total Arctic amplification effect (not just sea-ice loss) when evaluating Arctic-mid-latitude linkages. We find a stronger teleconnection between the Arctic and Eurasia when imposing the total warming of projected Arctic climate change in our model. Lastly, we have conducted additional climate model experiments that will assess the robustness and internal variability of these linkages at global warming levels of 2°C of warming. More details about this work can be found in our study Peings et al. (2021)!
Refereed/Peer-Reviewed:
[1] Labe, Z.M., Y. Peings, and G. Magnusdottir (2020). Warm Arctic, cold Siberia pattern: role of full Arctic amplification versus sea ice loss alone, Geophysical Research Letters, DOI:10.1029/2020GL088583
[HTML][BibTeX][Code]
[Plain Language Summary][CBS News][Science Magazine][The Washington Post]
Conferences Abstracts/Posters:
[6] Labe, Z.M. Greater Siberian cooling linked to Arctic mid-tropospheric warming.
[Poster][Code]
[5] Peings, Y., Z.M. Labe, and G. Magnusdottir. Arctic-midlatitude linkages: role of sea ice loss versus full Arctic amplification. US CLIVAR PPAI Panel Webinar Series, Virtual Talk (Apr 2021).
[Recording]
[4] Magnusdottir, G., Z.M. Labe, and Y. Peings. The warm Arctic, cold Siberia pattern: role of the full Arctic amplification versus sea ice loss alone. Polar Amplification Model Intercomparison (PAMIP) Virtual Workshop, Virtual Conference (Mar 2021).
[3] Peings, Y., Z.M. Labe, and G. Magnusdottir. Arctic-midlatitude linkages: role of sea ice loss versus full Arctic Amplification, Arctic Science Summit Week 2021, Virtual Conference (Mar 2021).
[2] Magnusdottir, G., Z.M. Labe, and Y. Peings. The midlatitude response to Arctic sea-ice decline, compared to the response to the full effects of Arctic amplification, 34th Conference on Climate Variability and Change, Virtual Conference (Jan 2021).
[Abstract][Code]
[1] Magnusdottir, G., Z.M. Labe, and Y. Peings. How does the atmospheric response to Arctic sea-ice decline compare to the full effect of the Arctic Amplification?, 2020 American Geophysical Union Annual Meeting, Virtual Conference (Dec 2020).
[Abstract][Code]