Hi! My name is Zack! I’m a climate scientist looking to find the signal in all the noise. I use data-driven methods to untangle climate change patterns from natural variability, providing clearer insights into climate risks. I also spend a lot of time thinking about how to make science more engaging through storytelling and visualization.
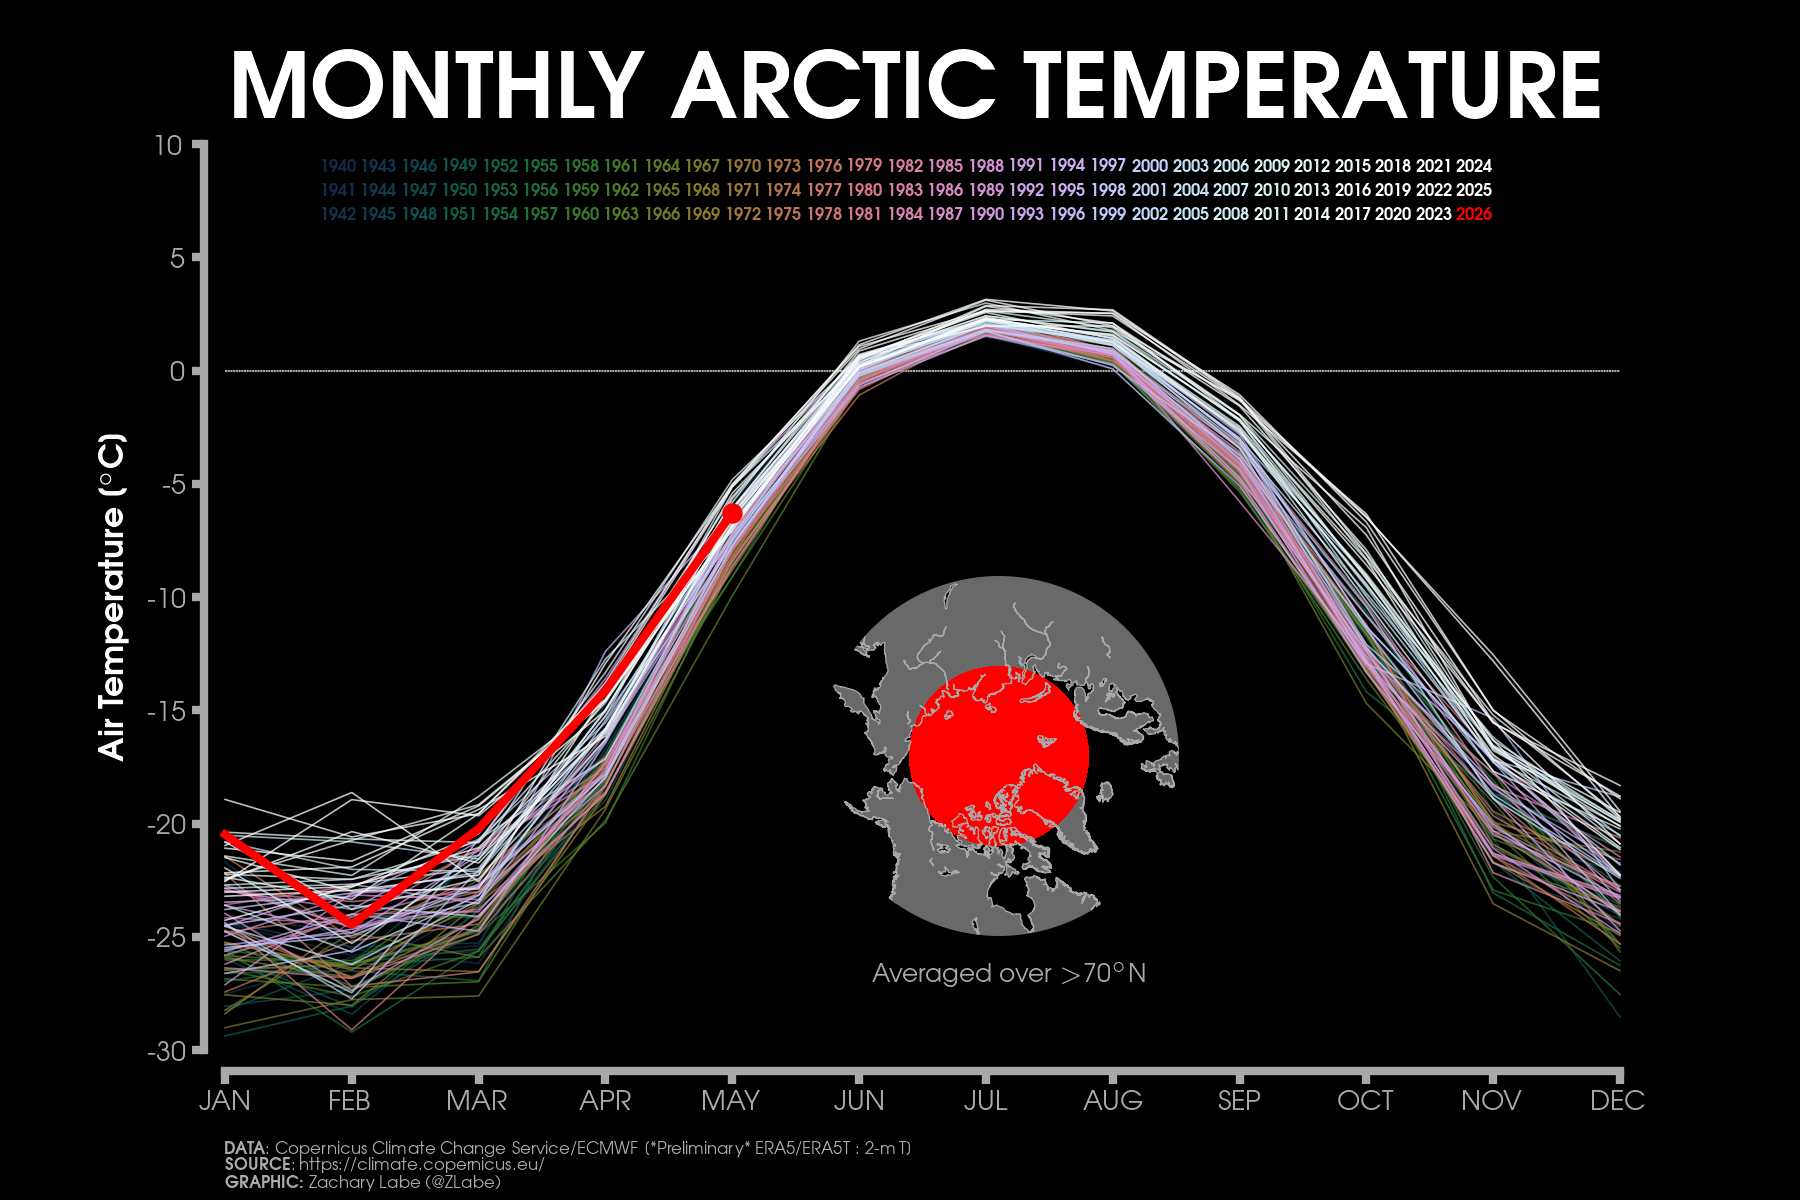
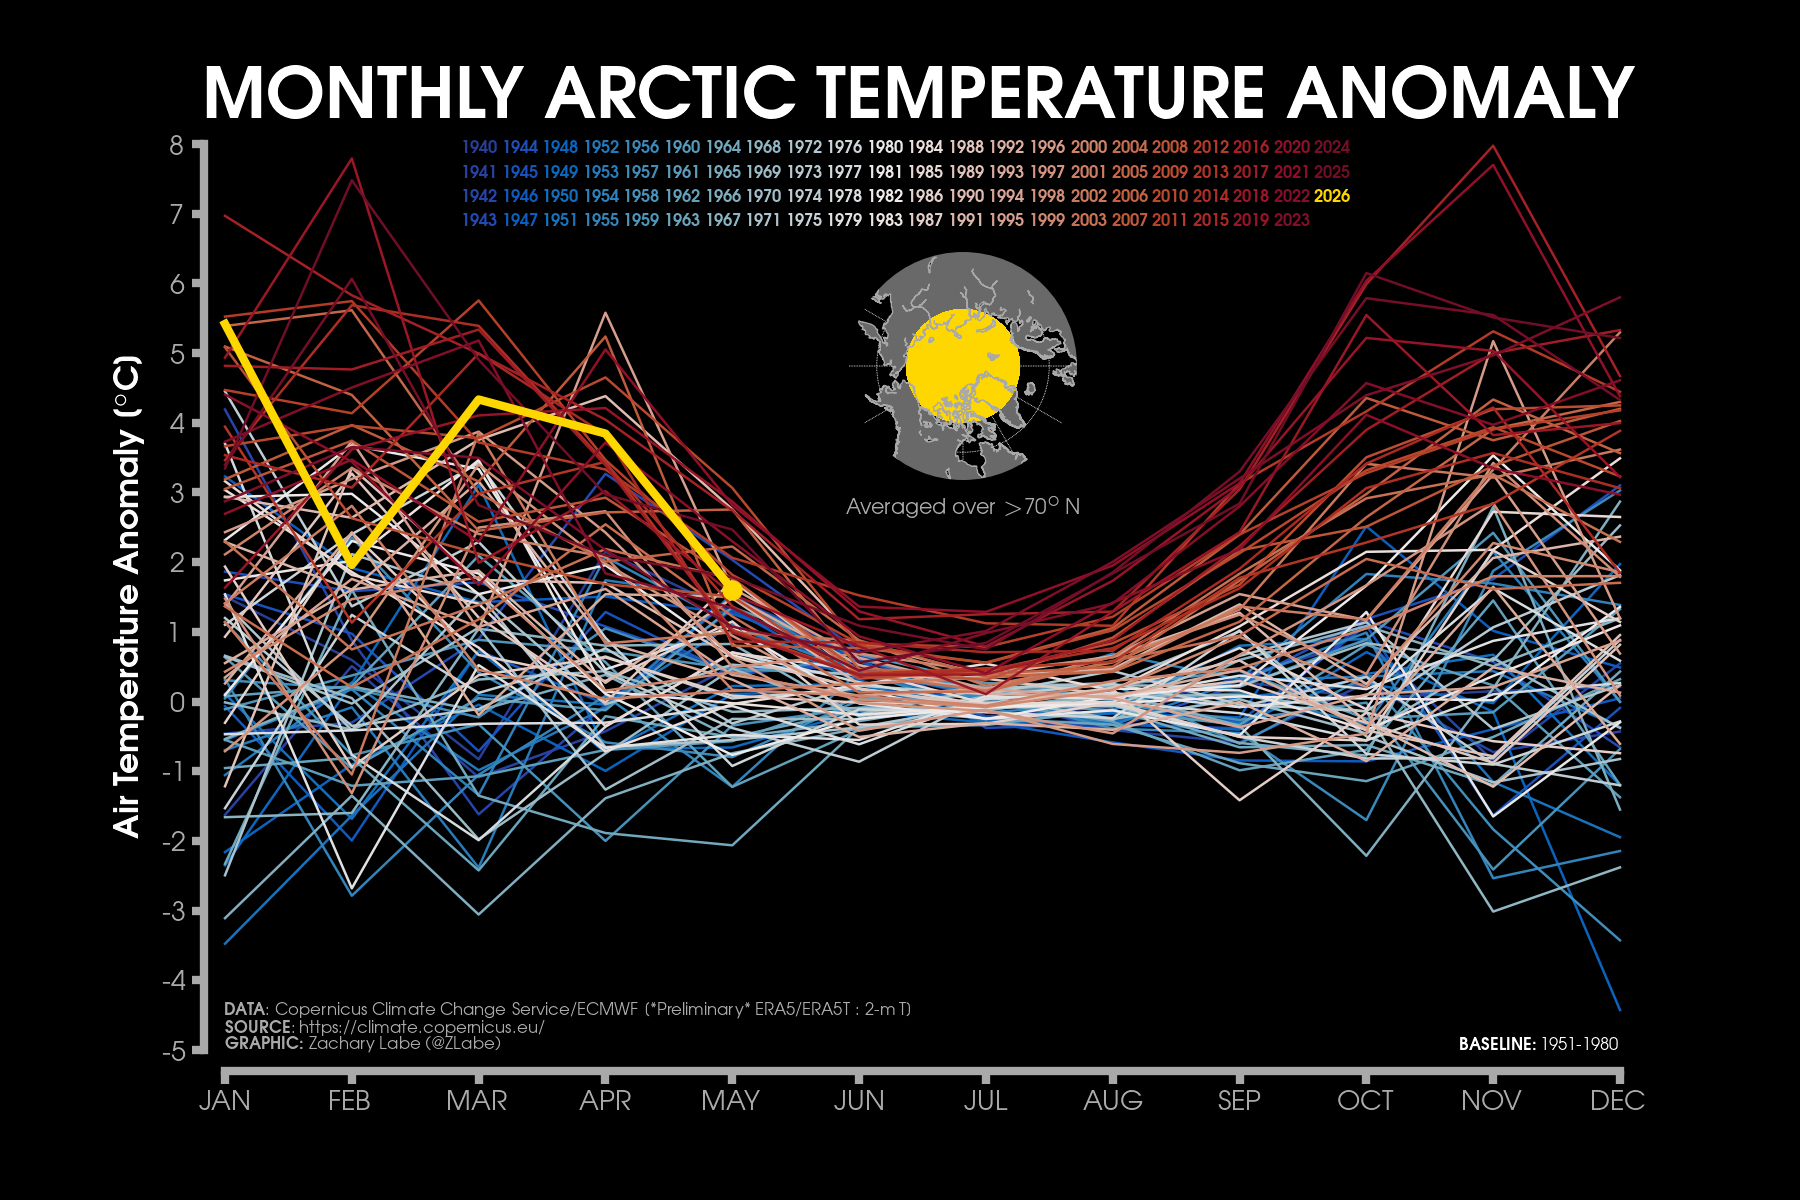
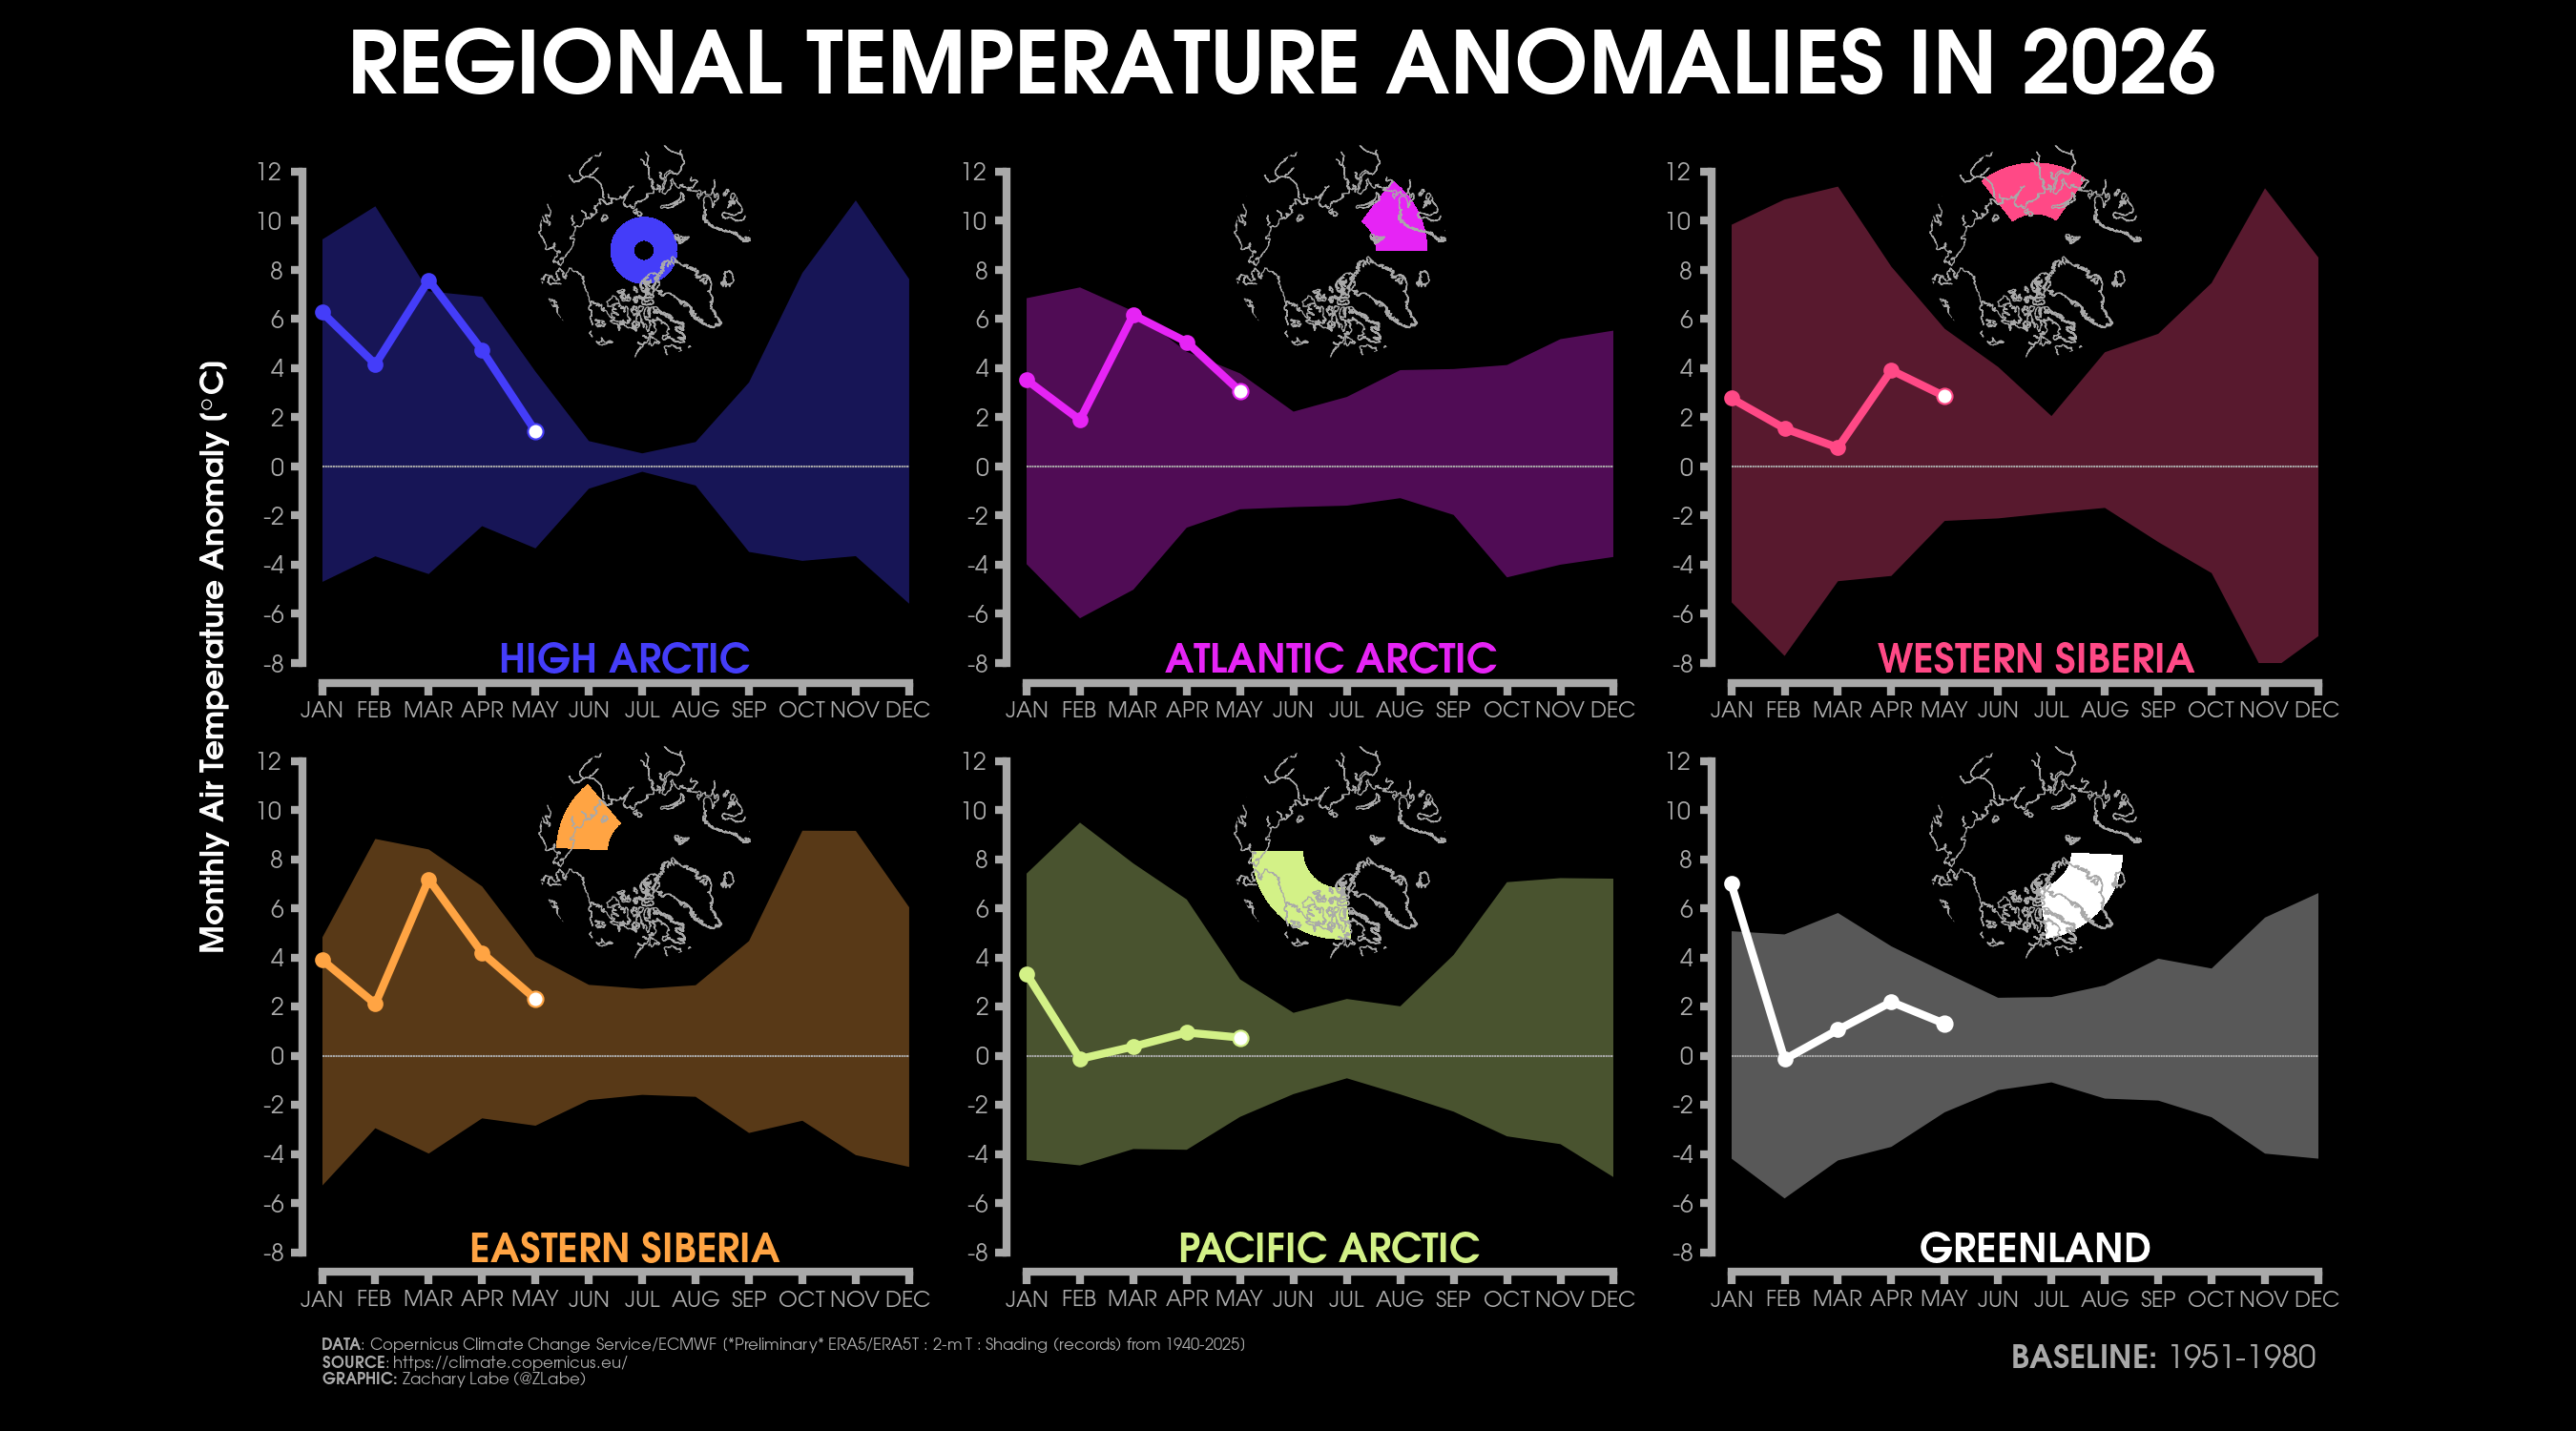
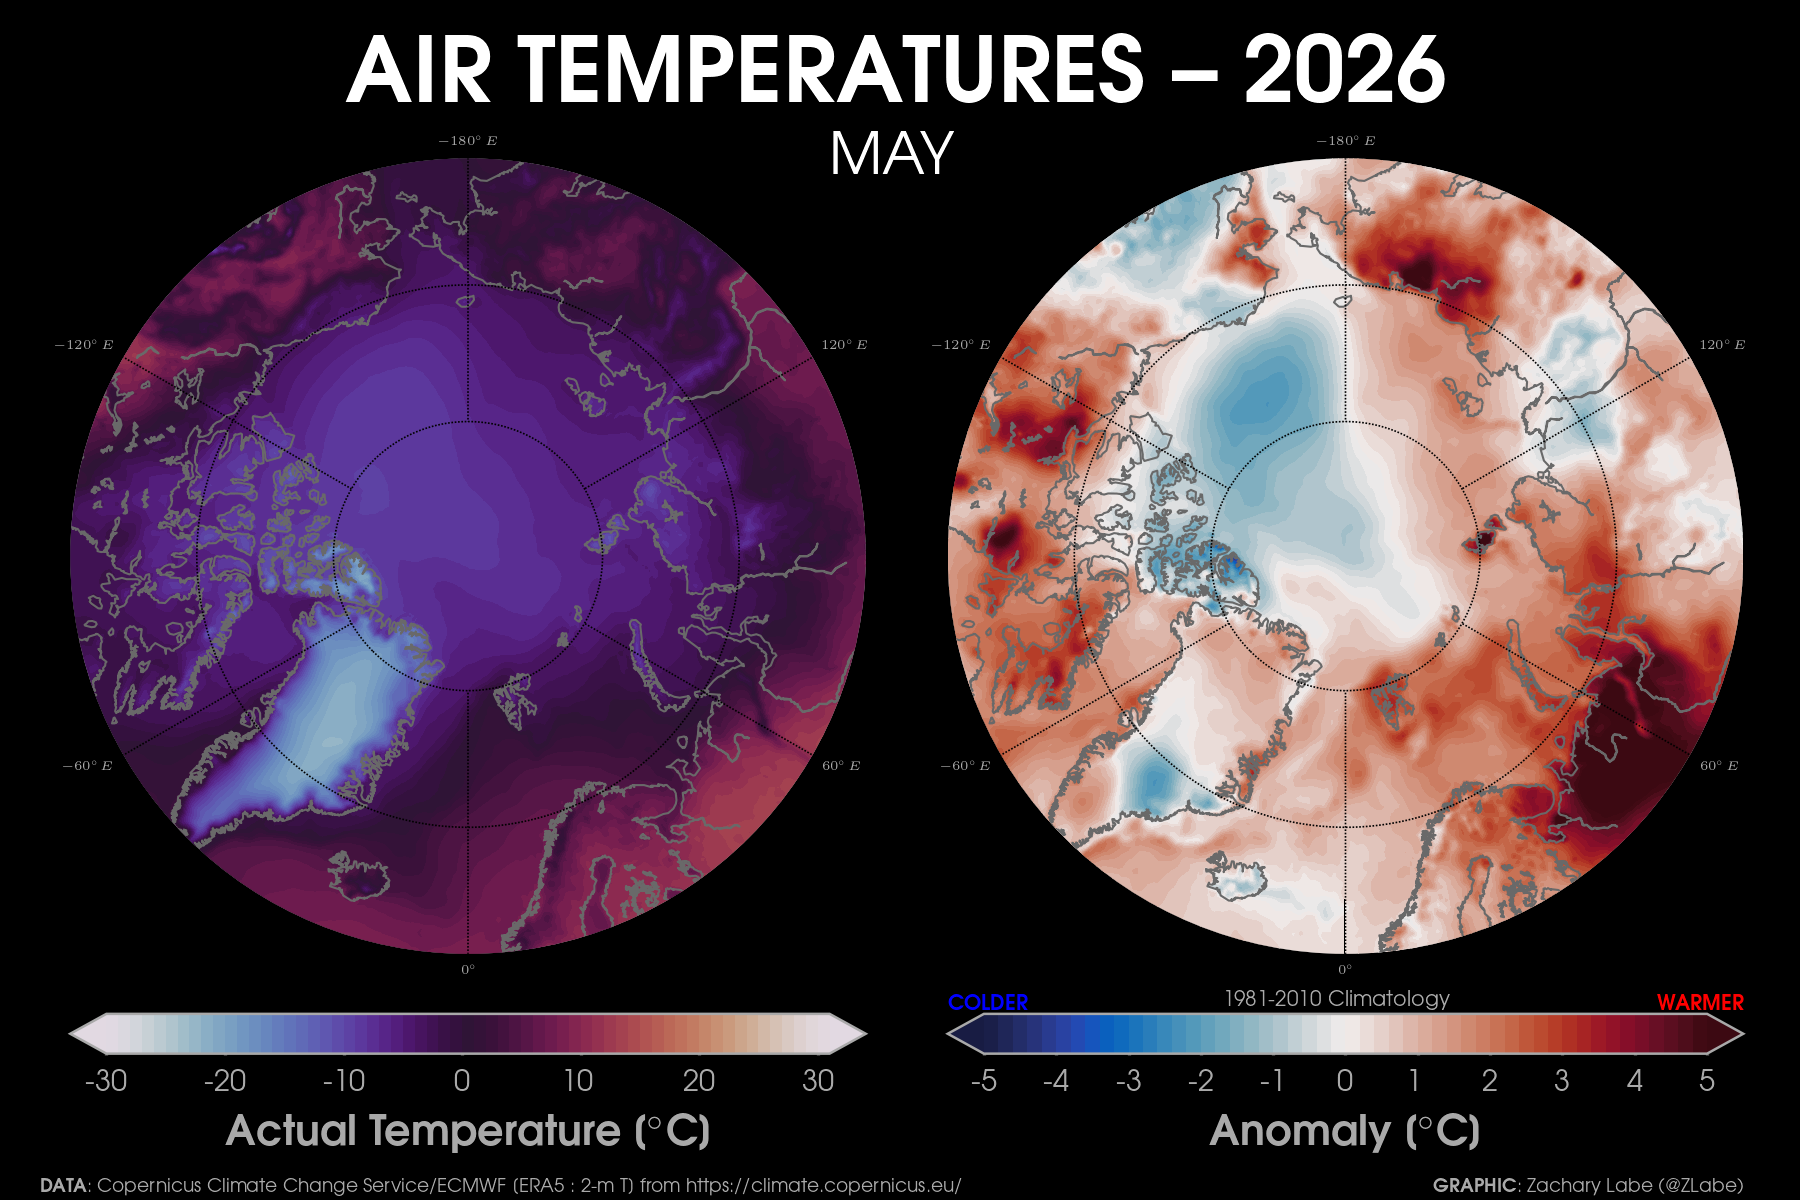
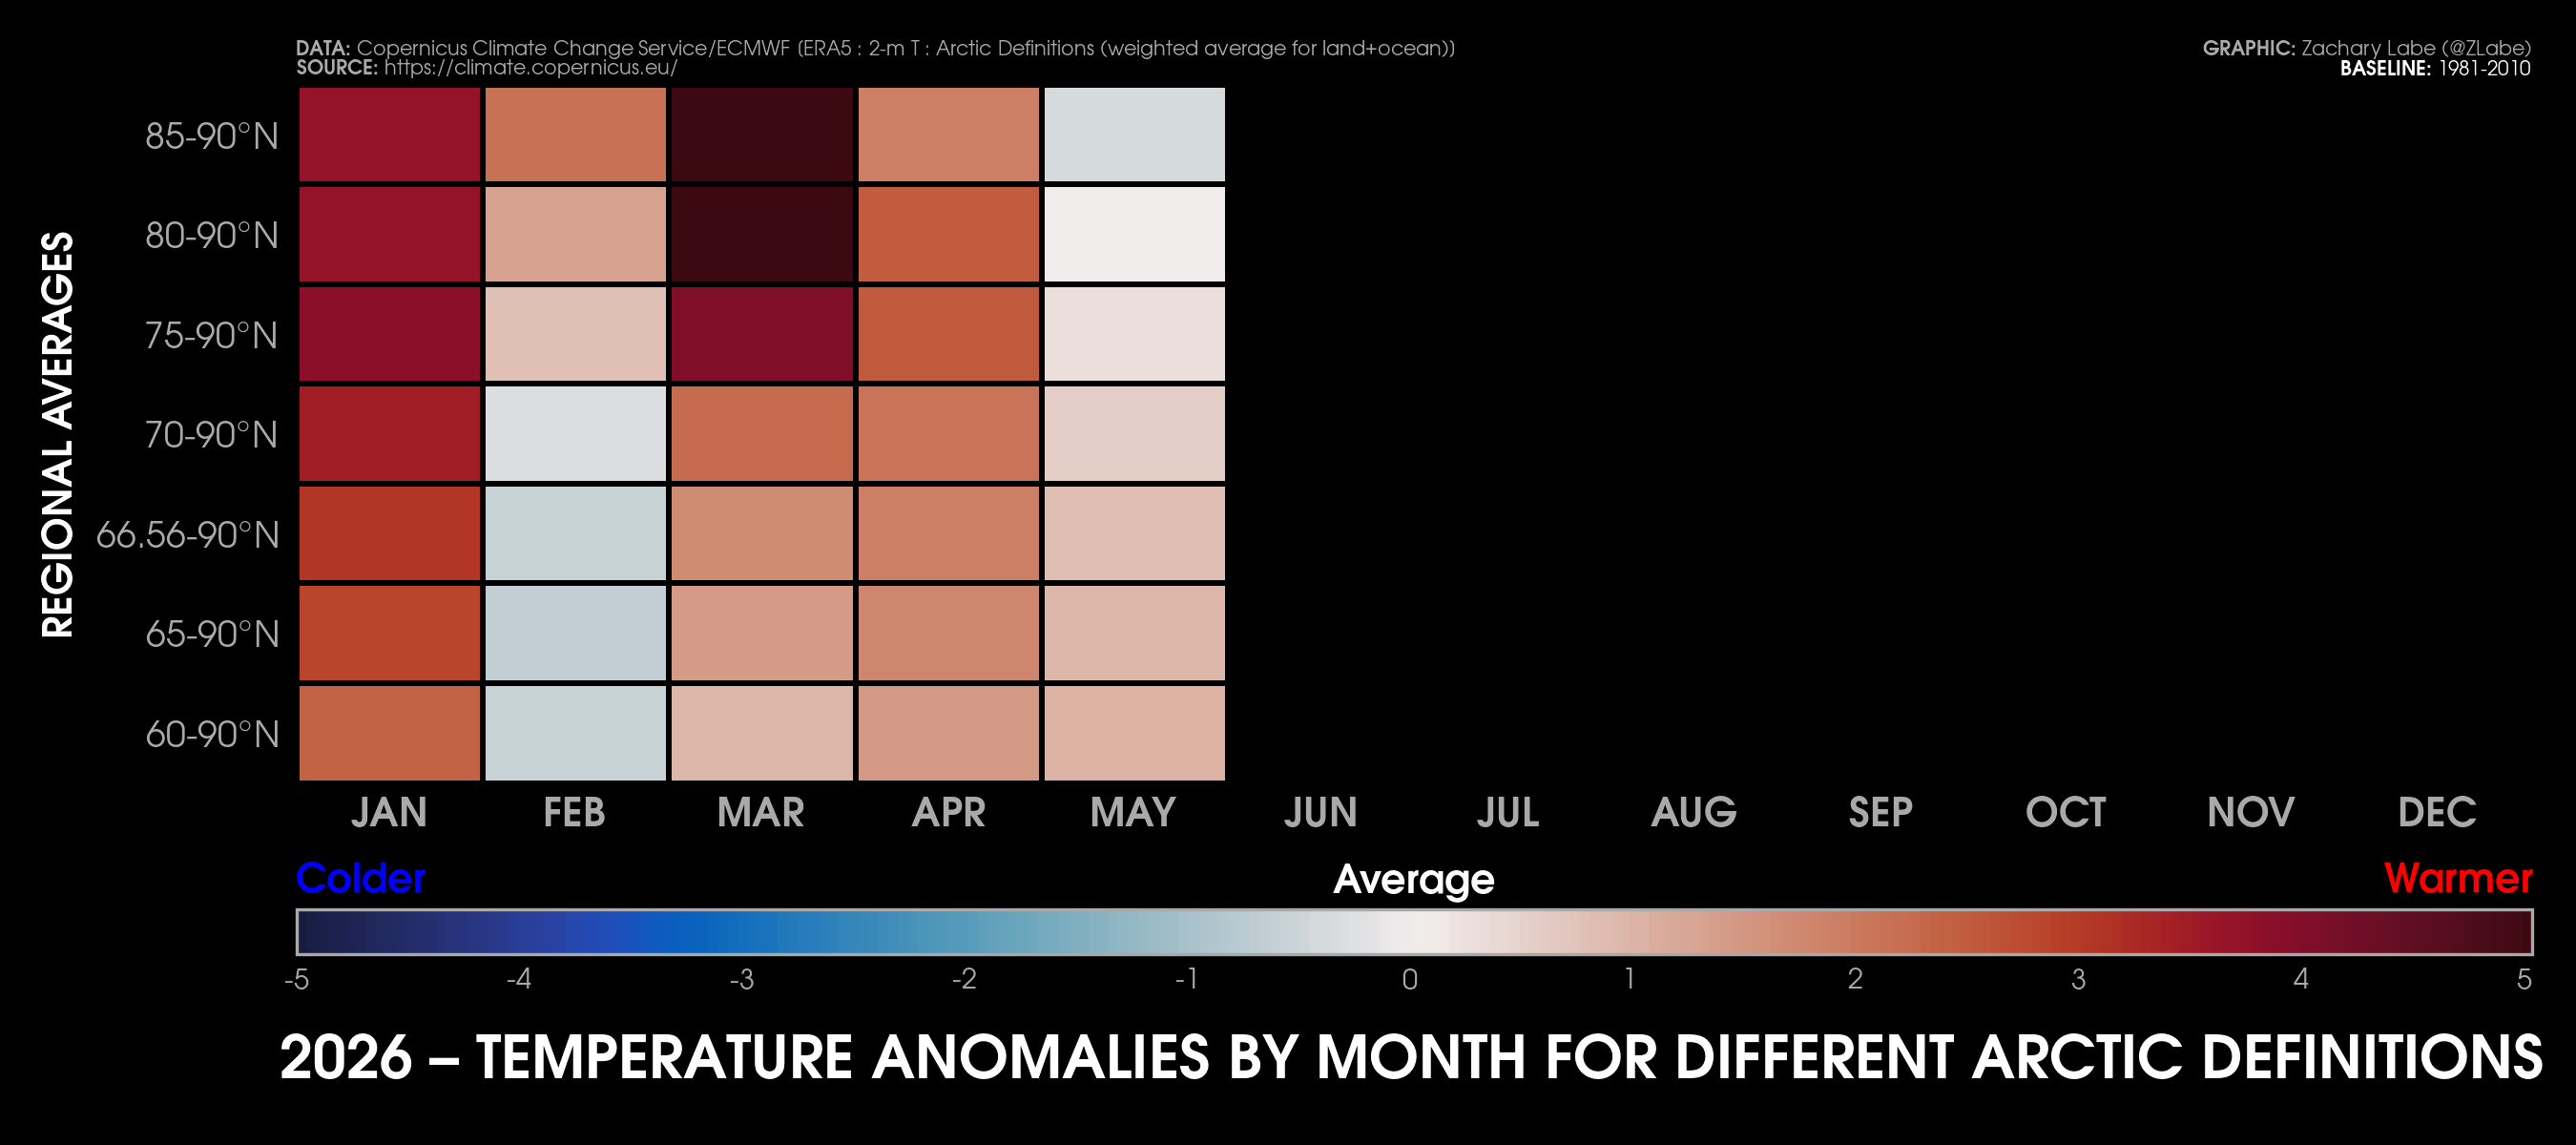
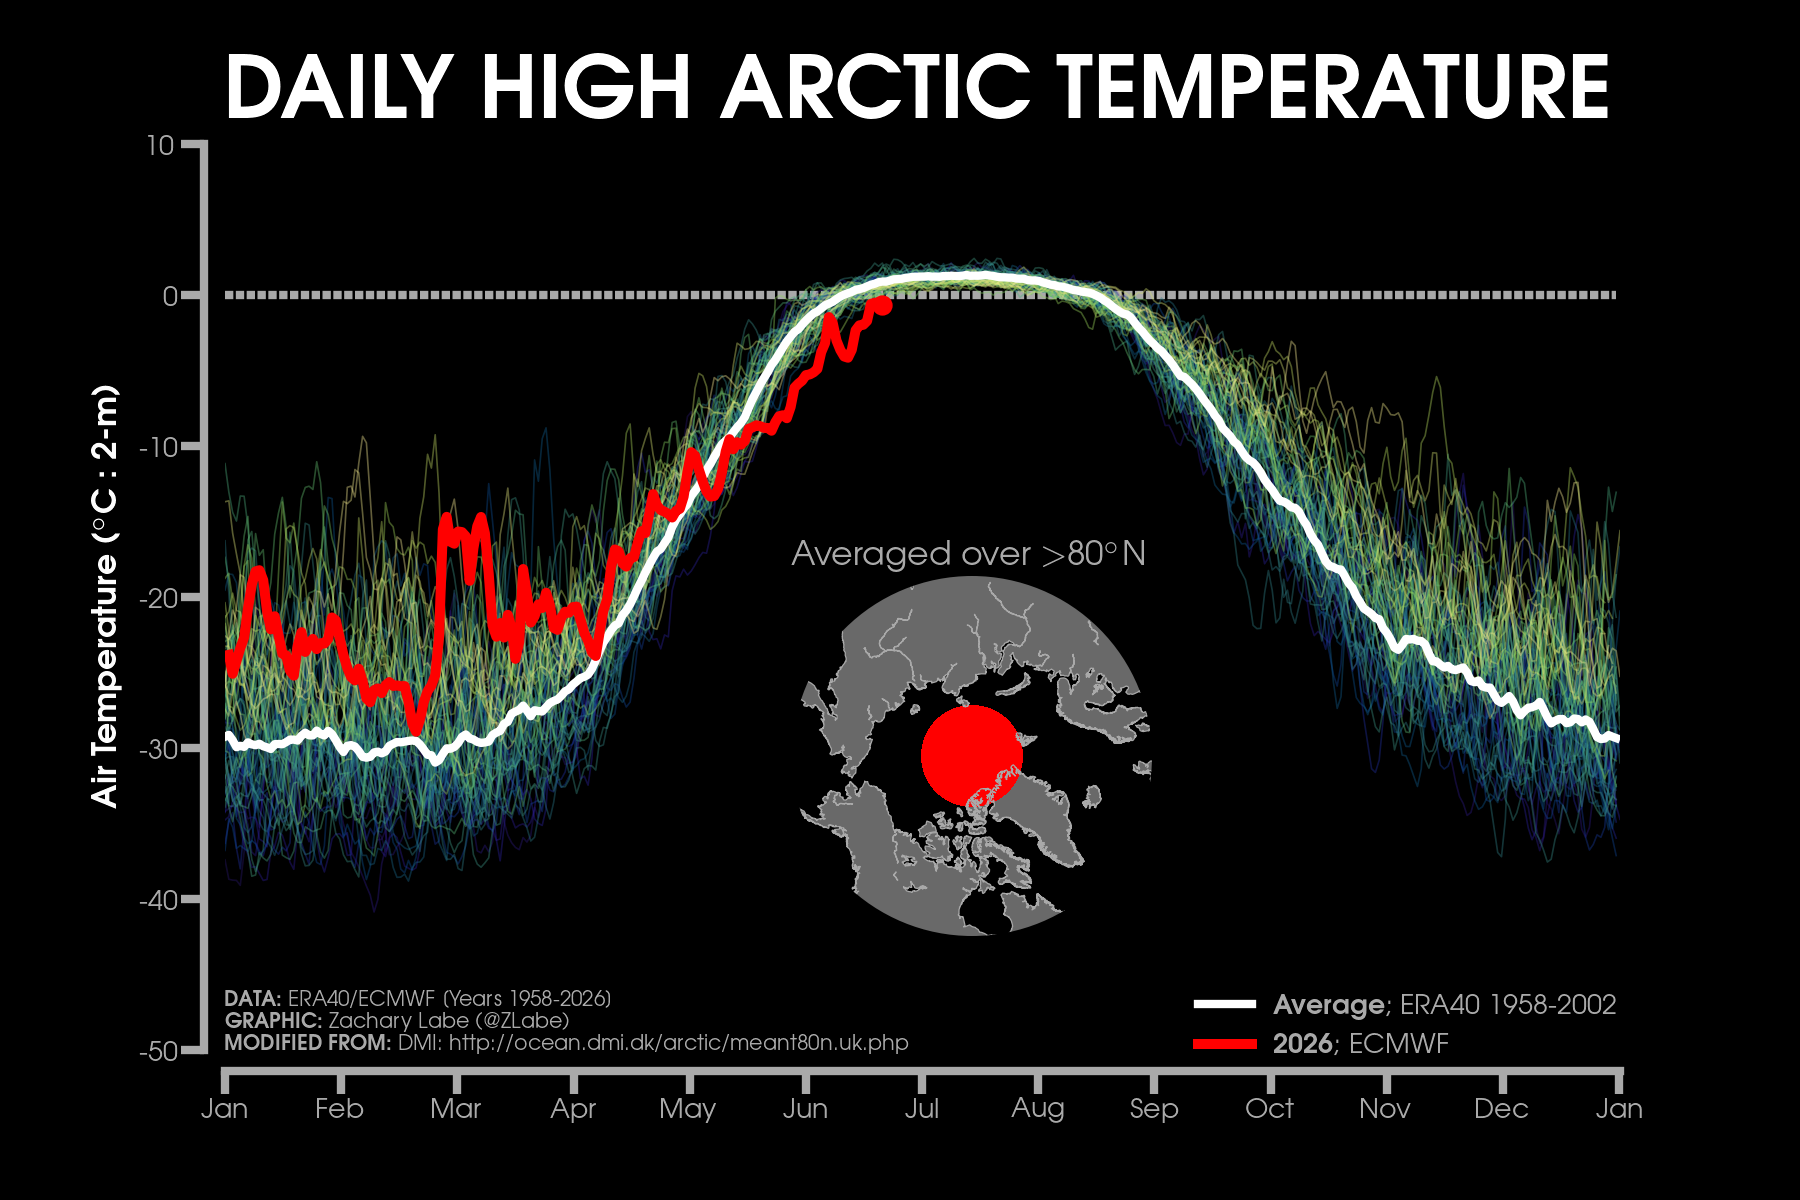
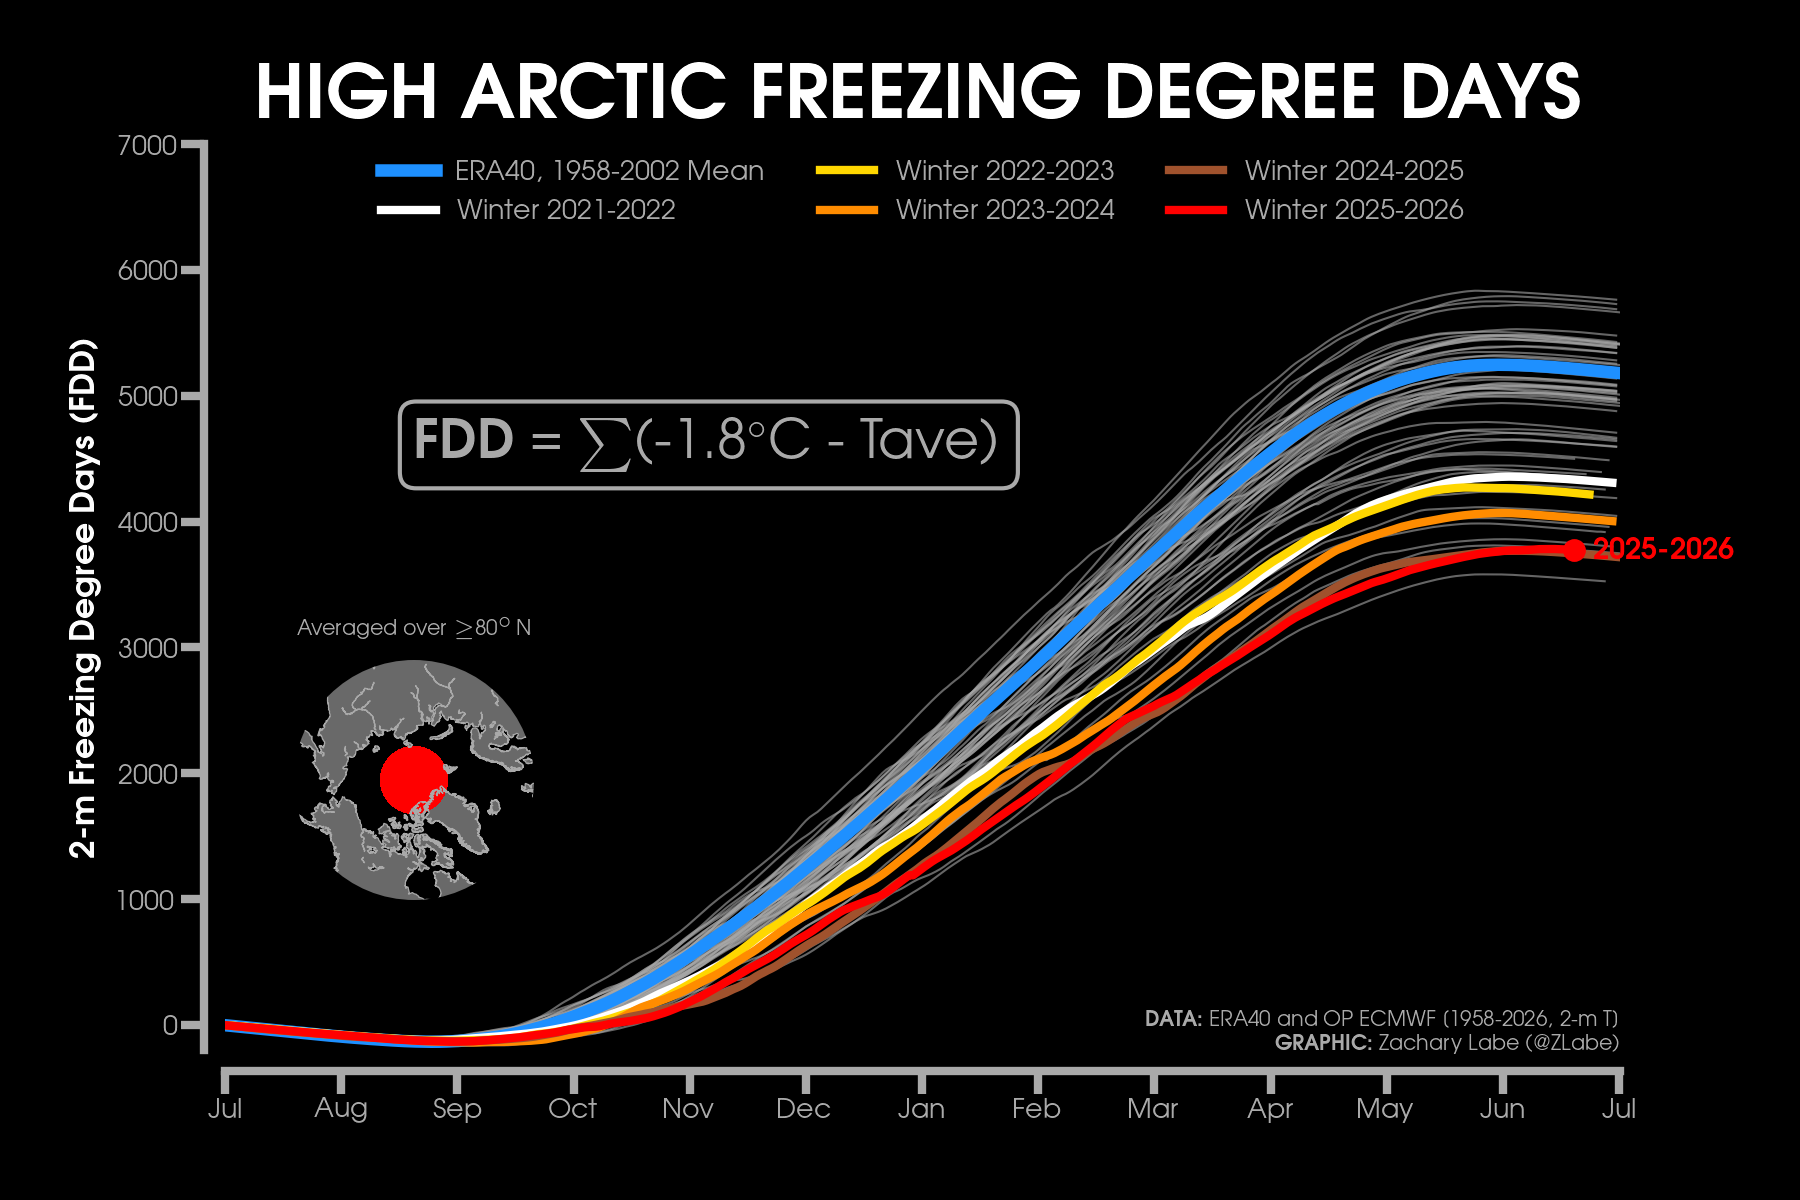
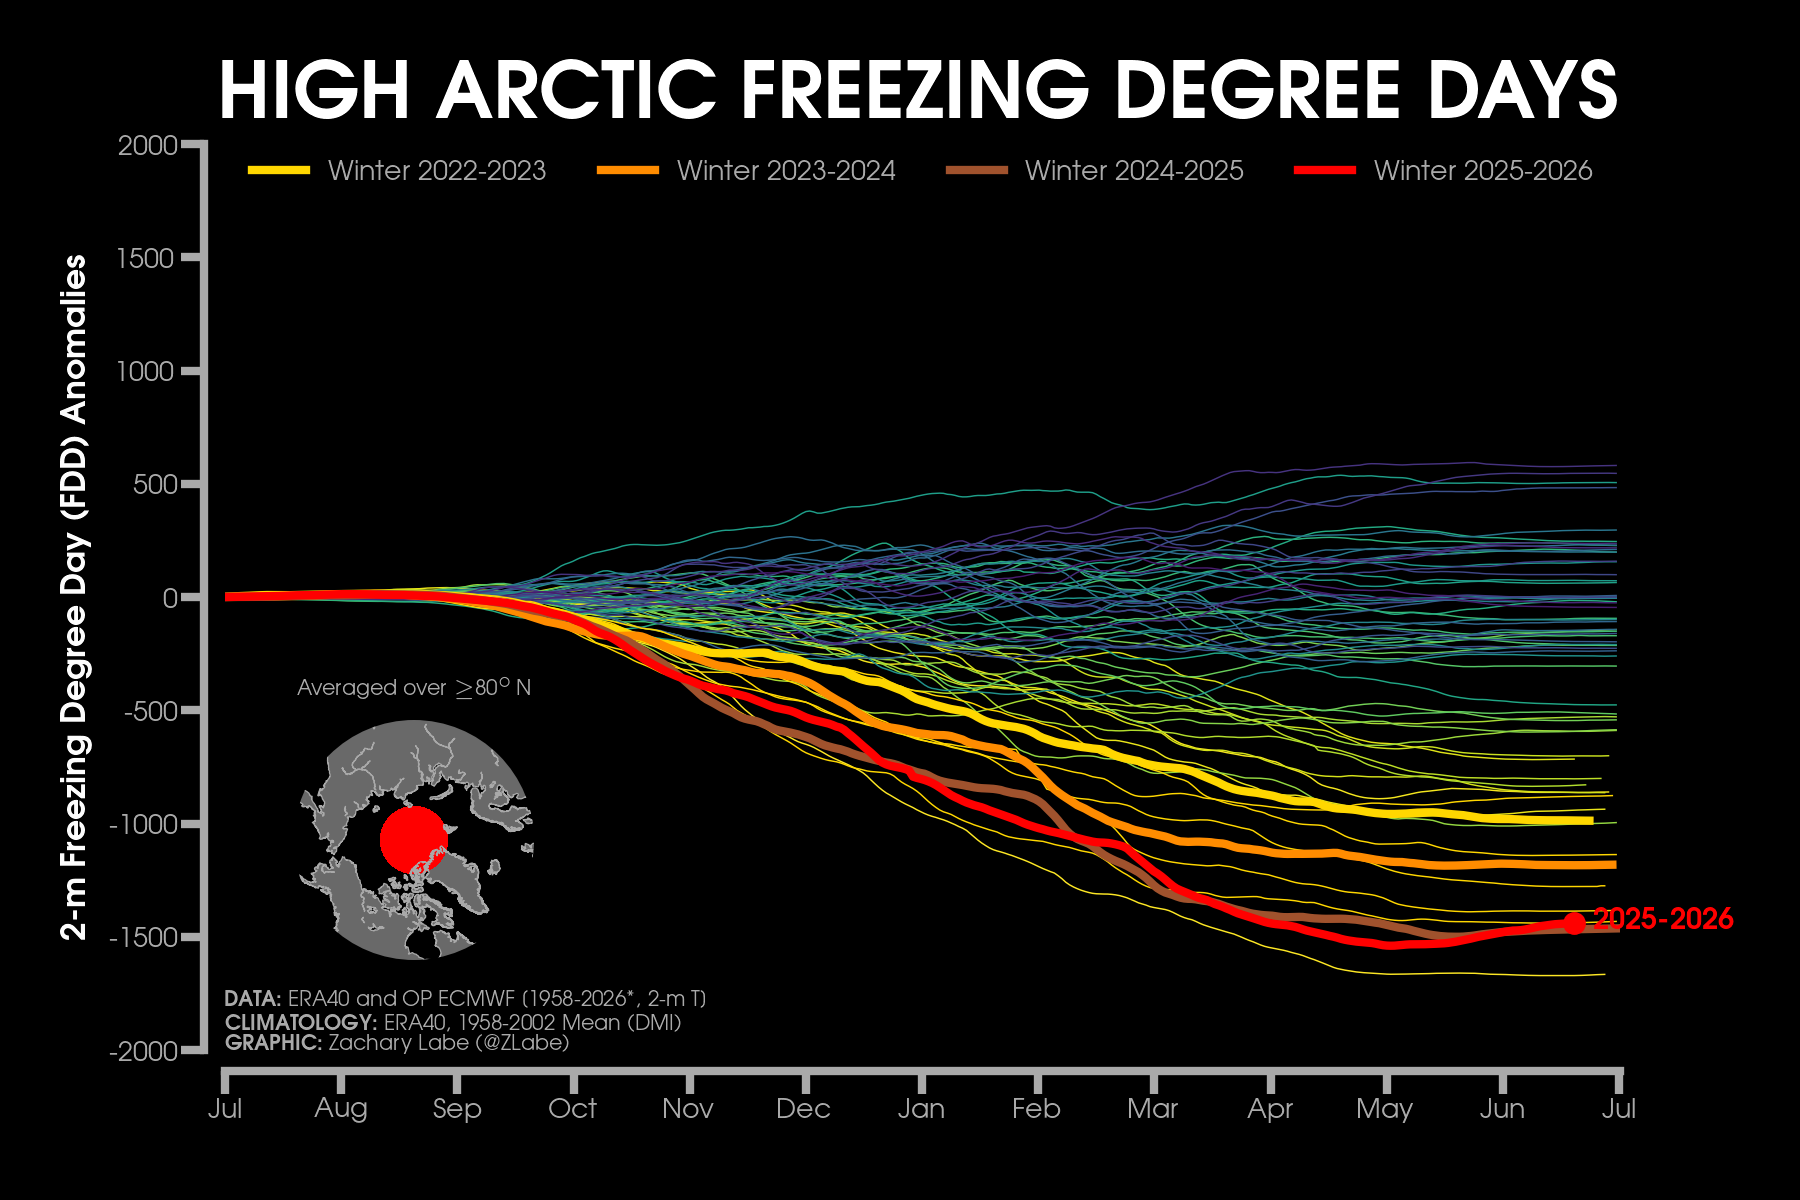
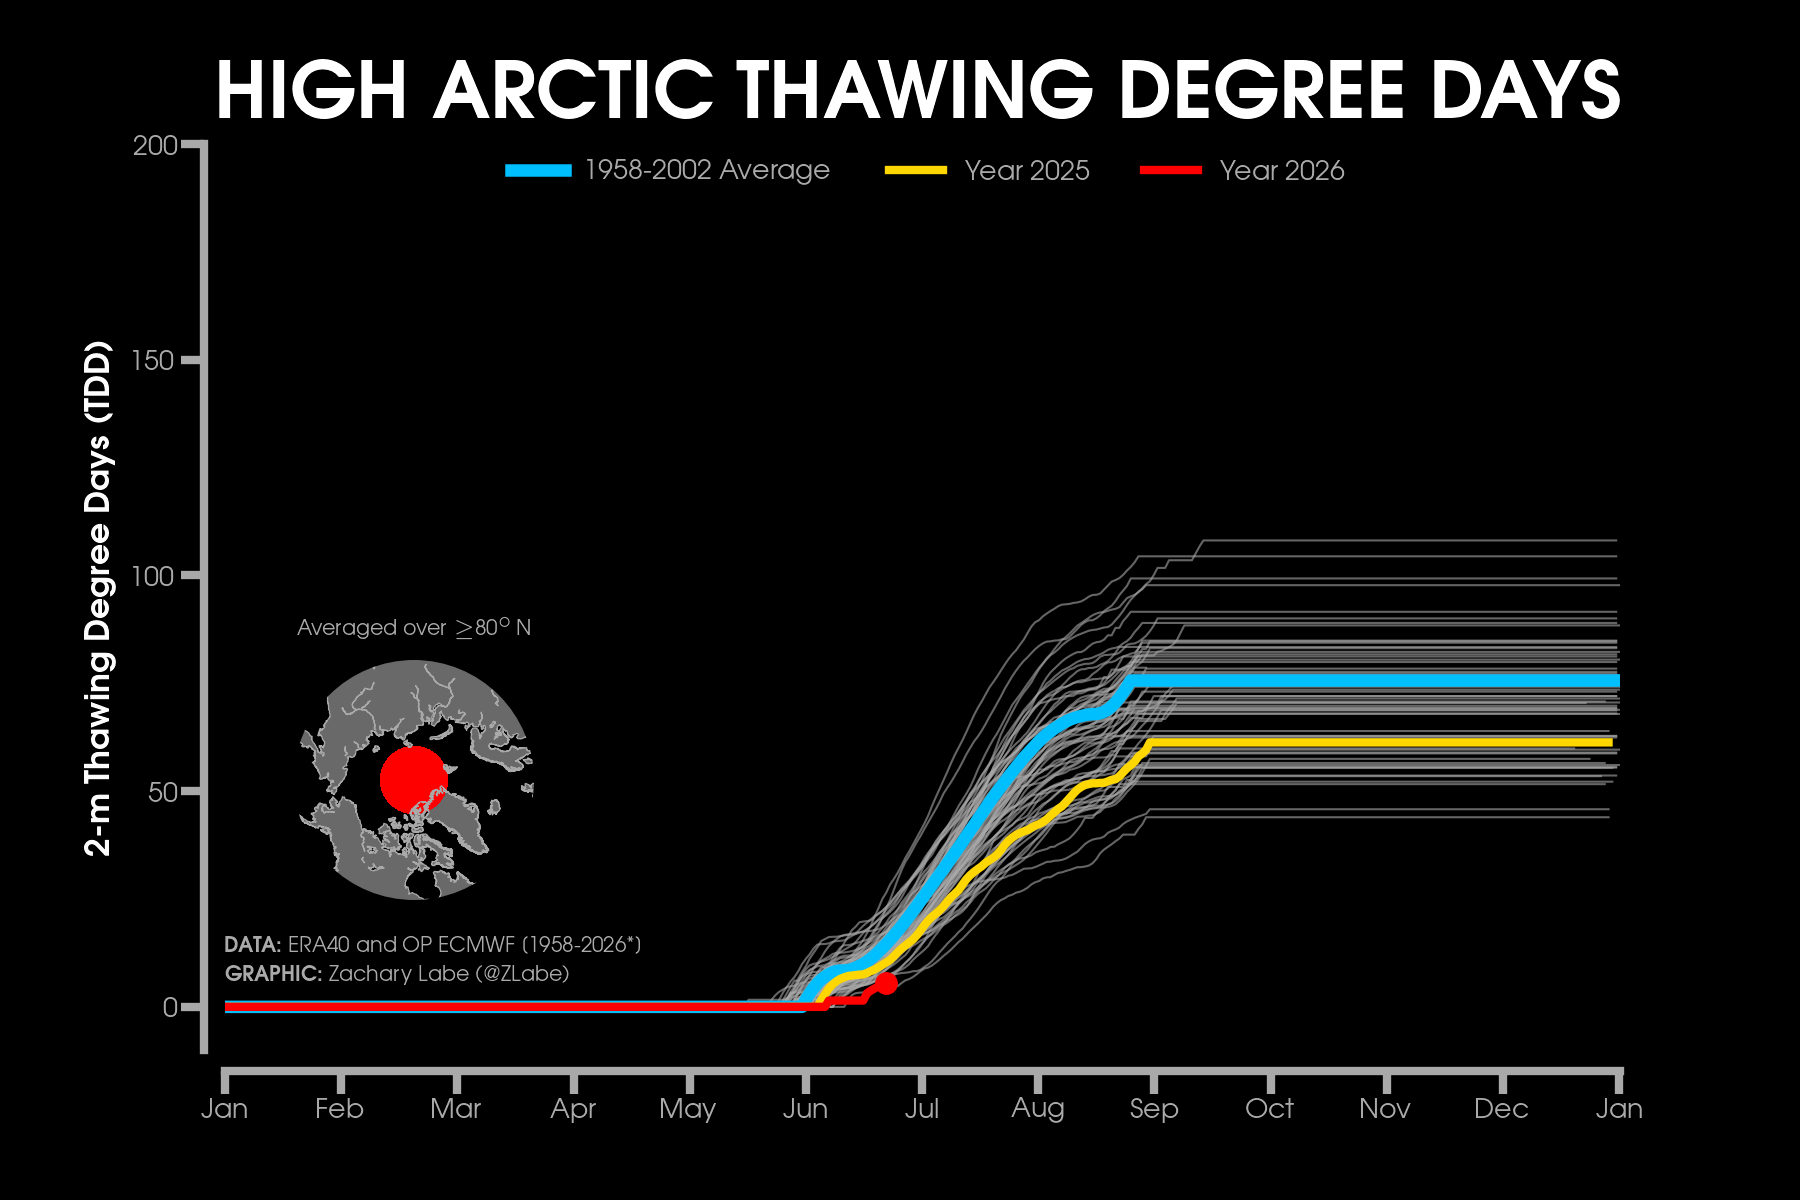
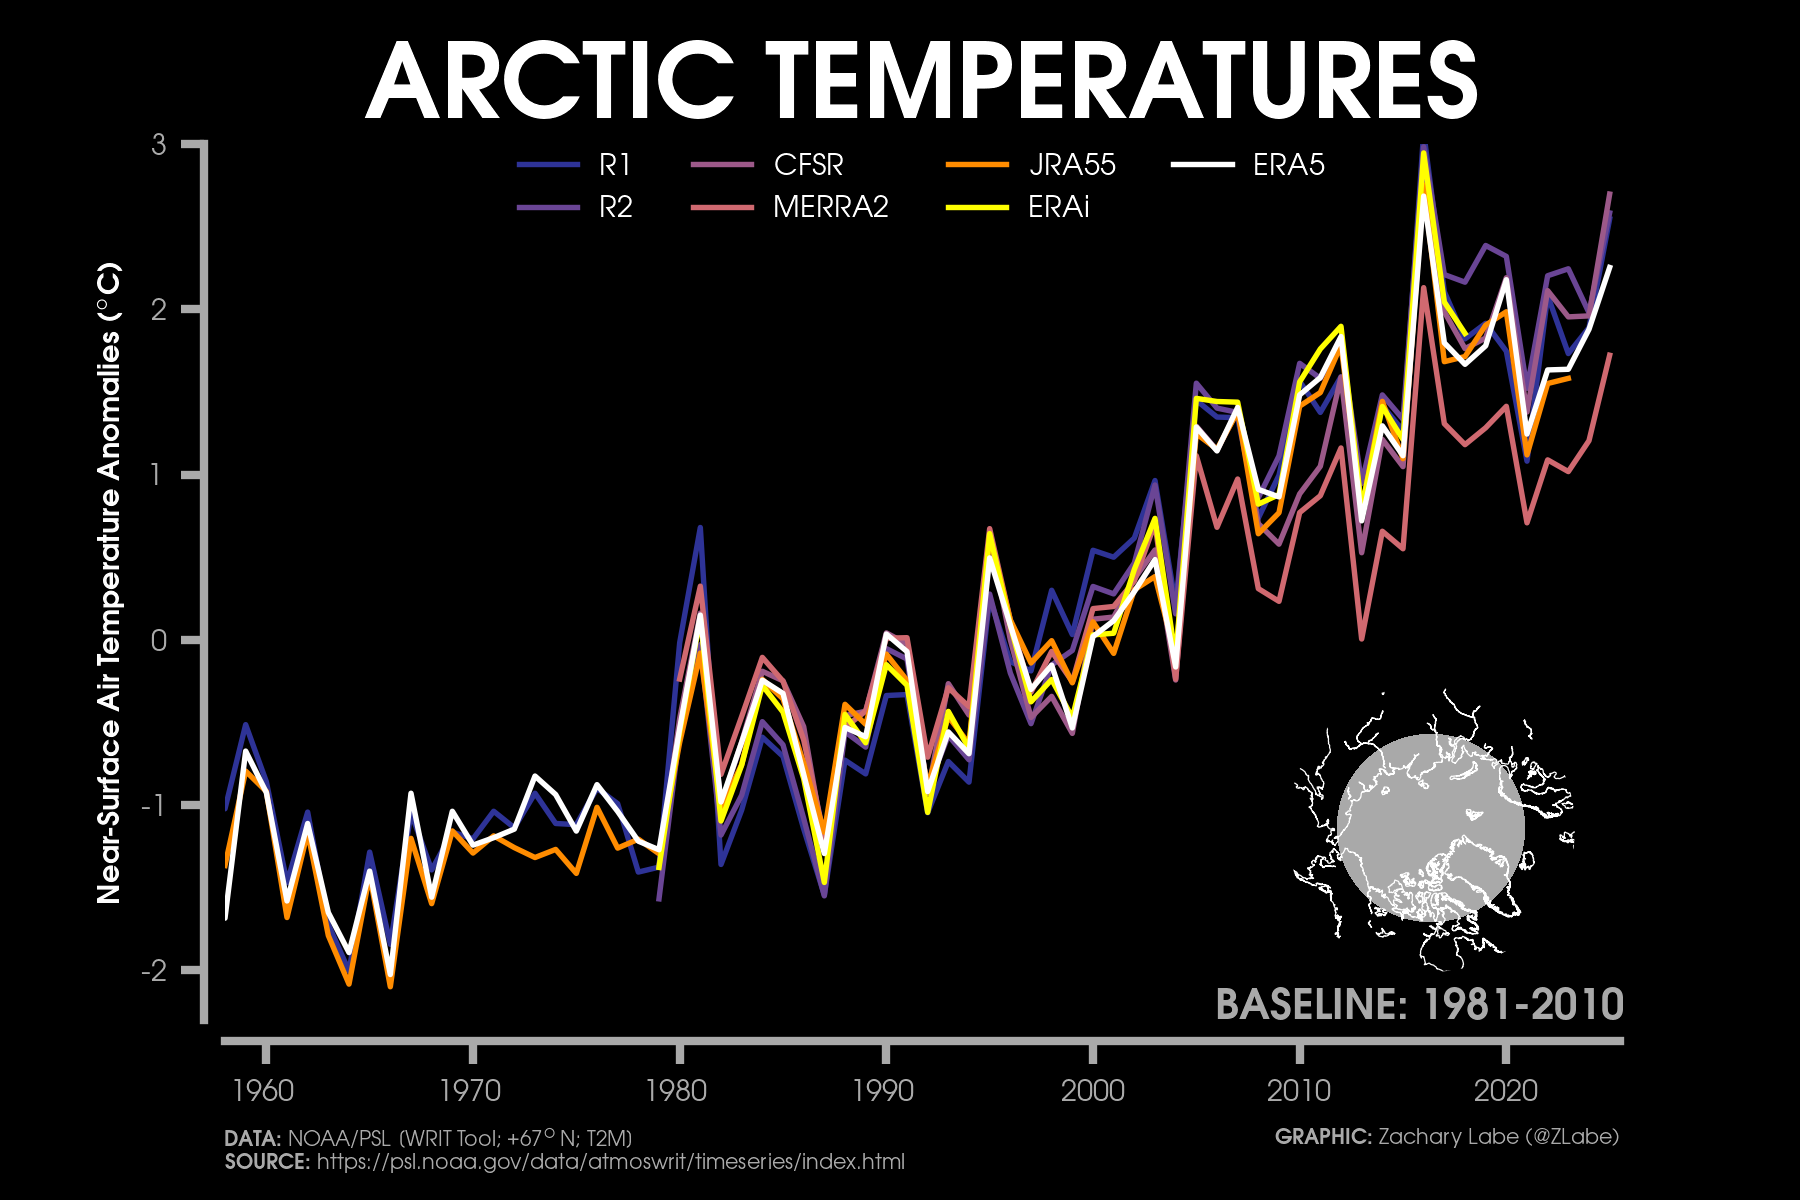
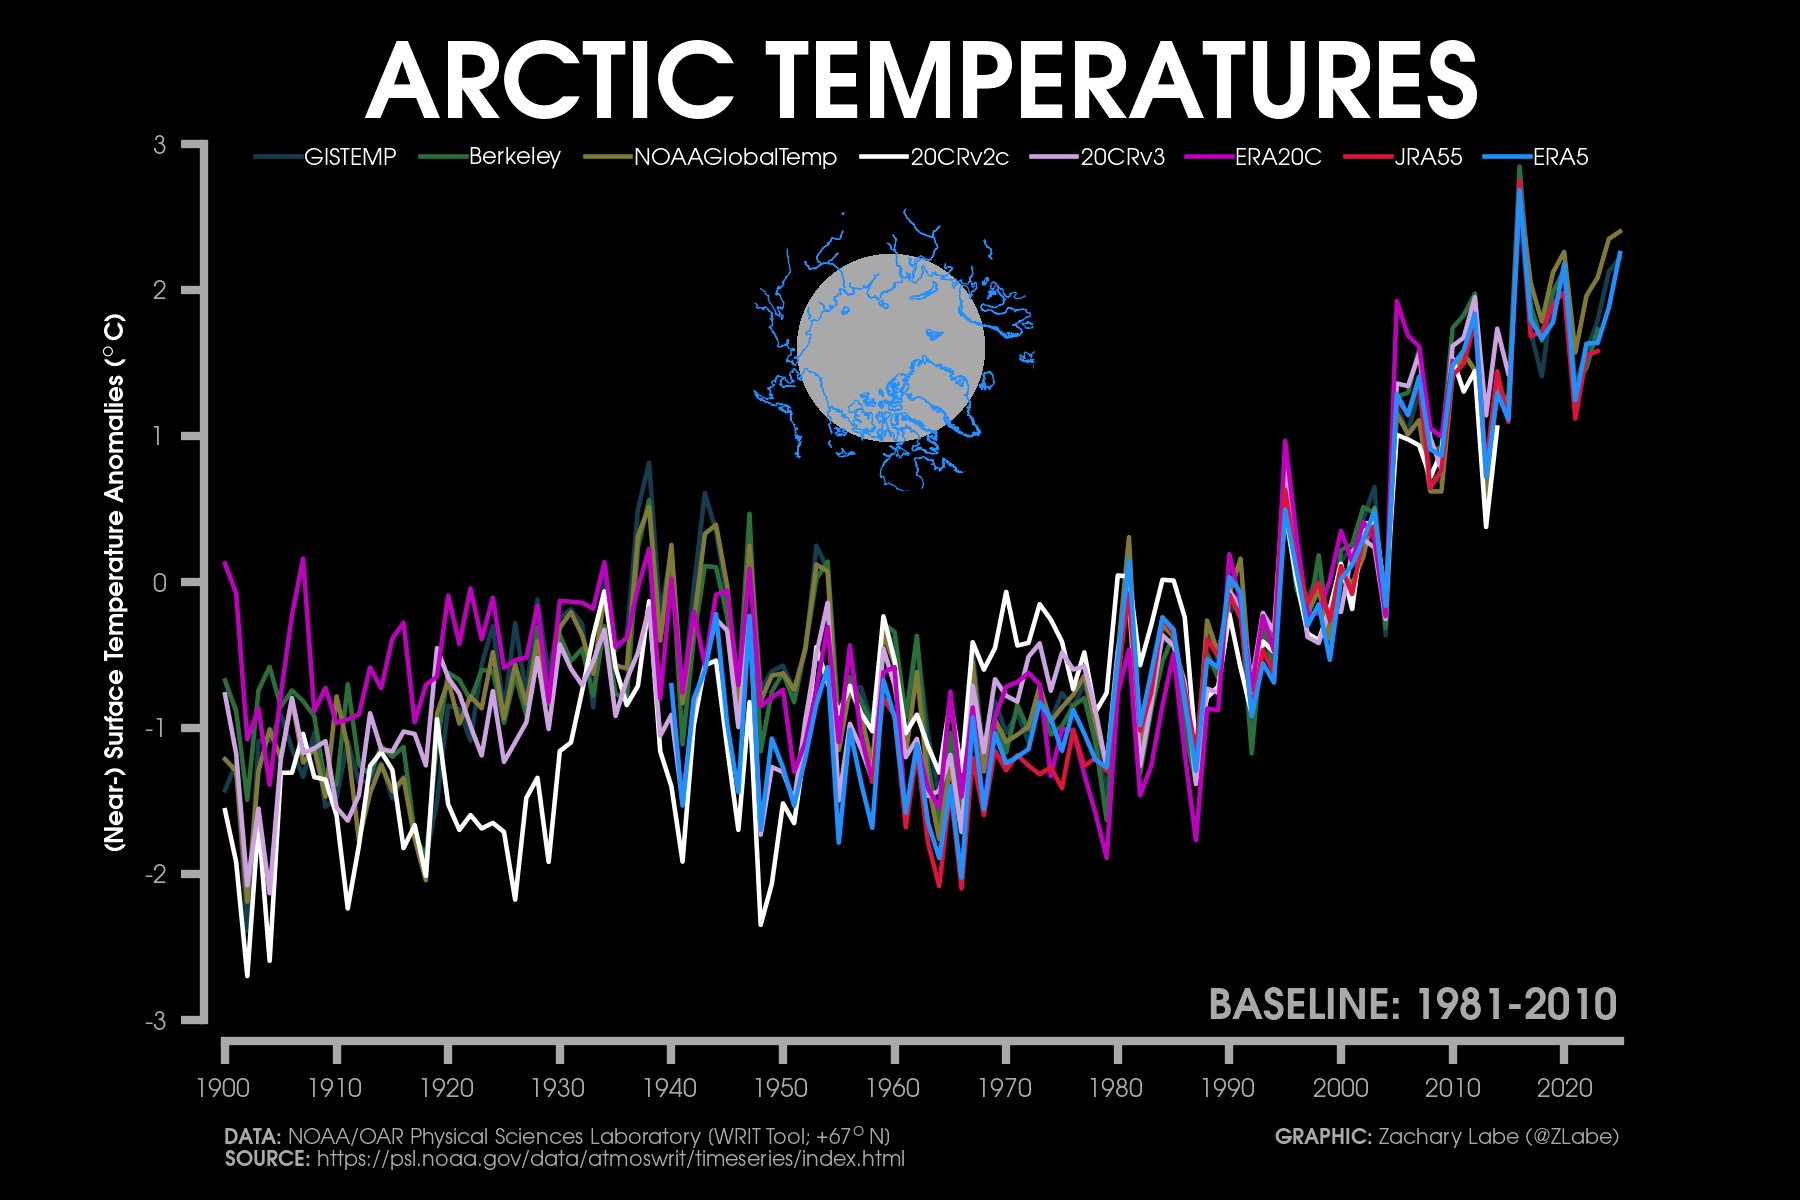
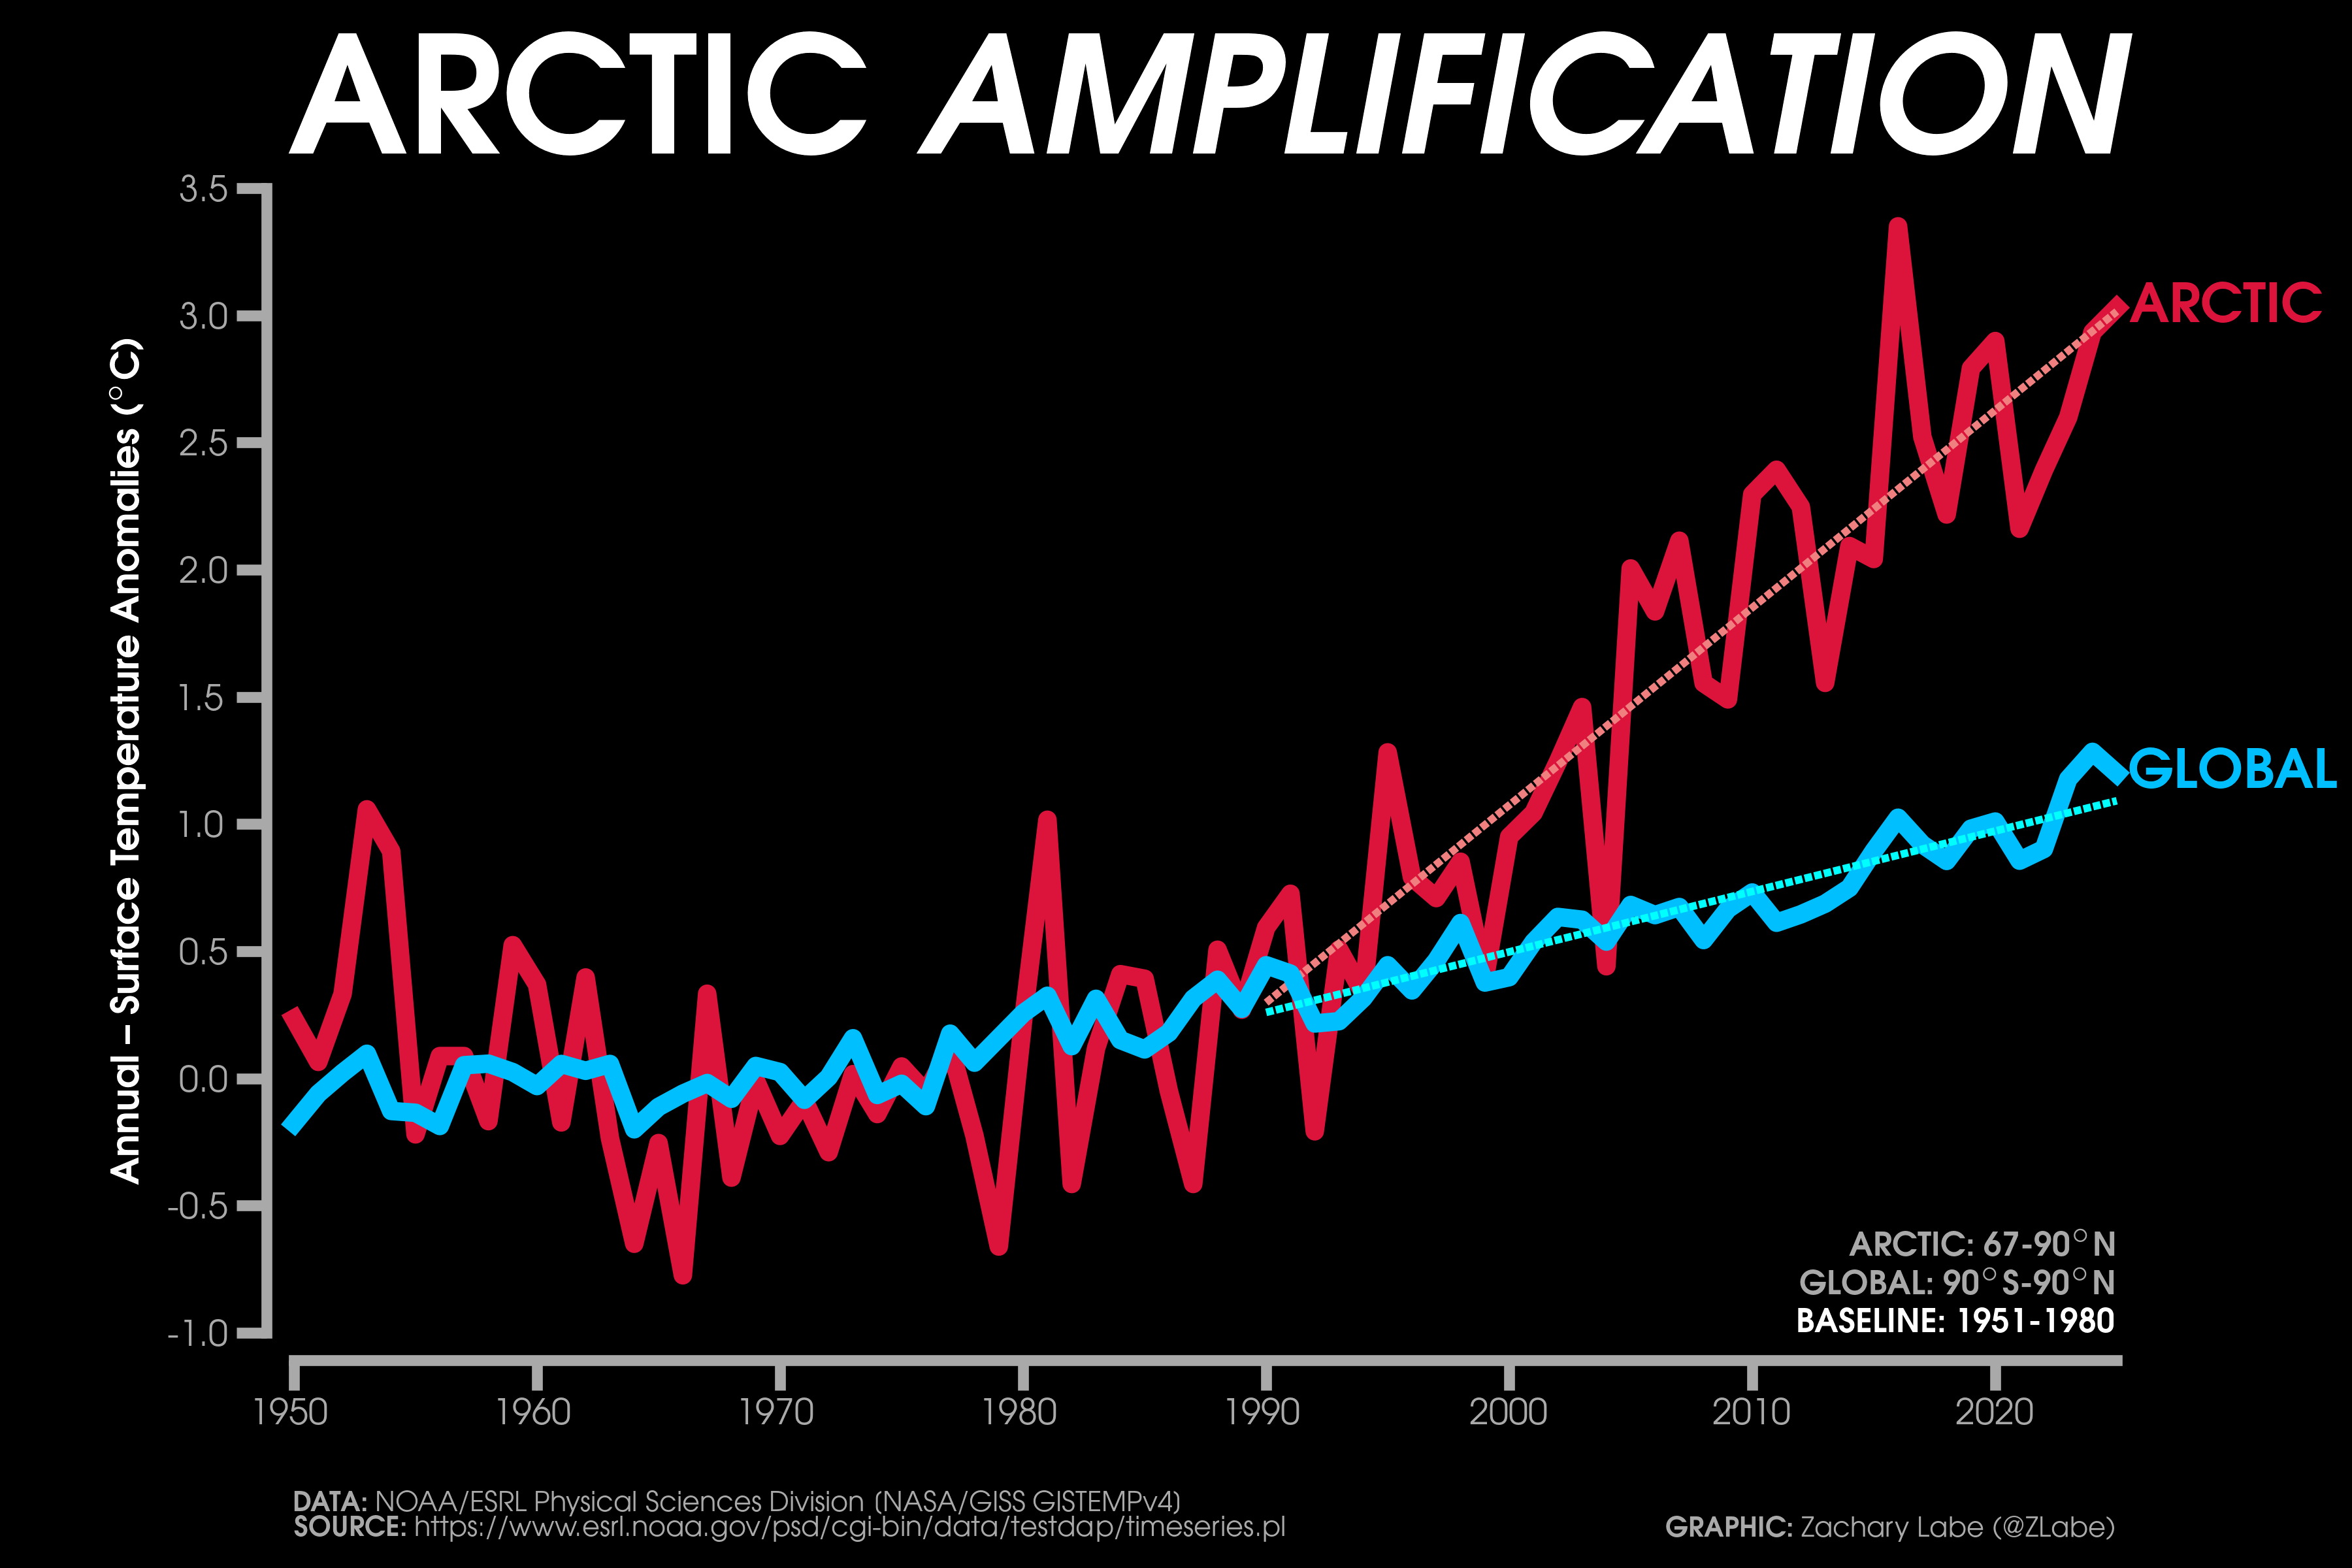
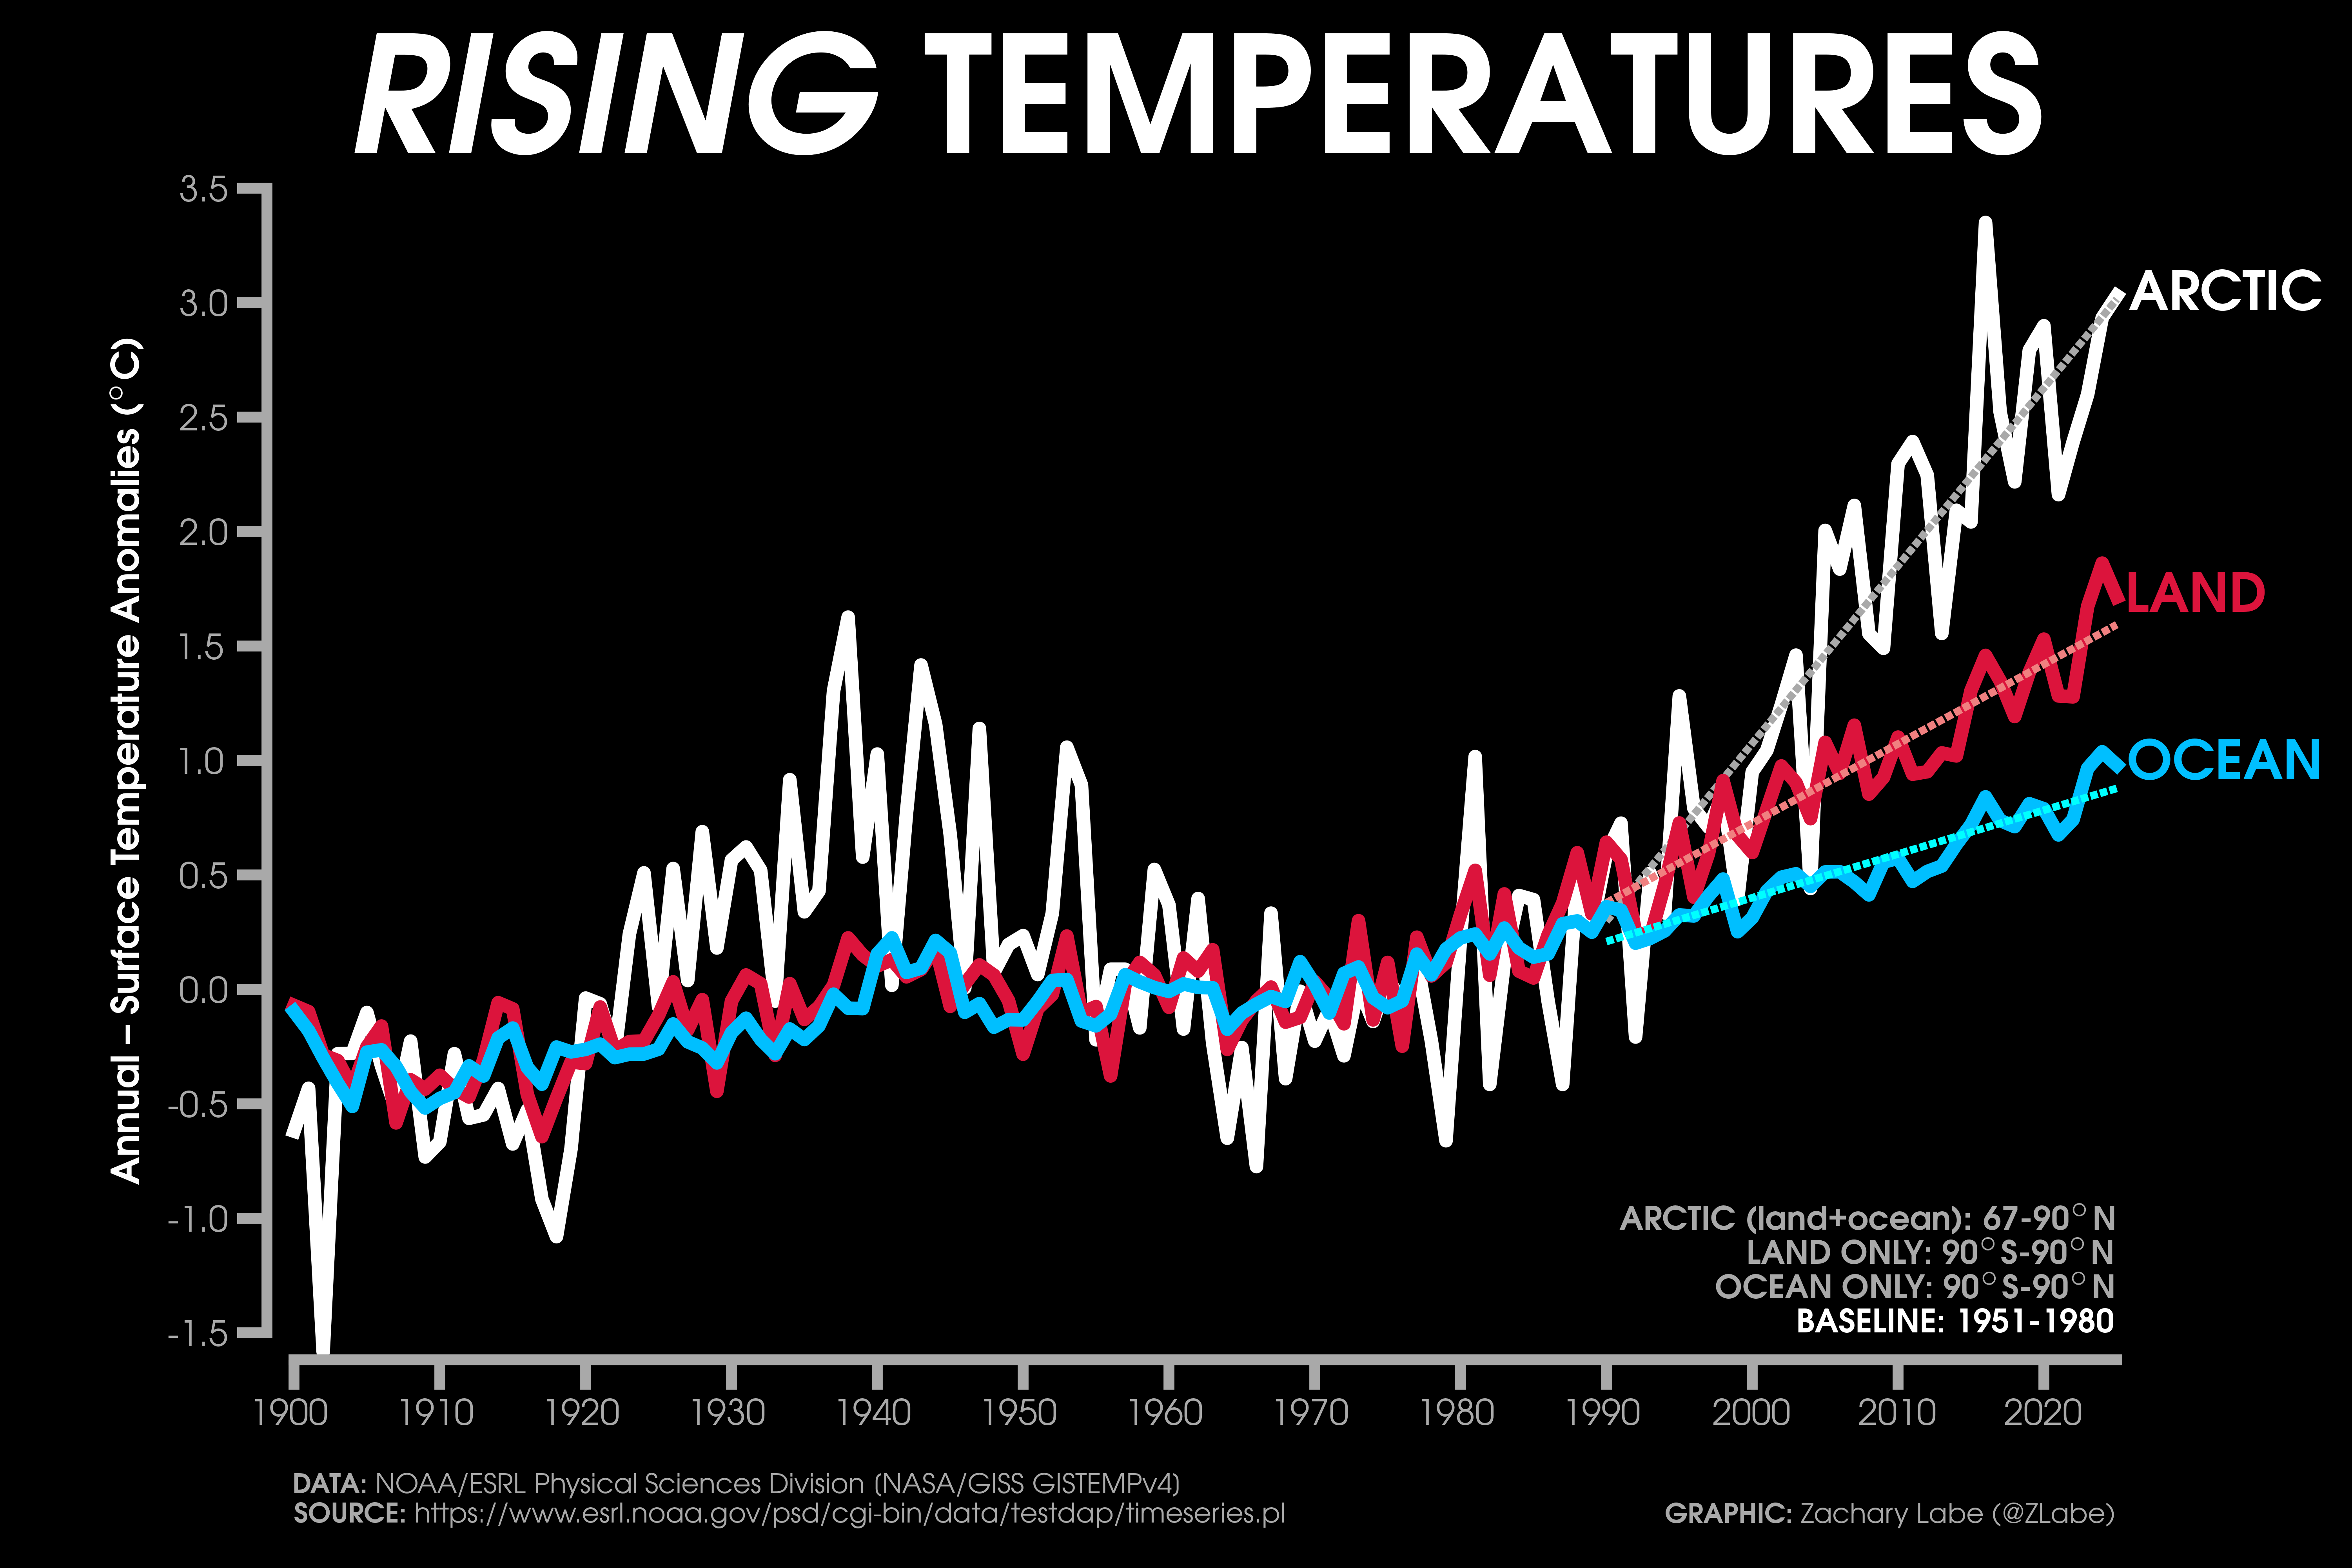
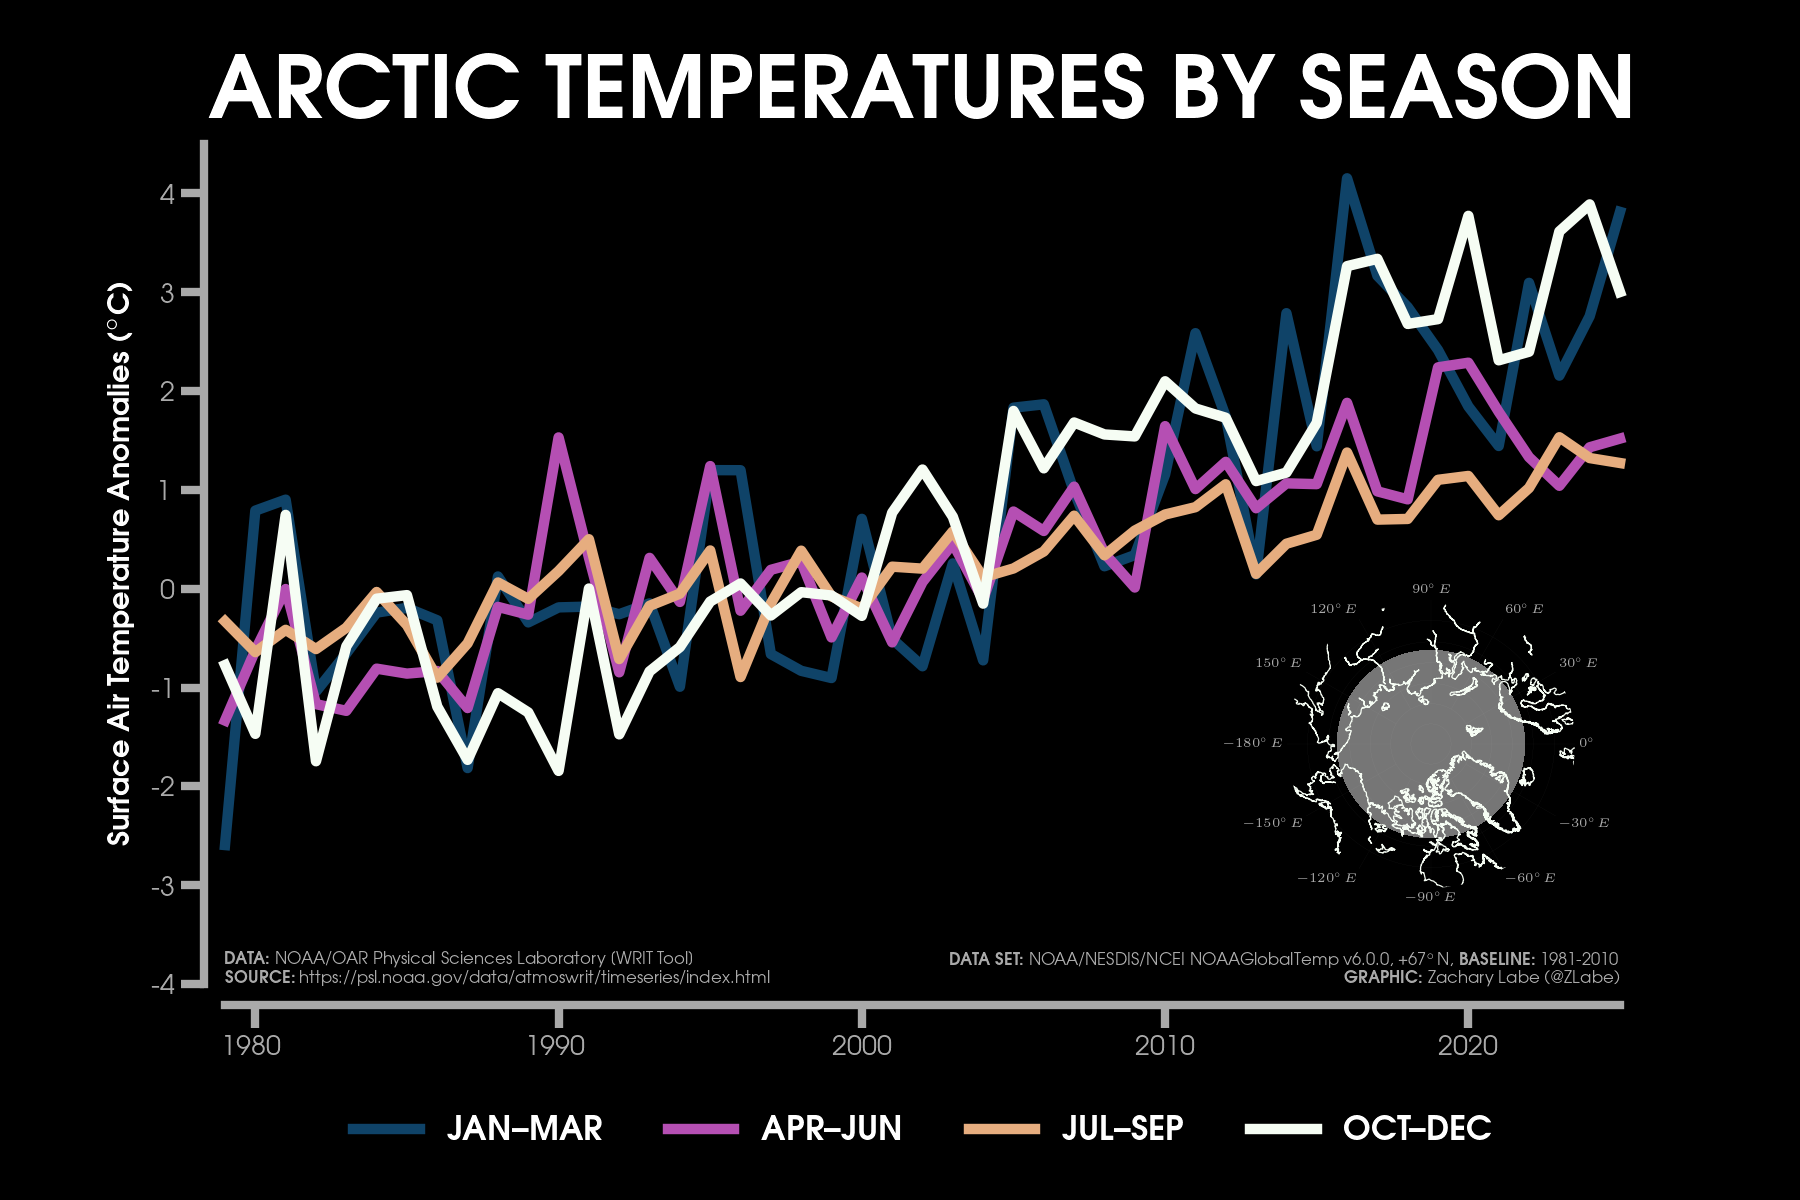
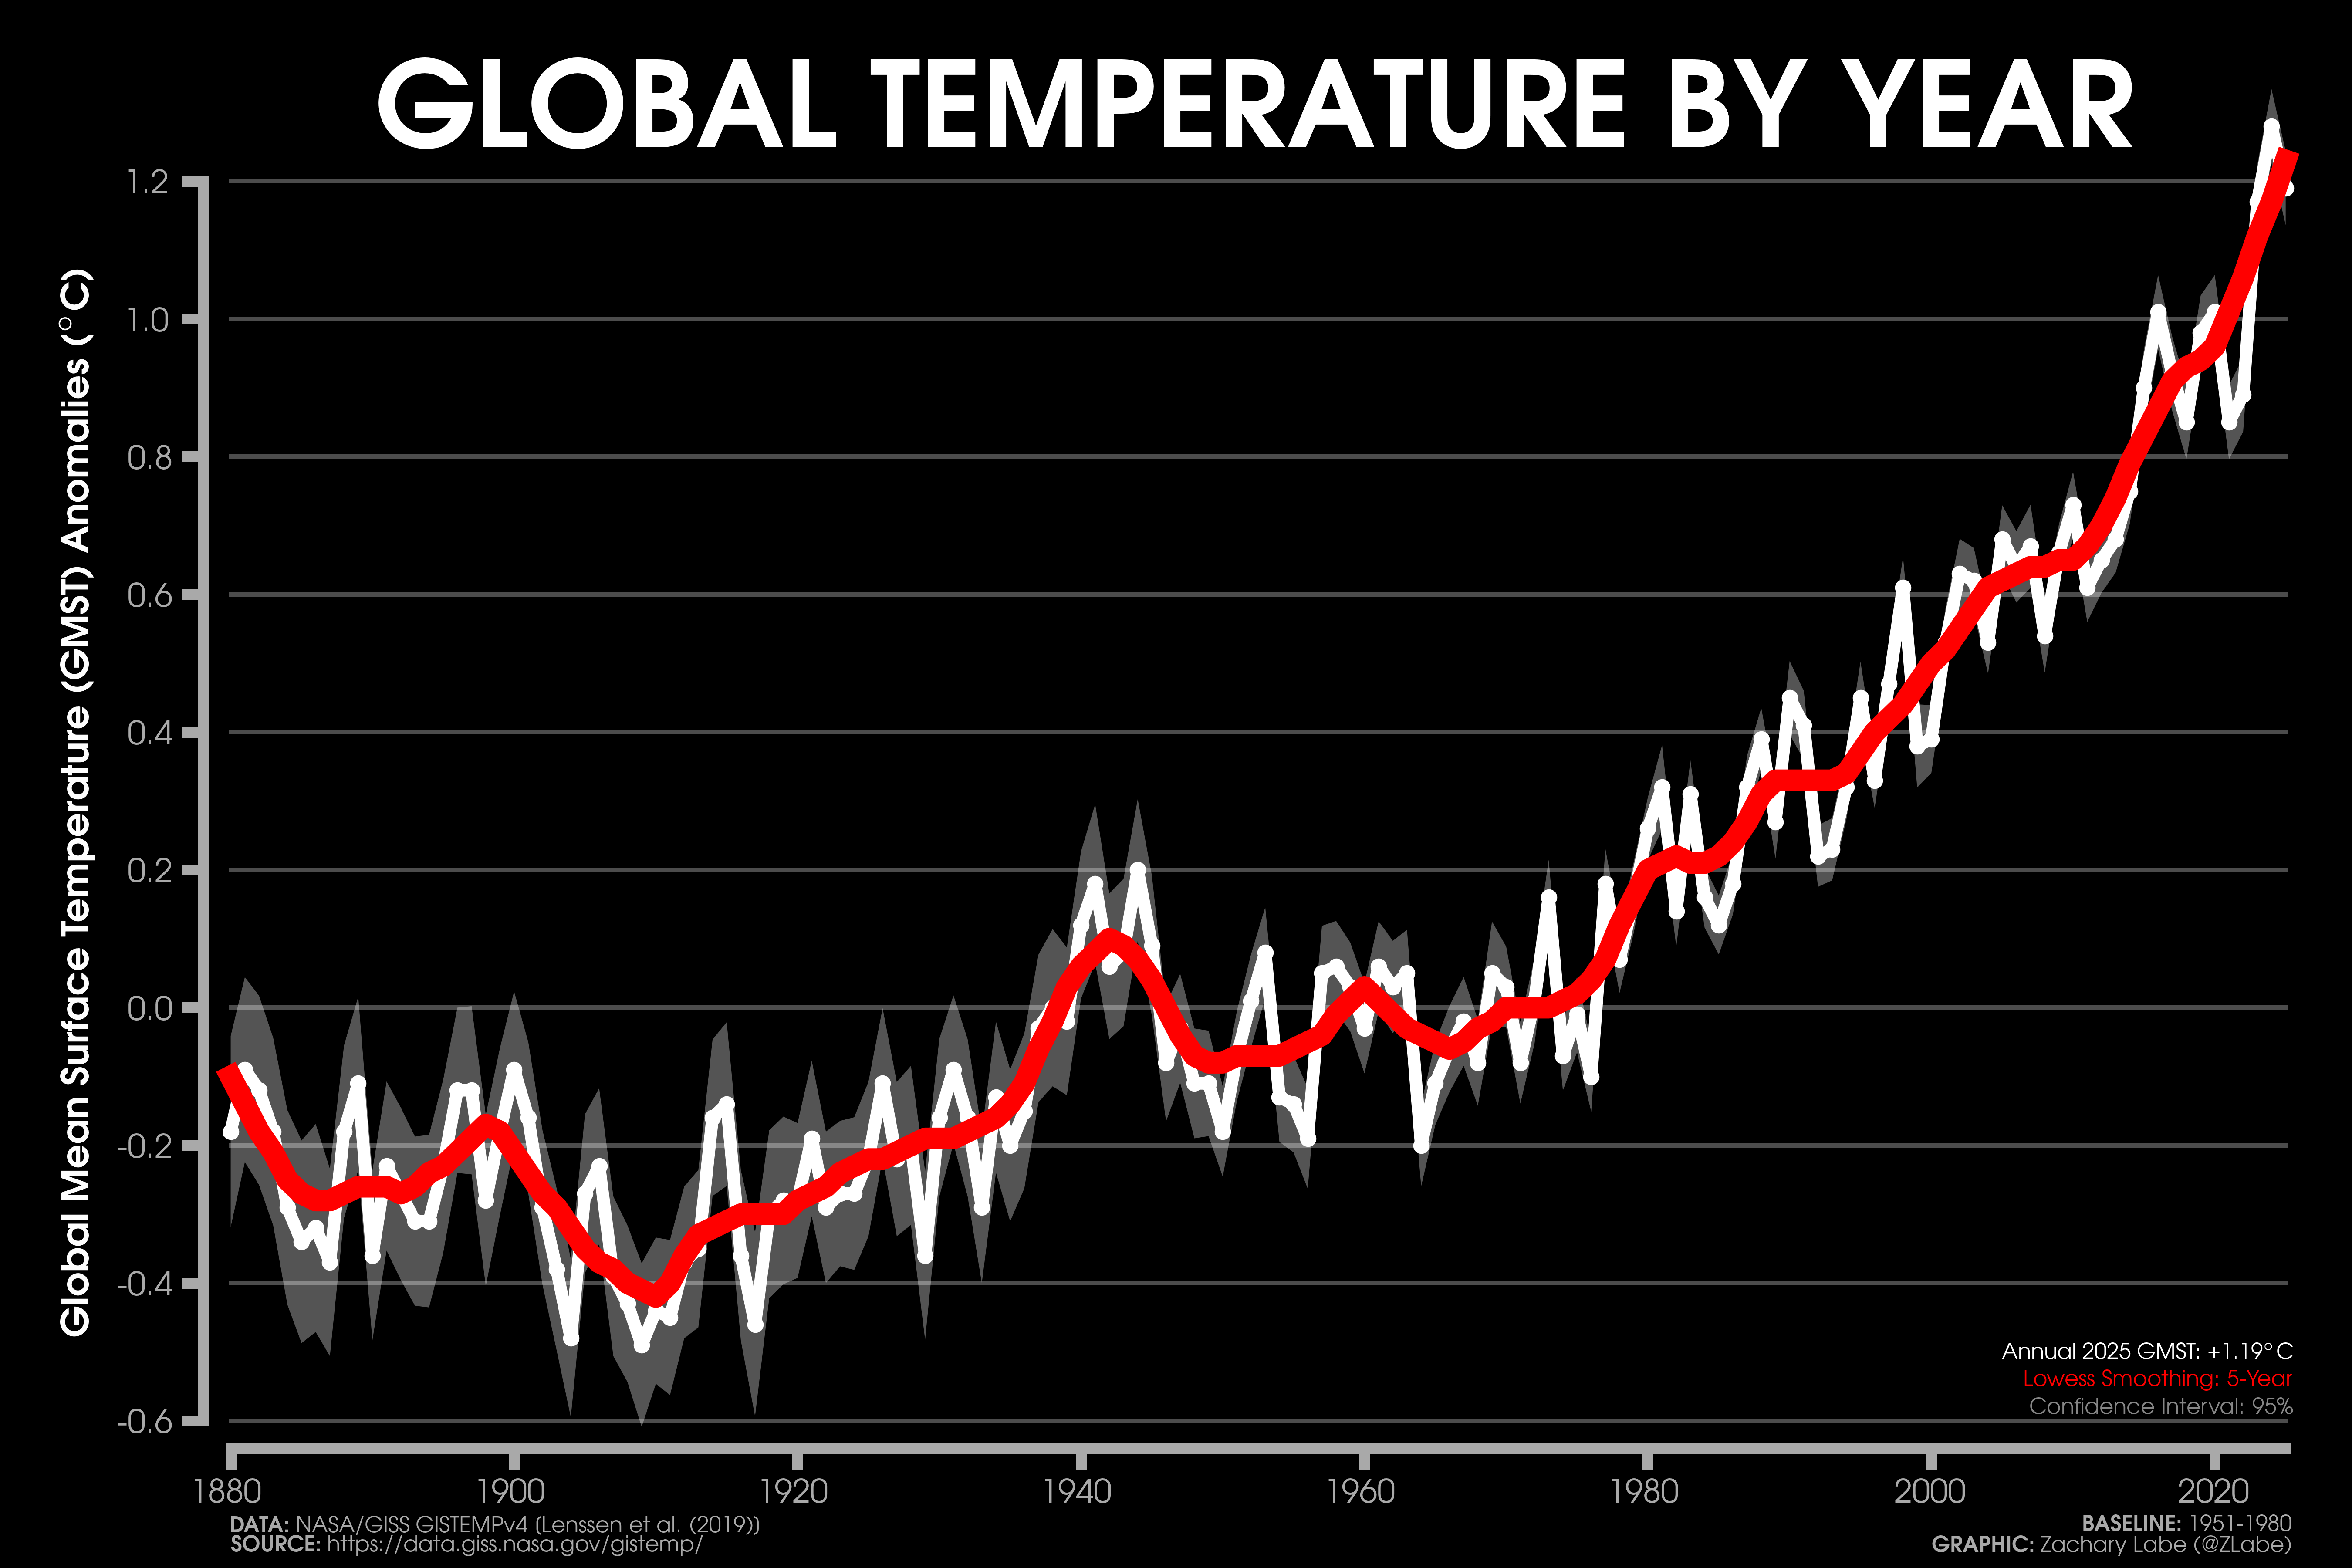
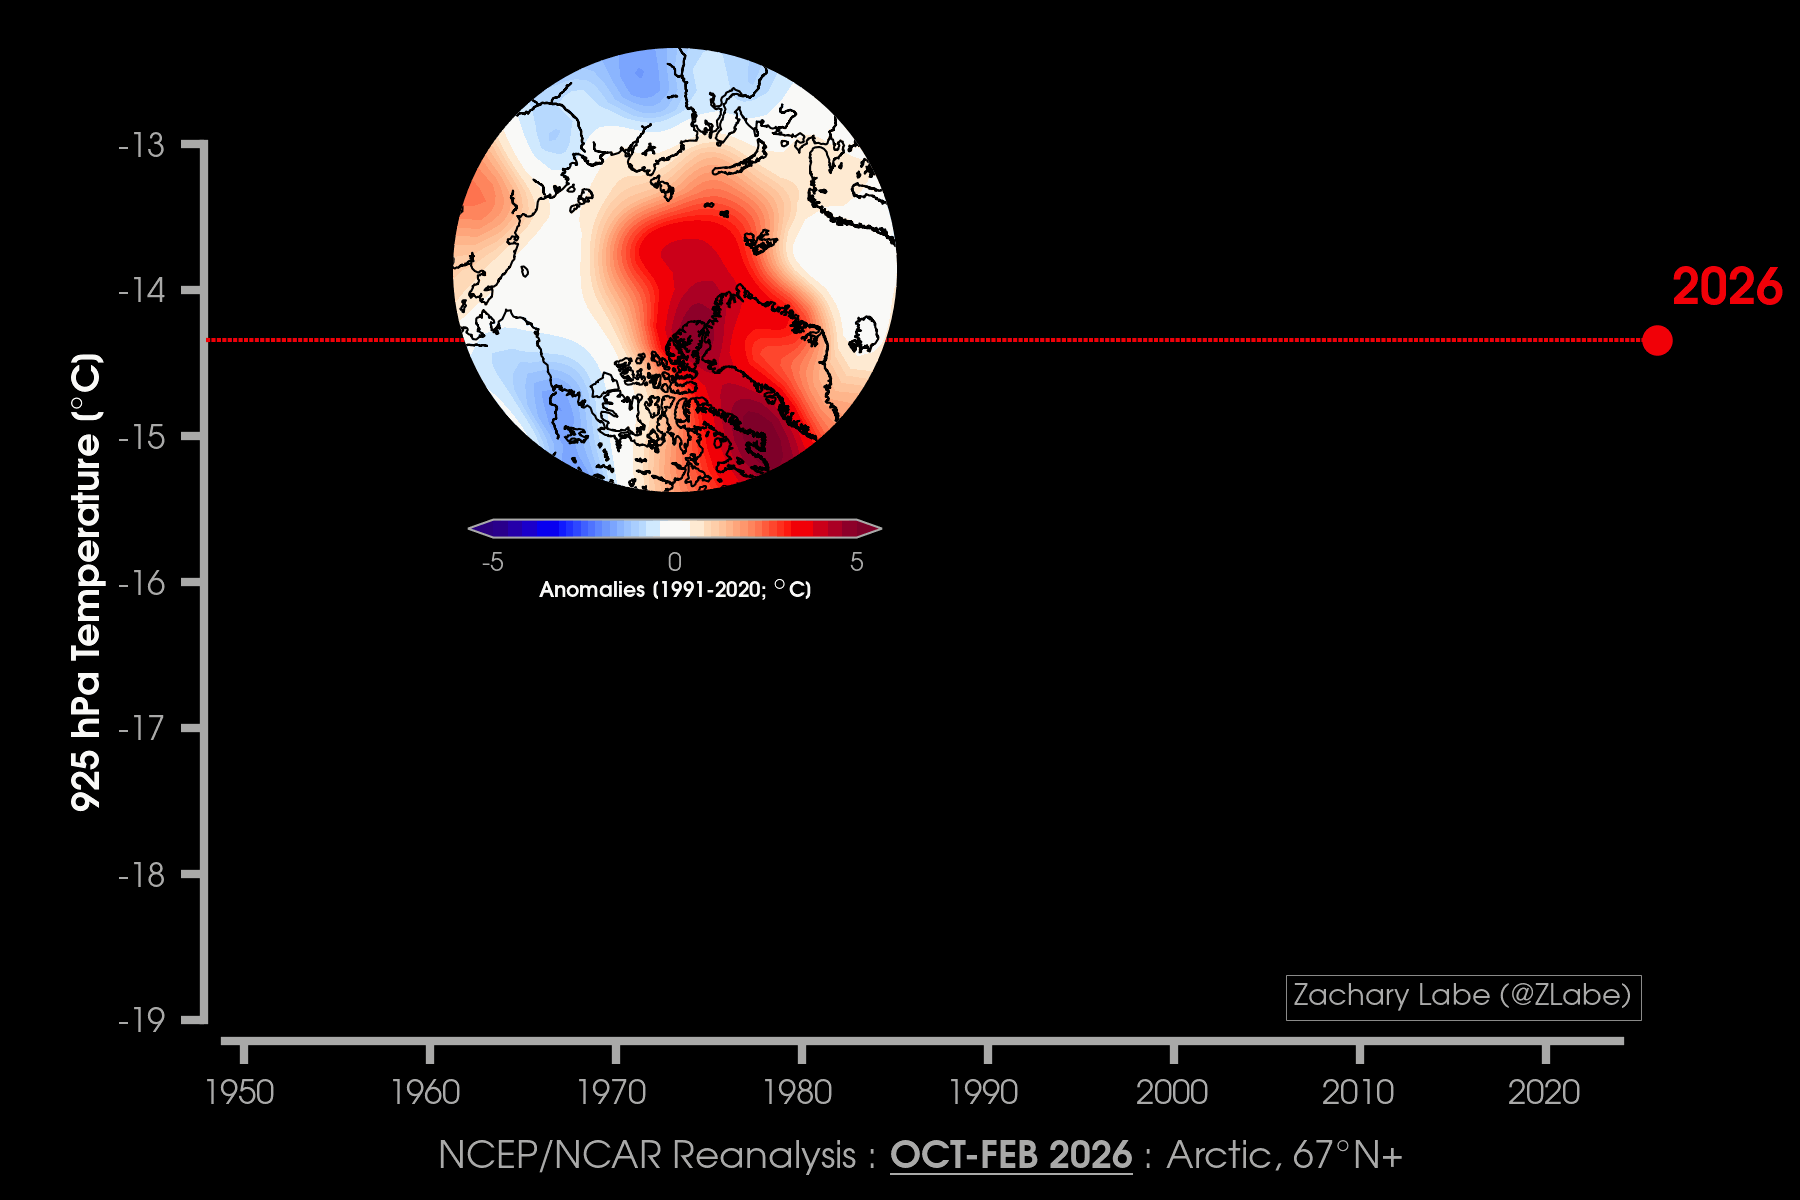
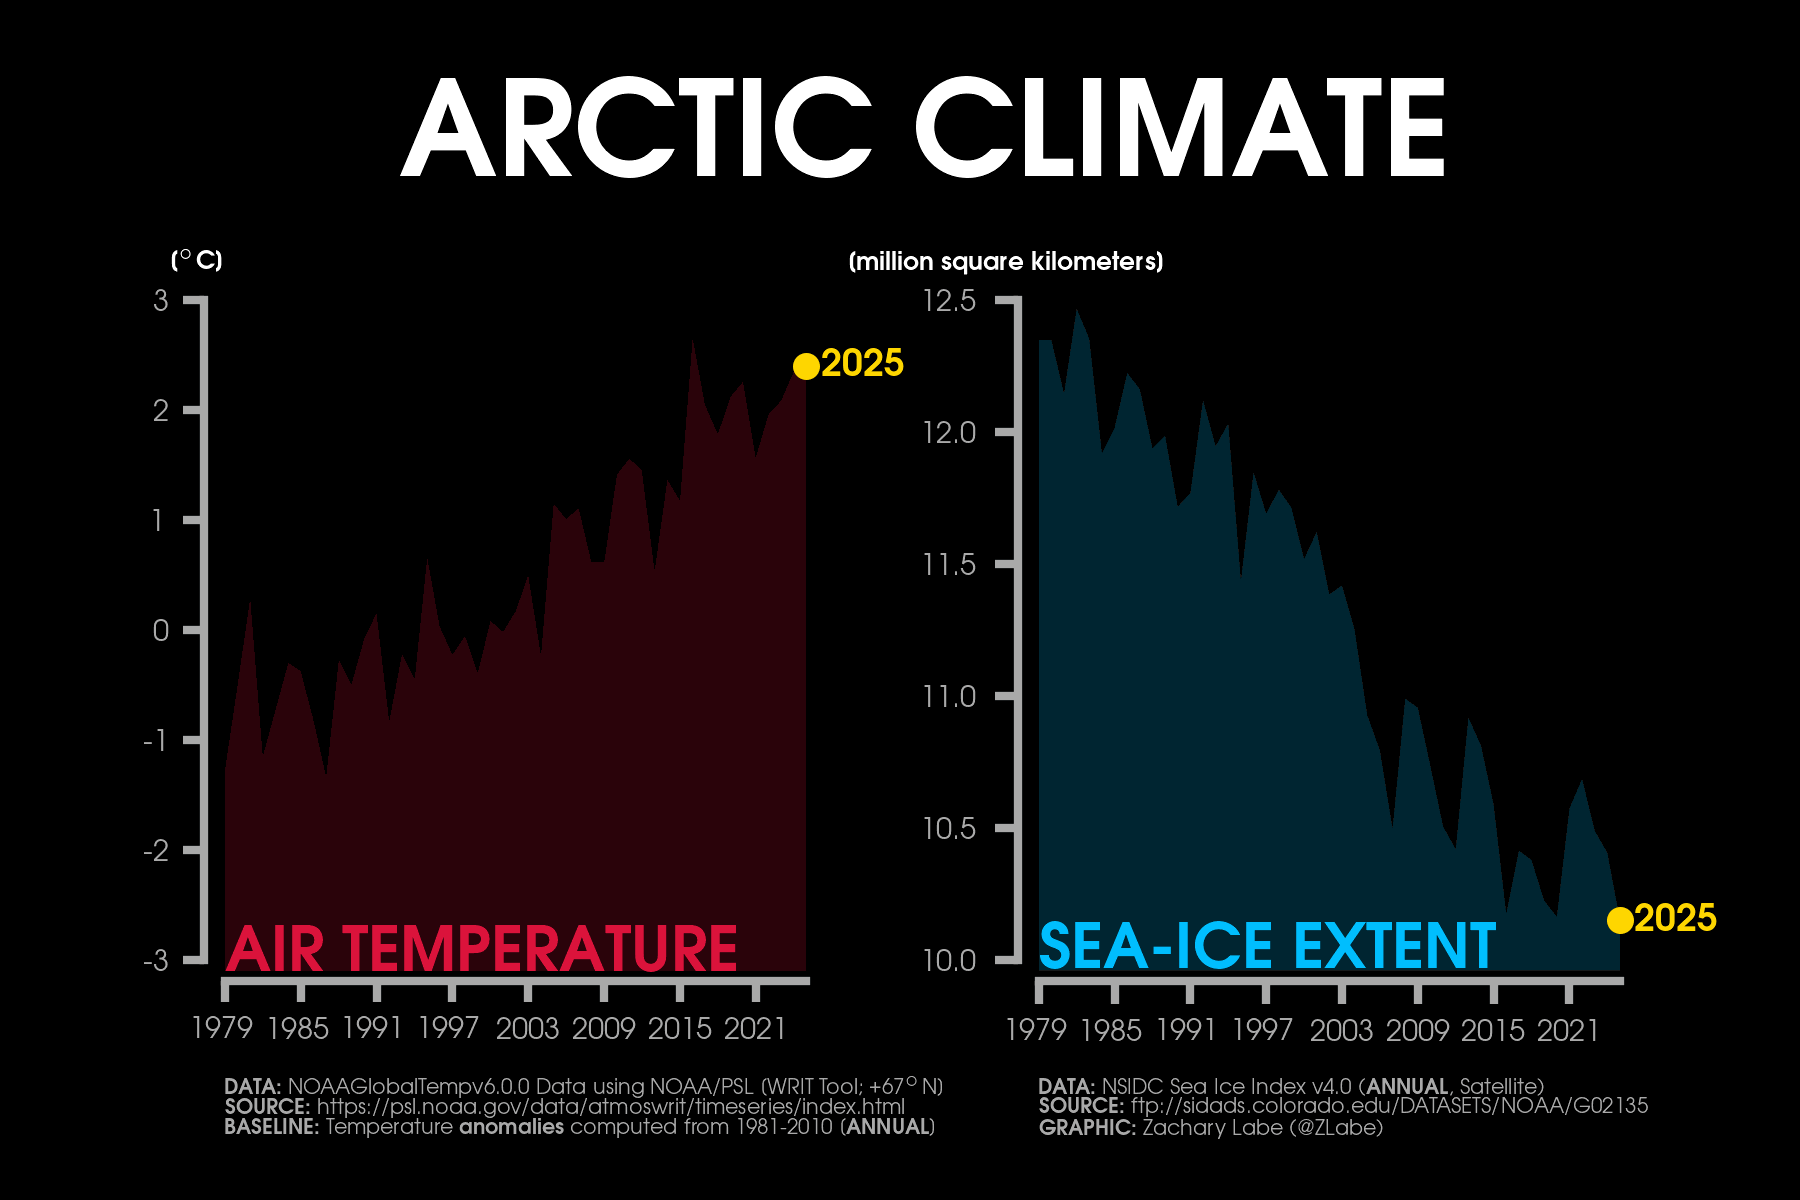
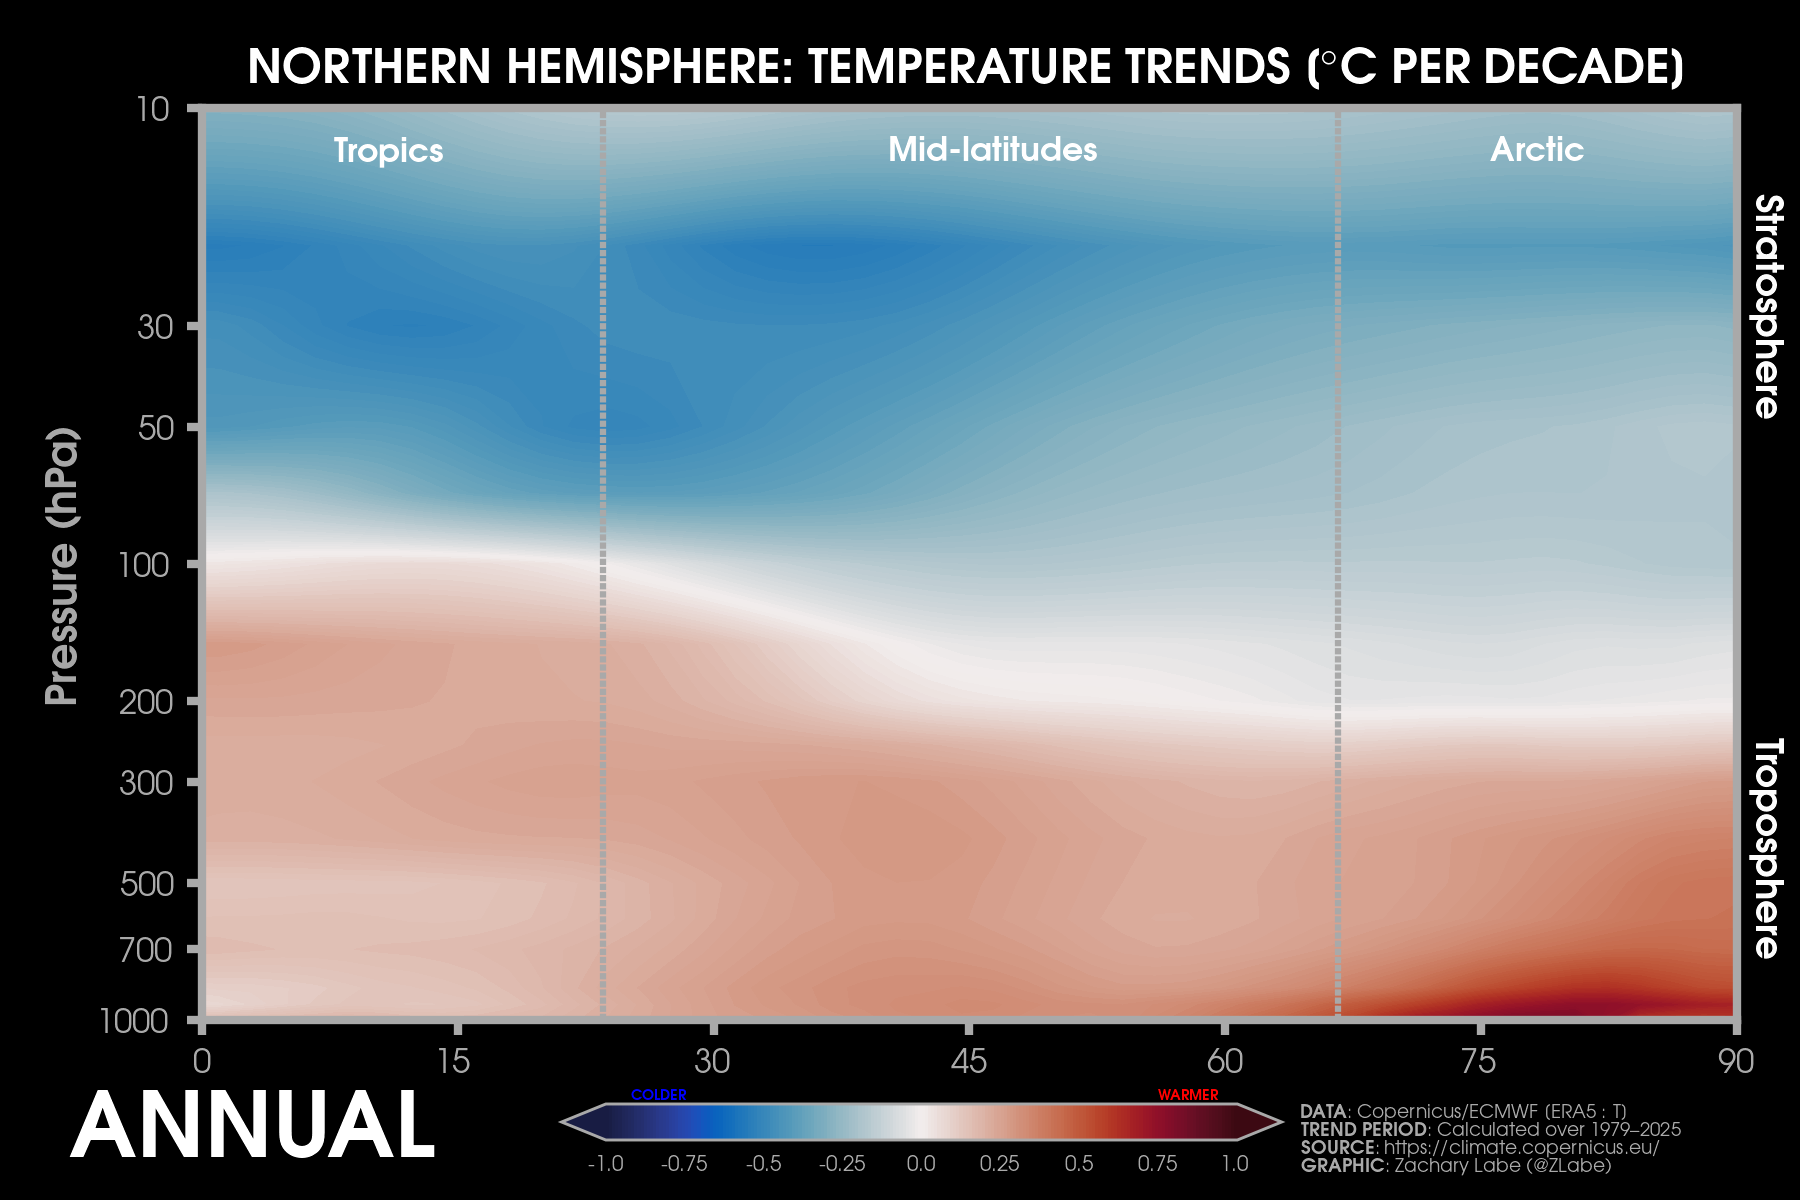
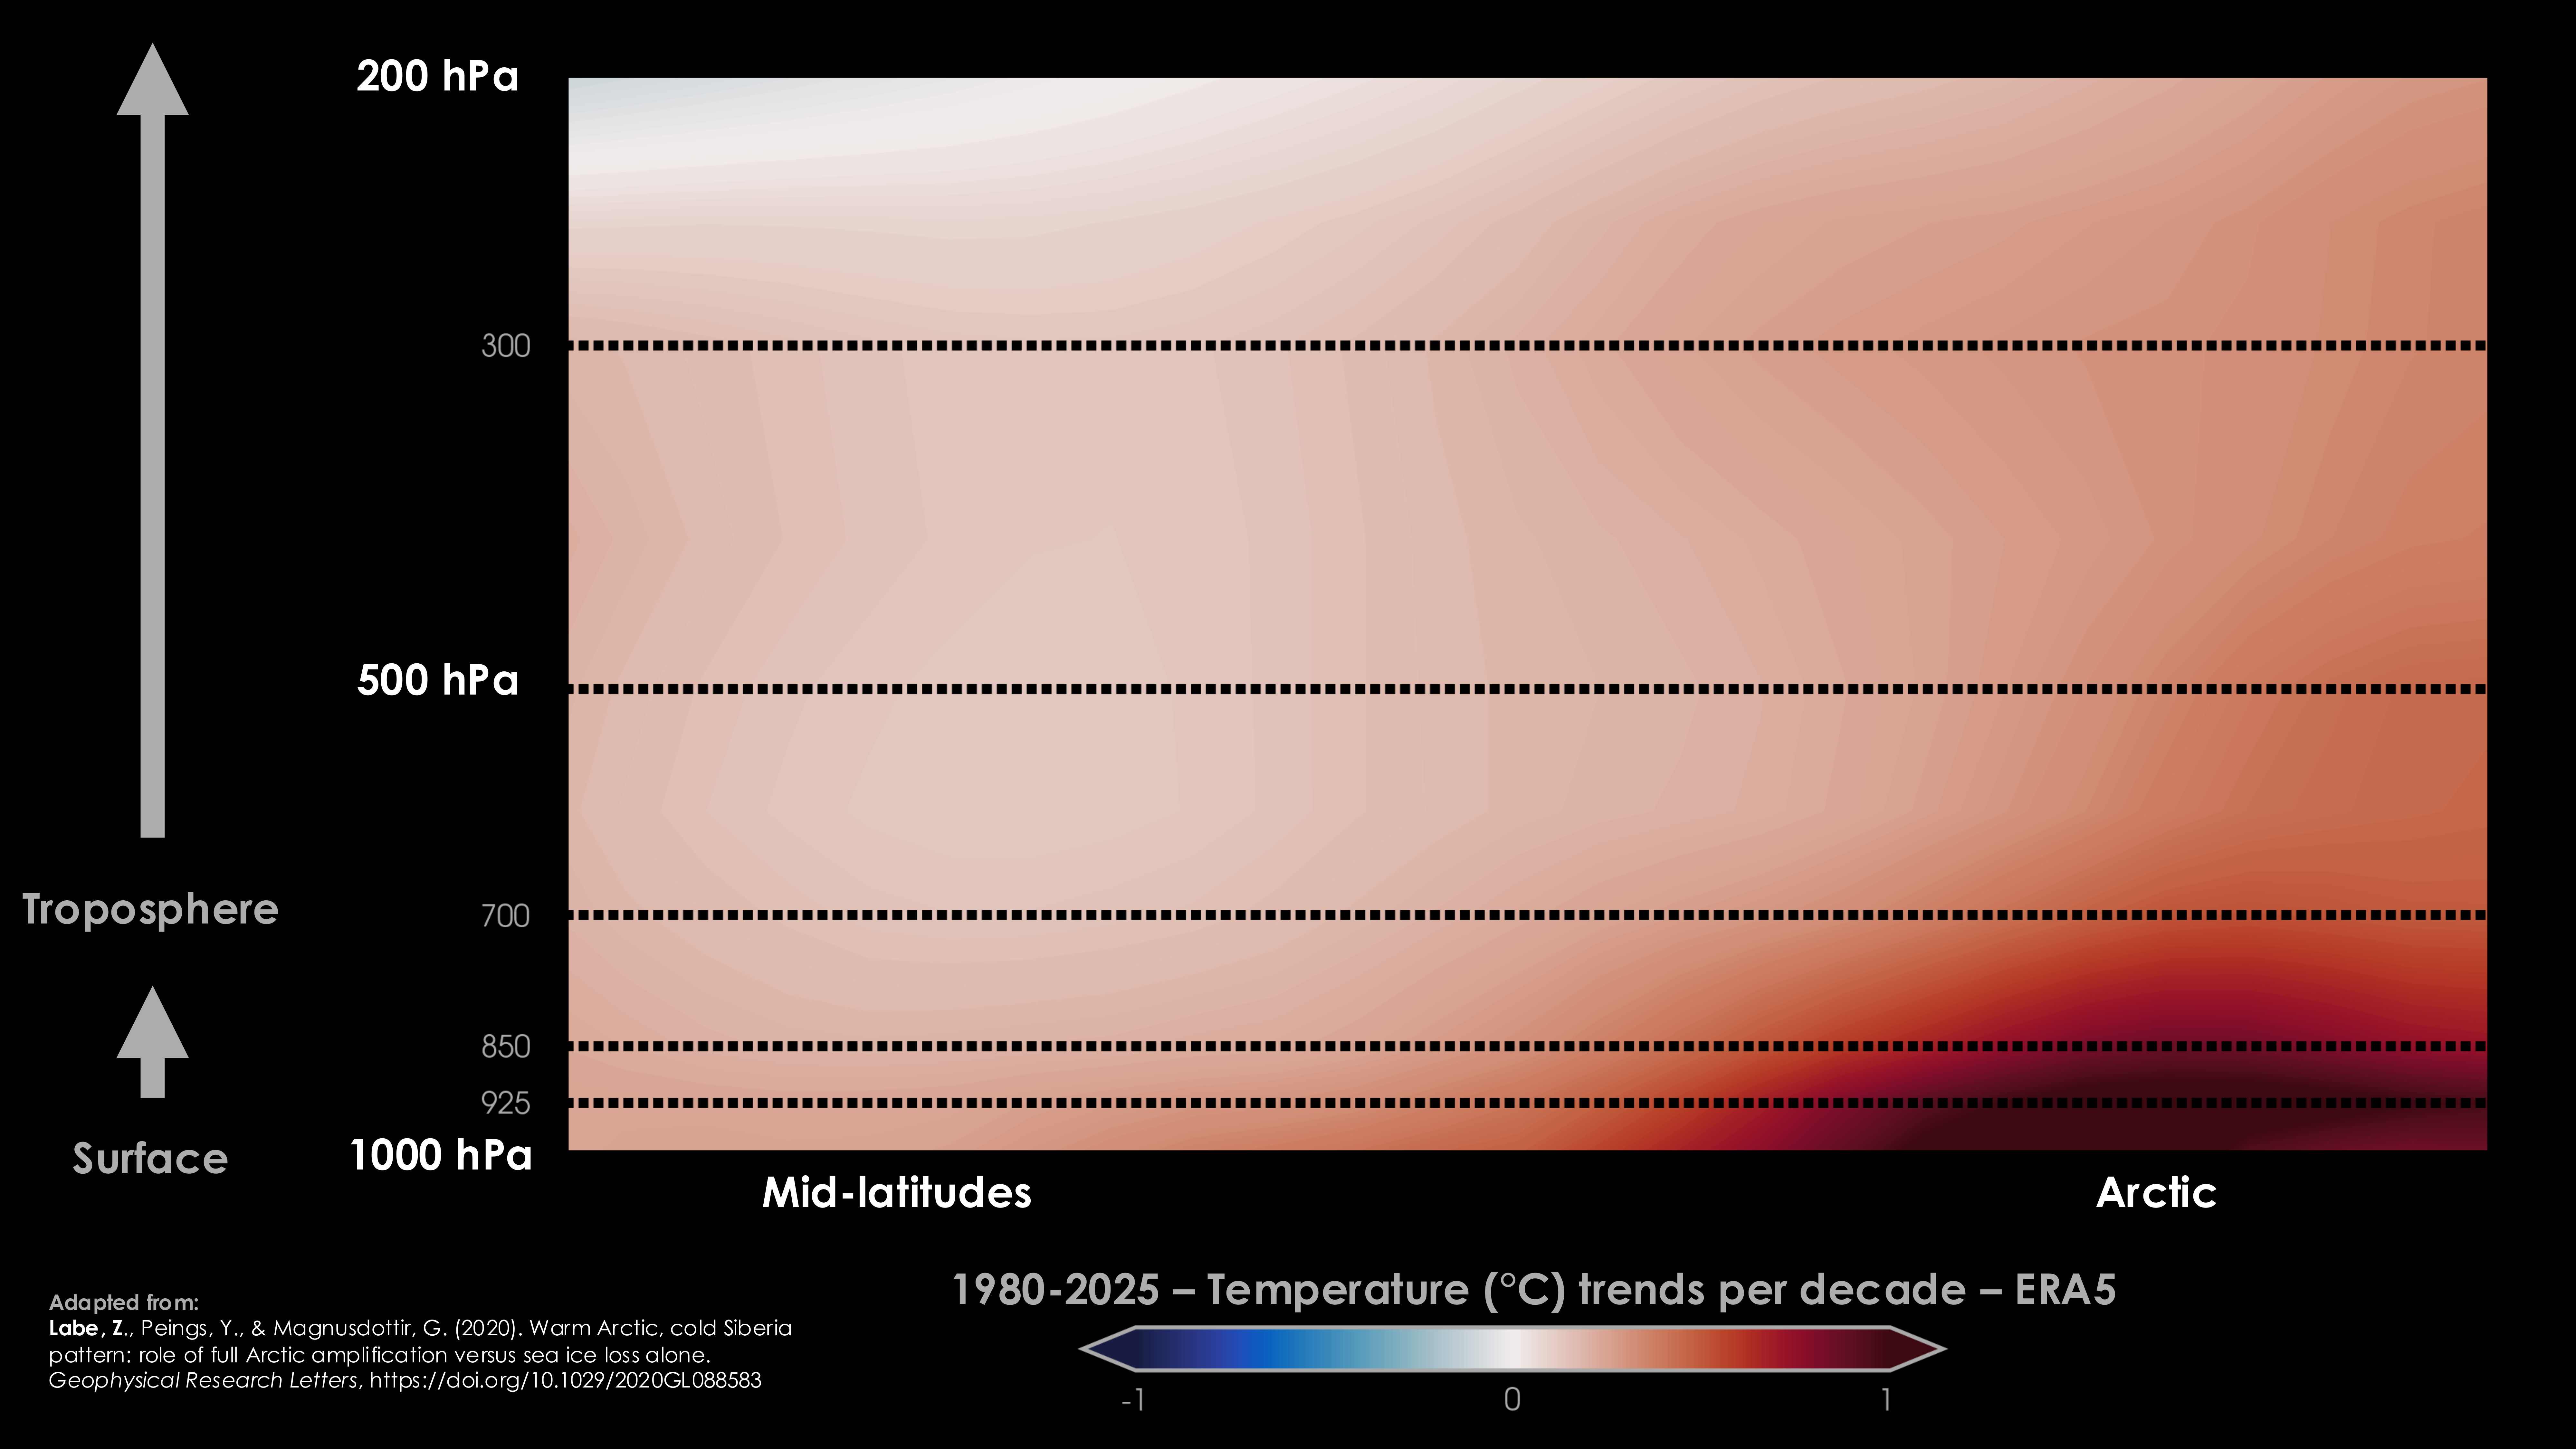
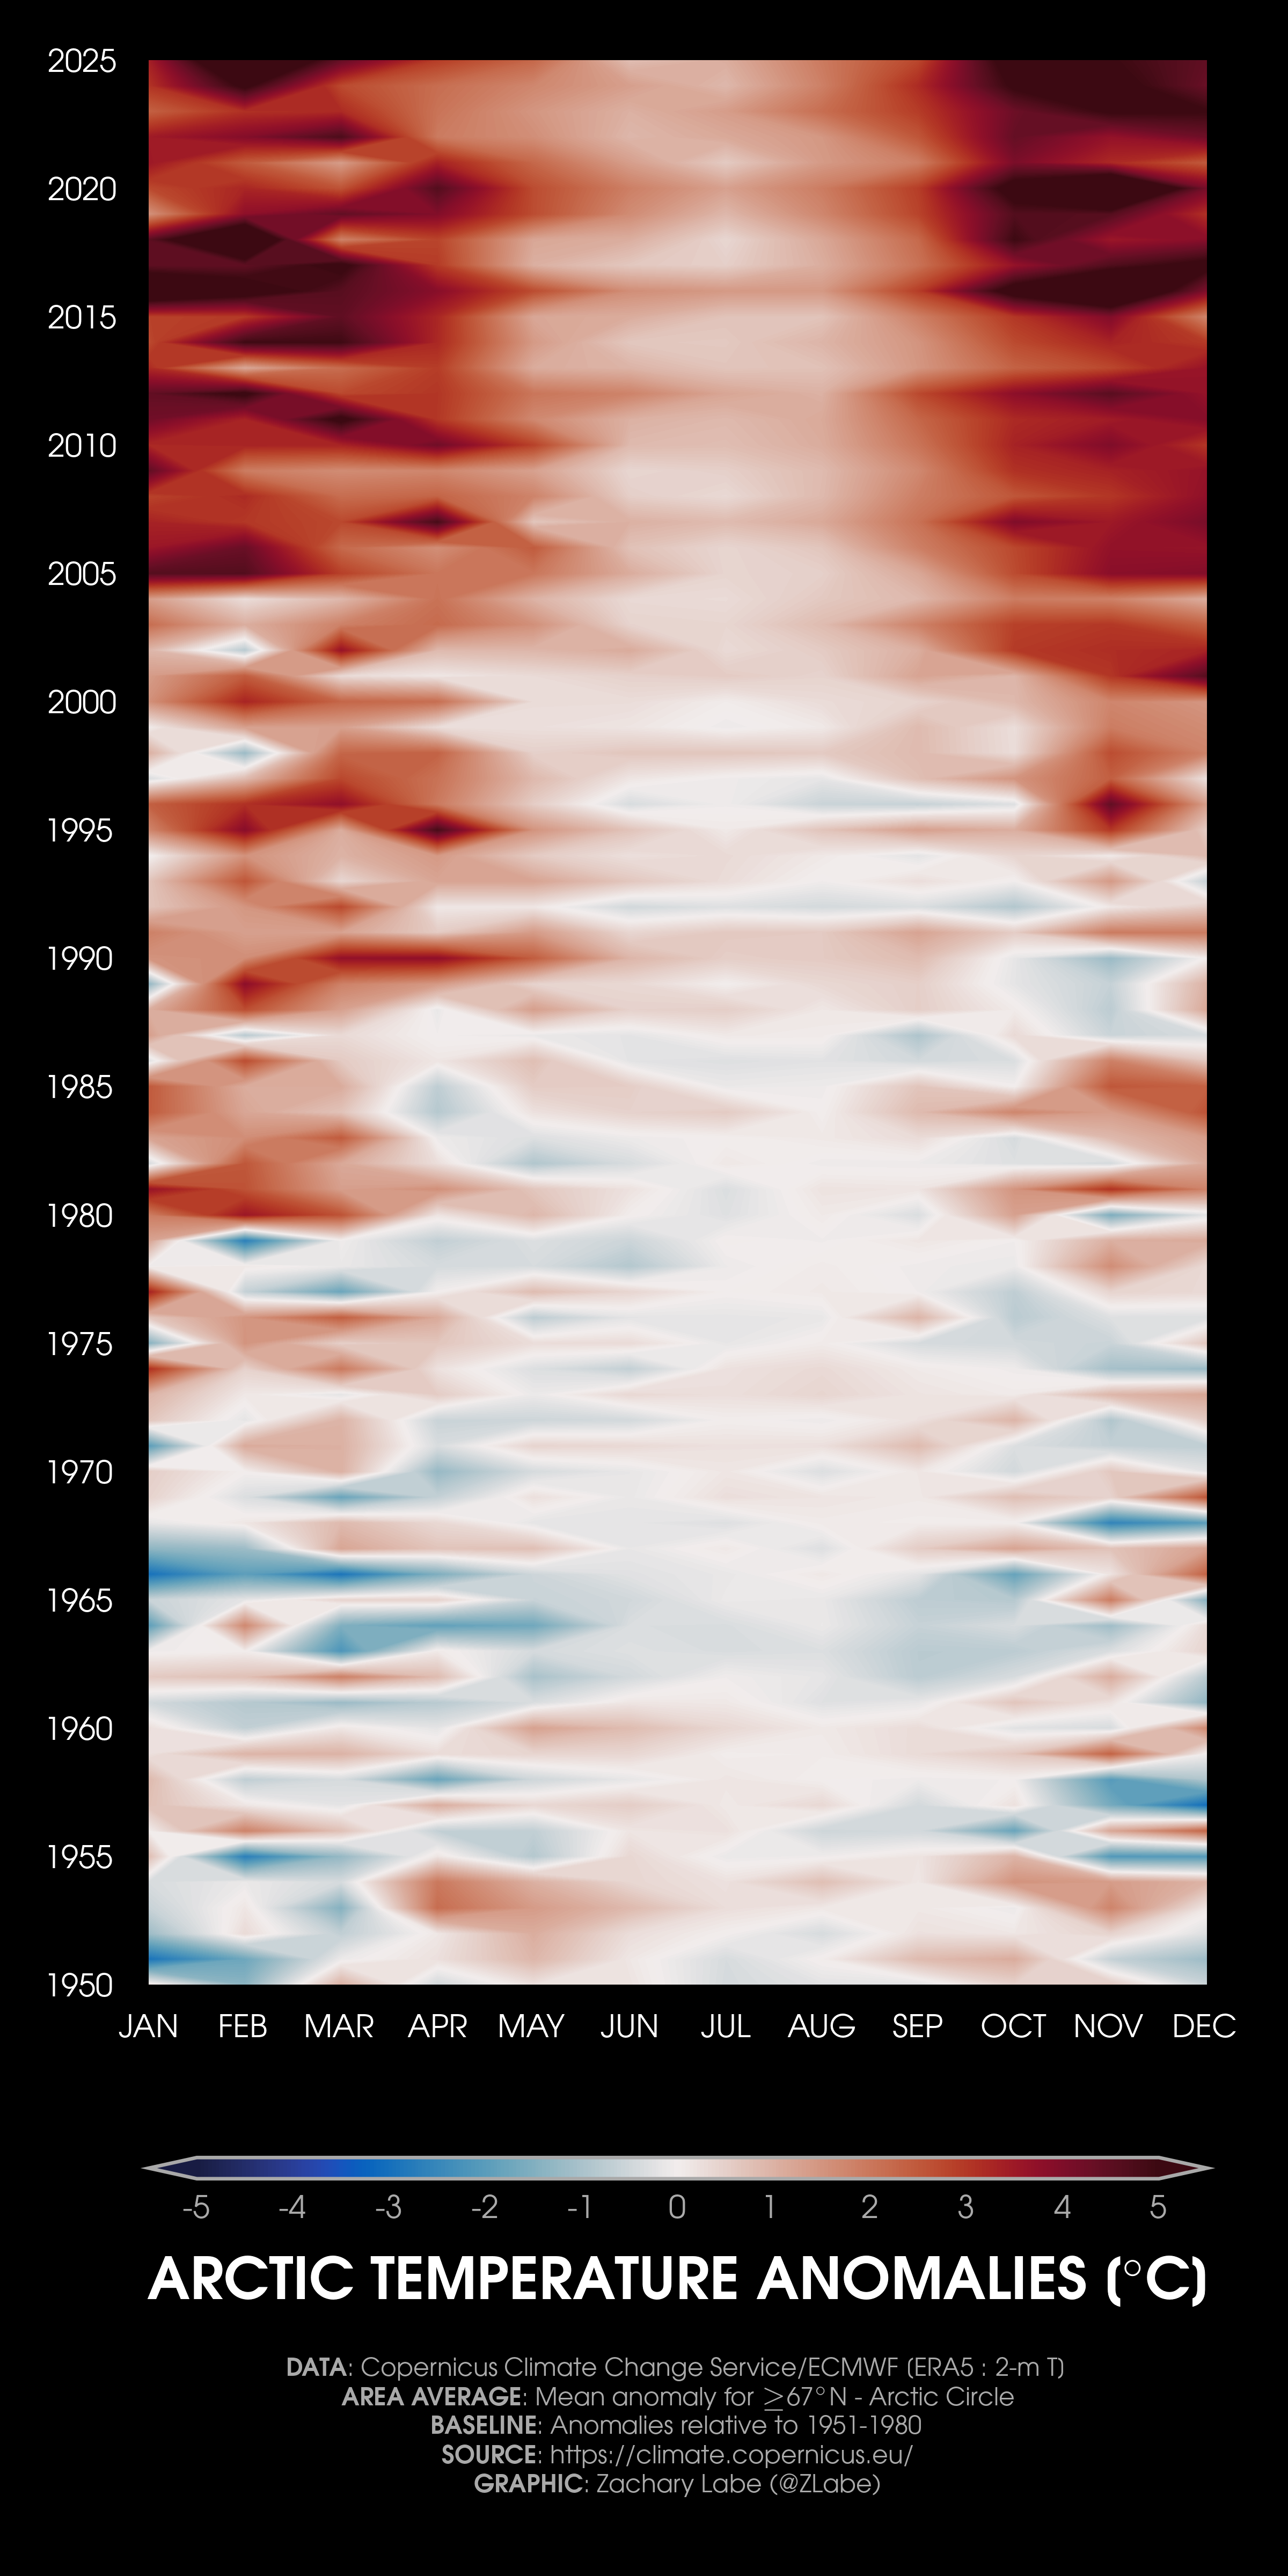
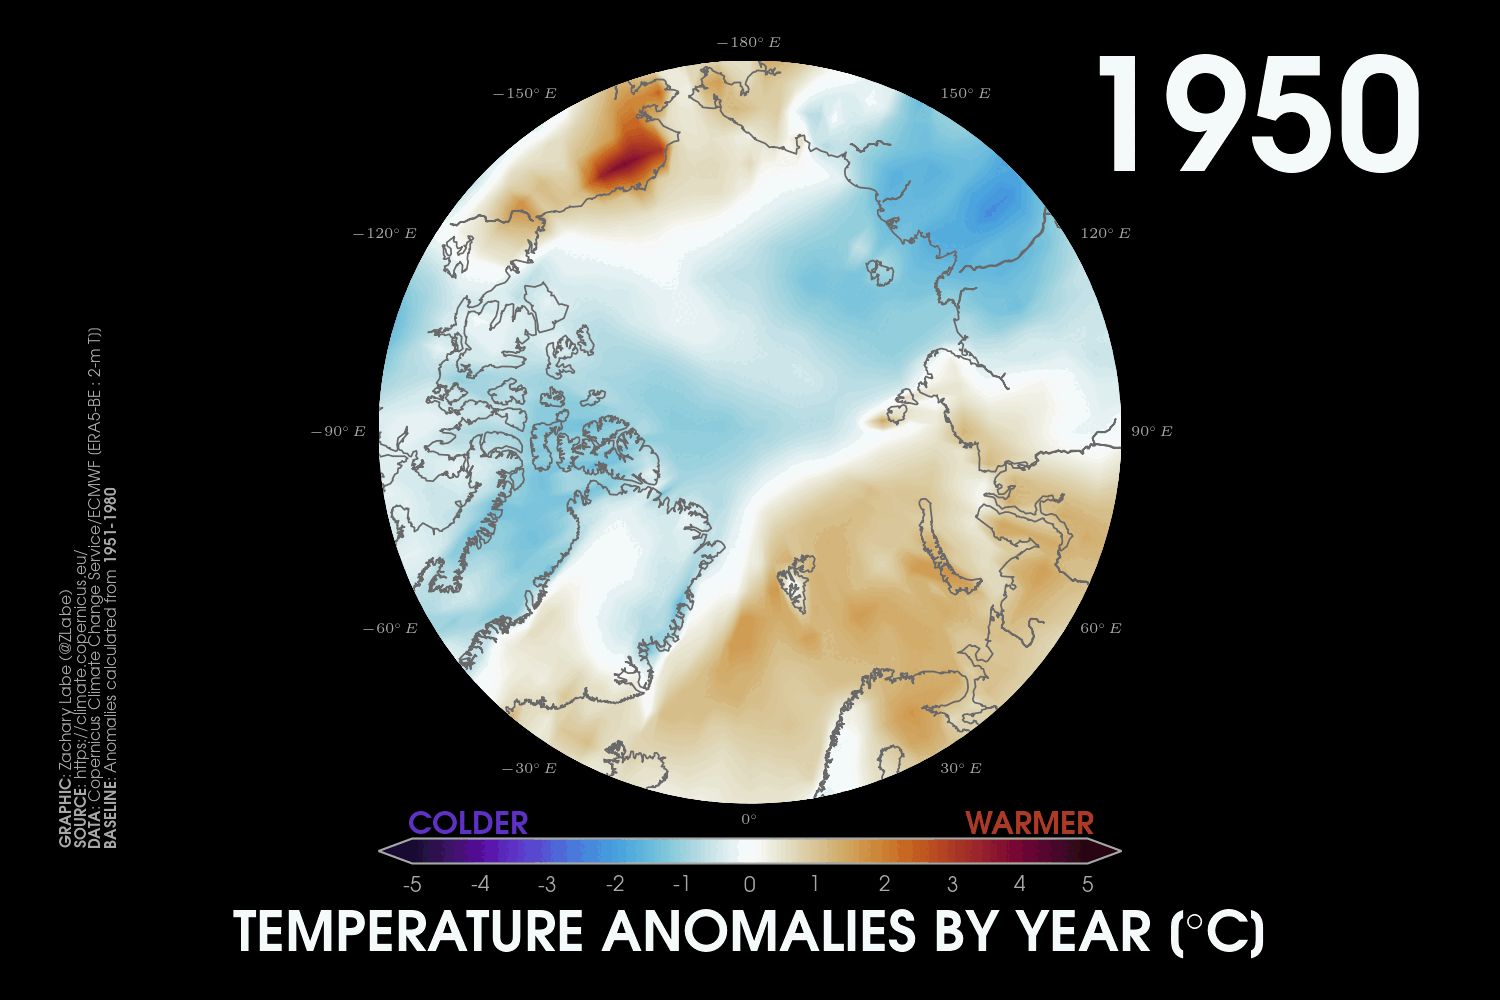
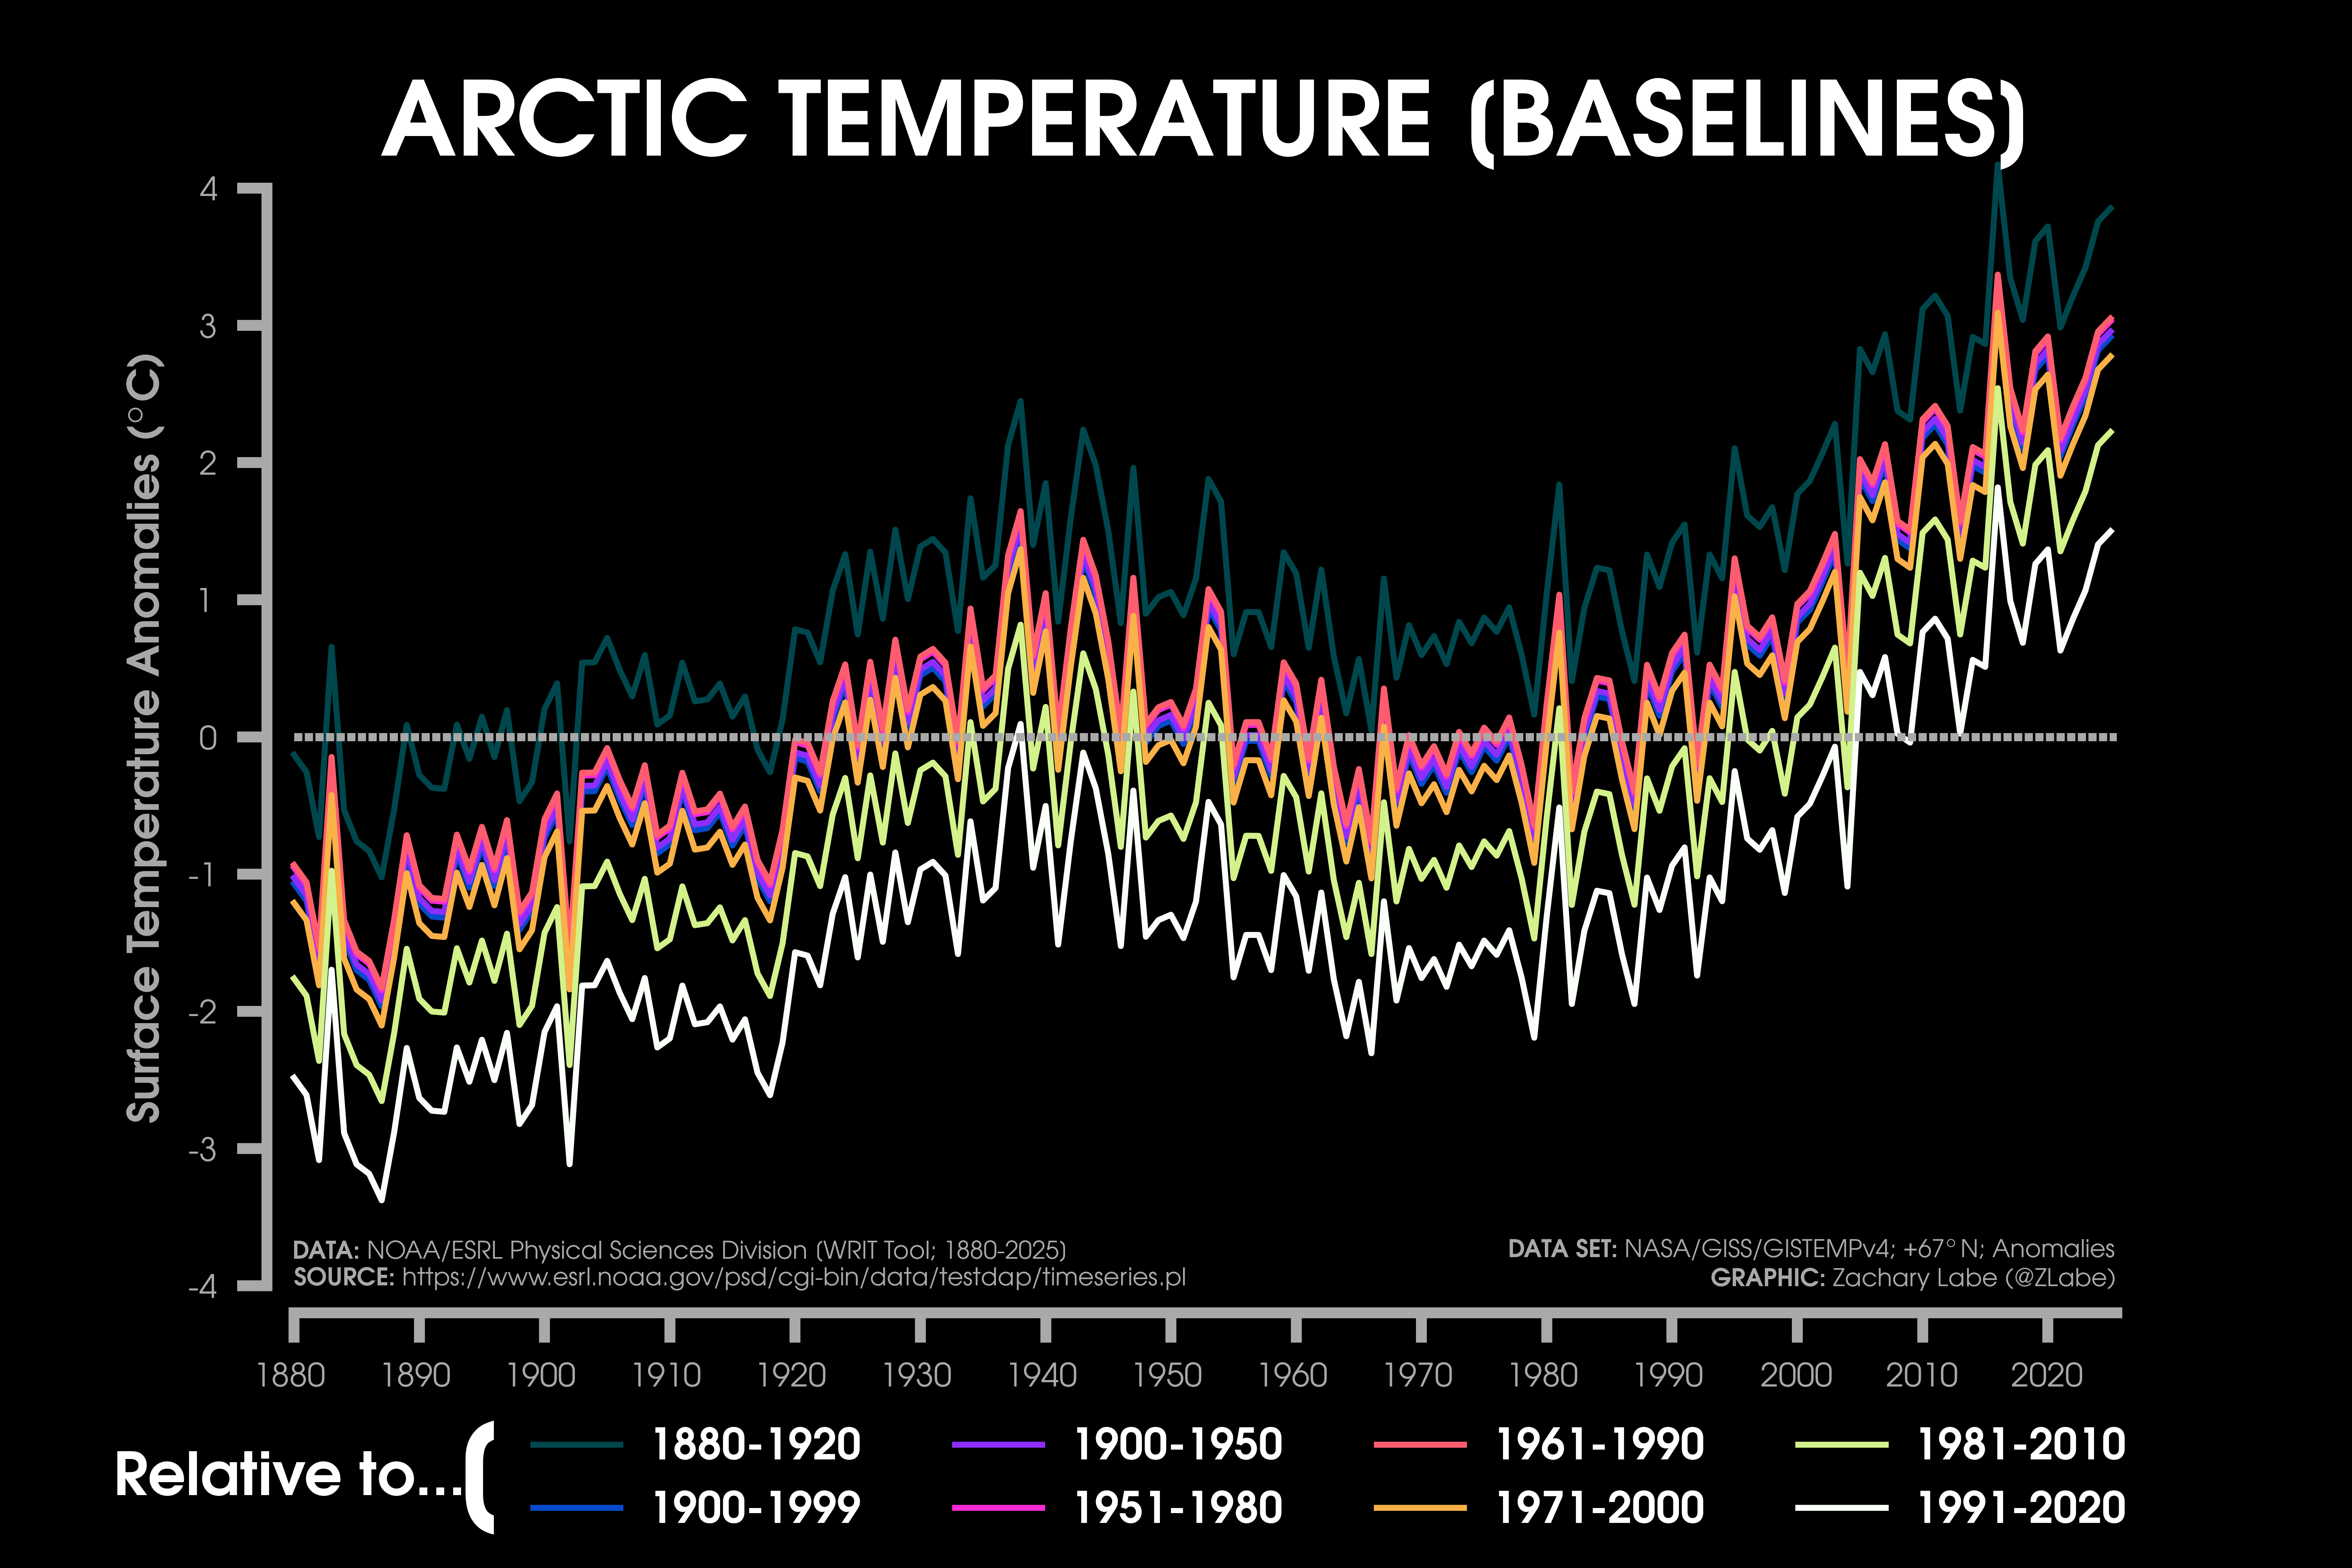
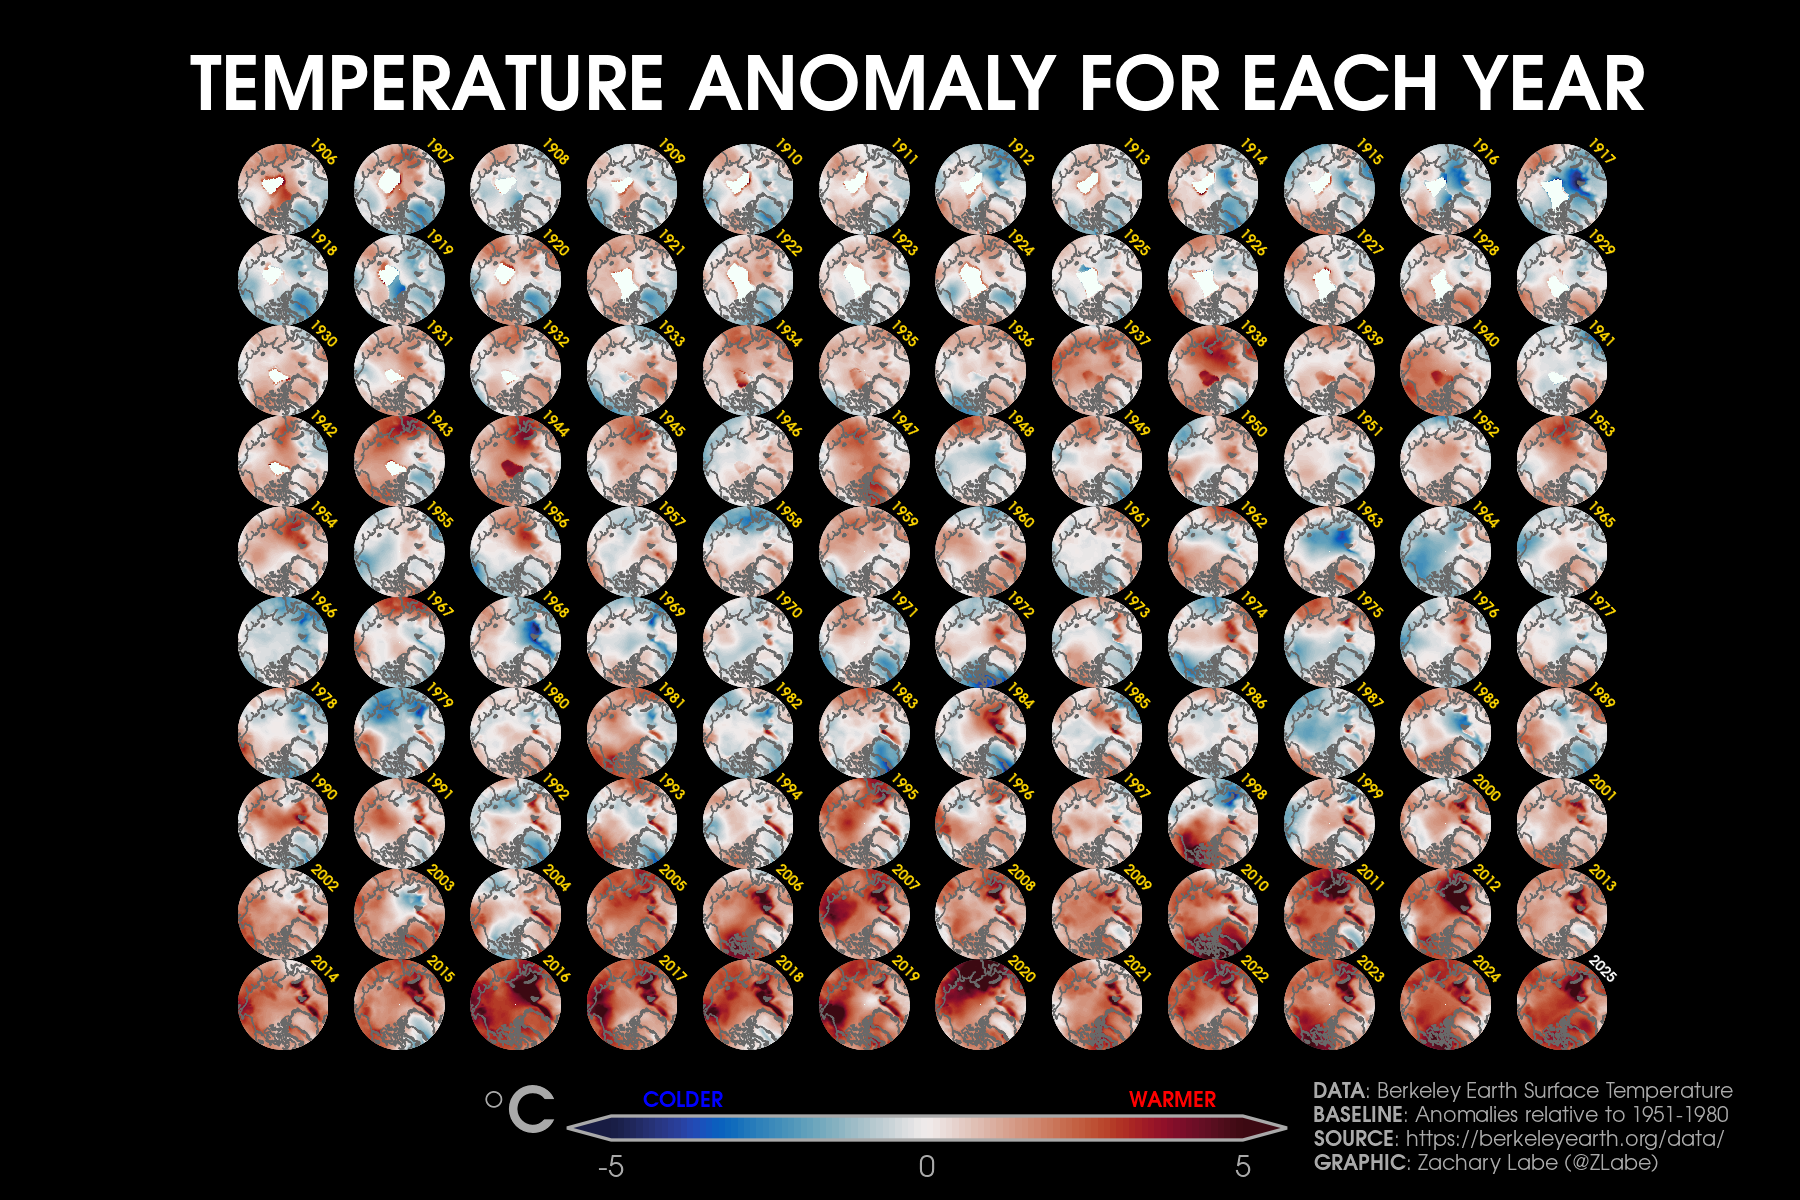
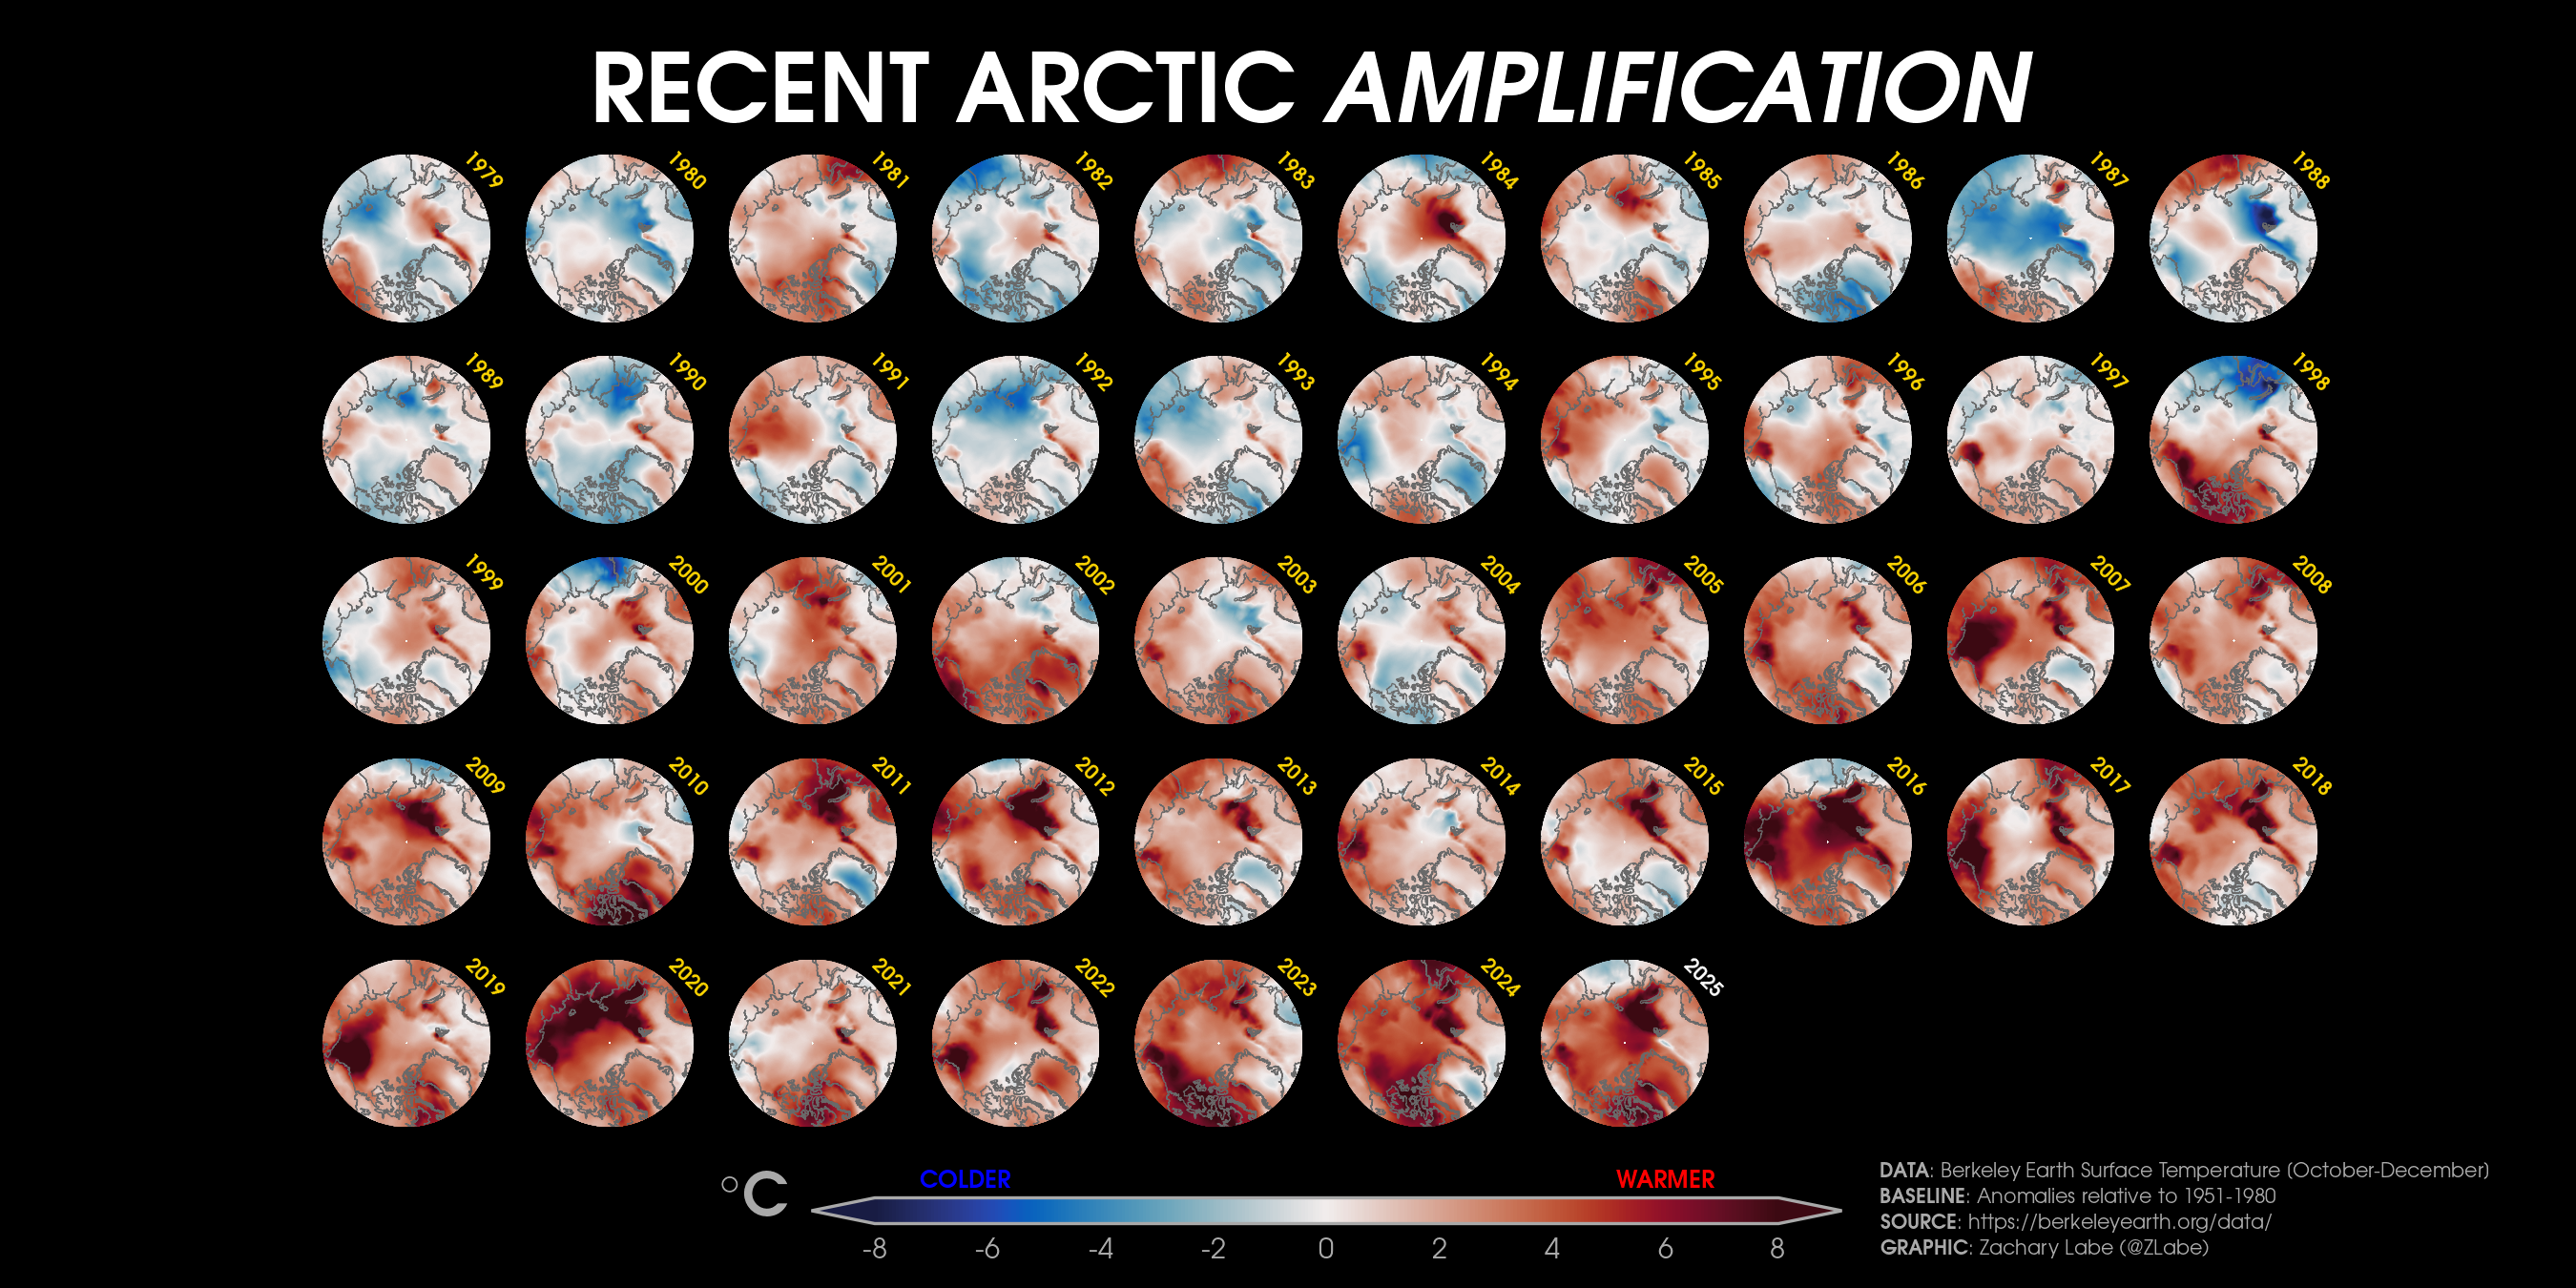
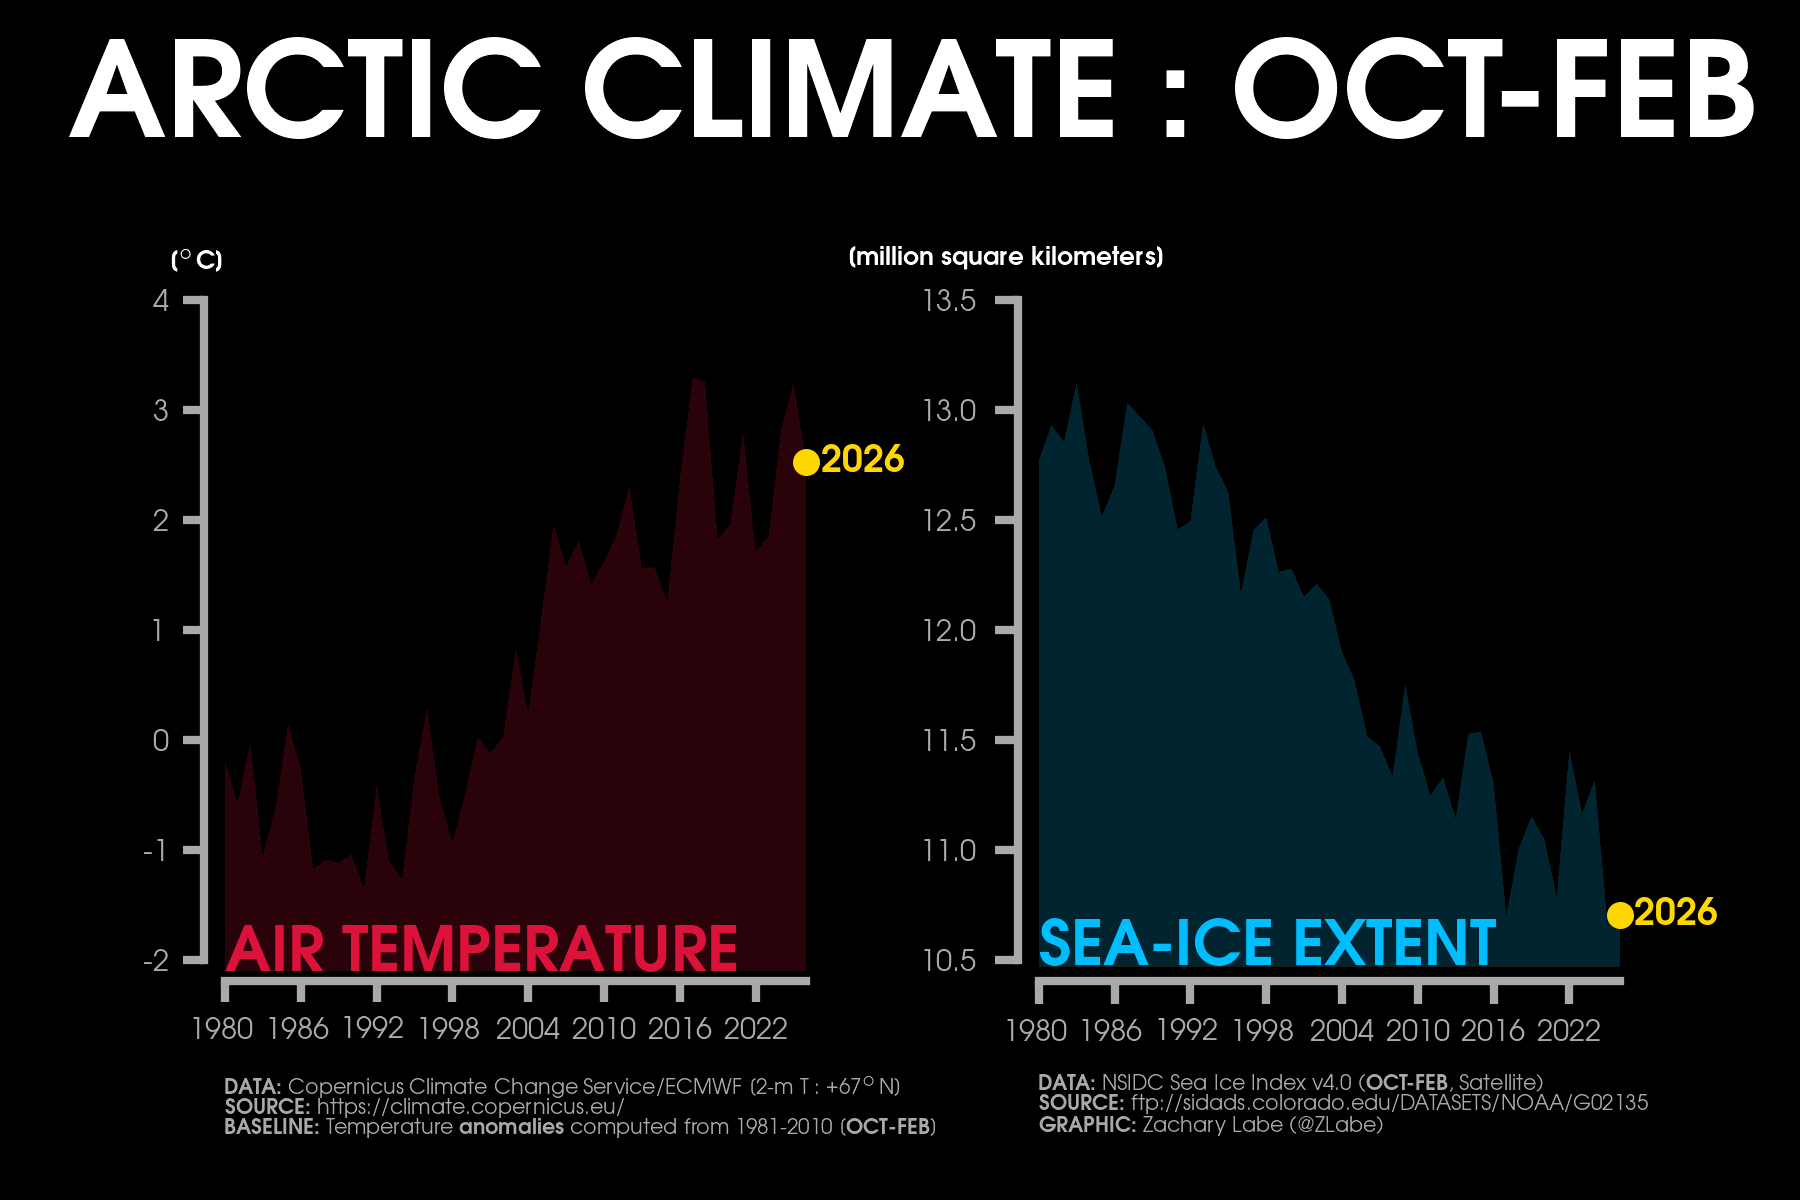
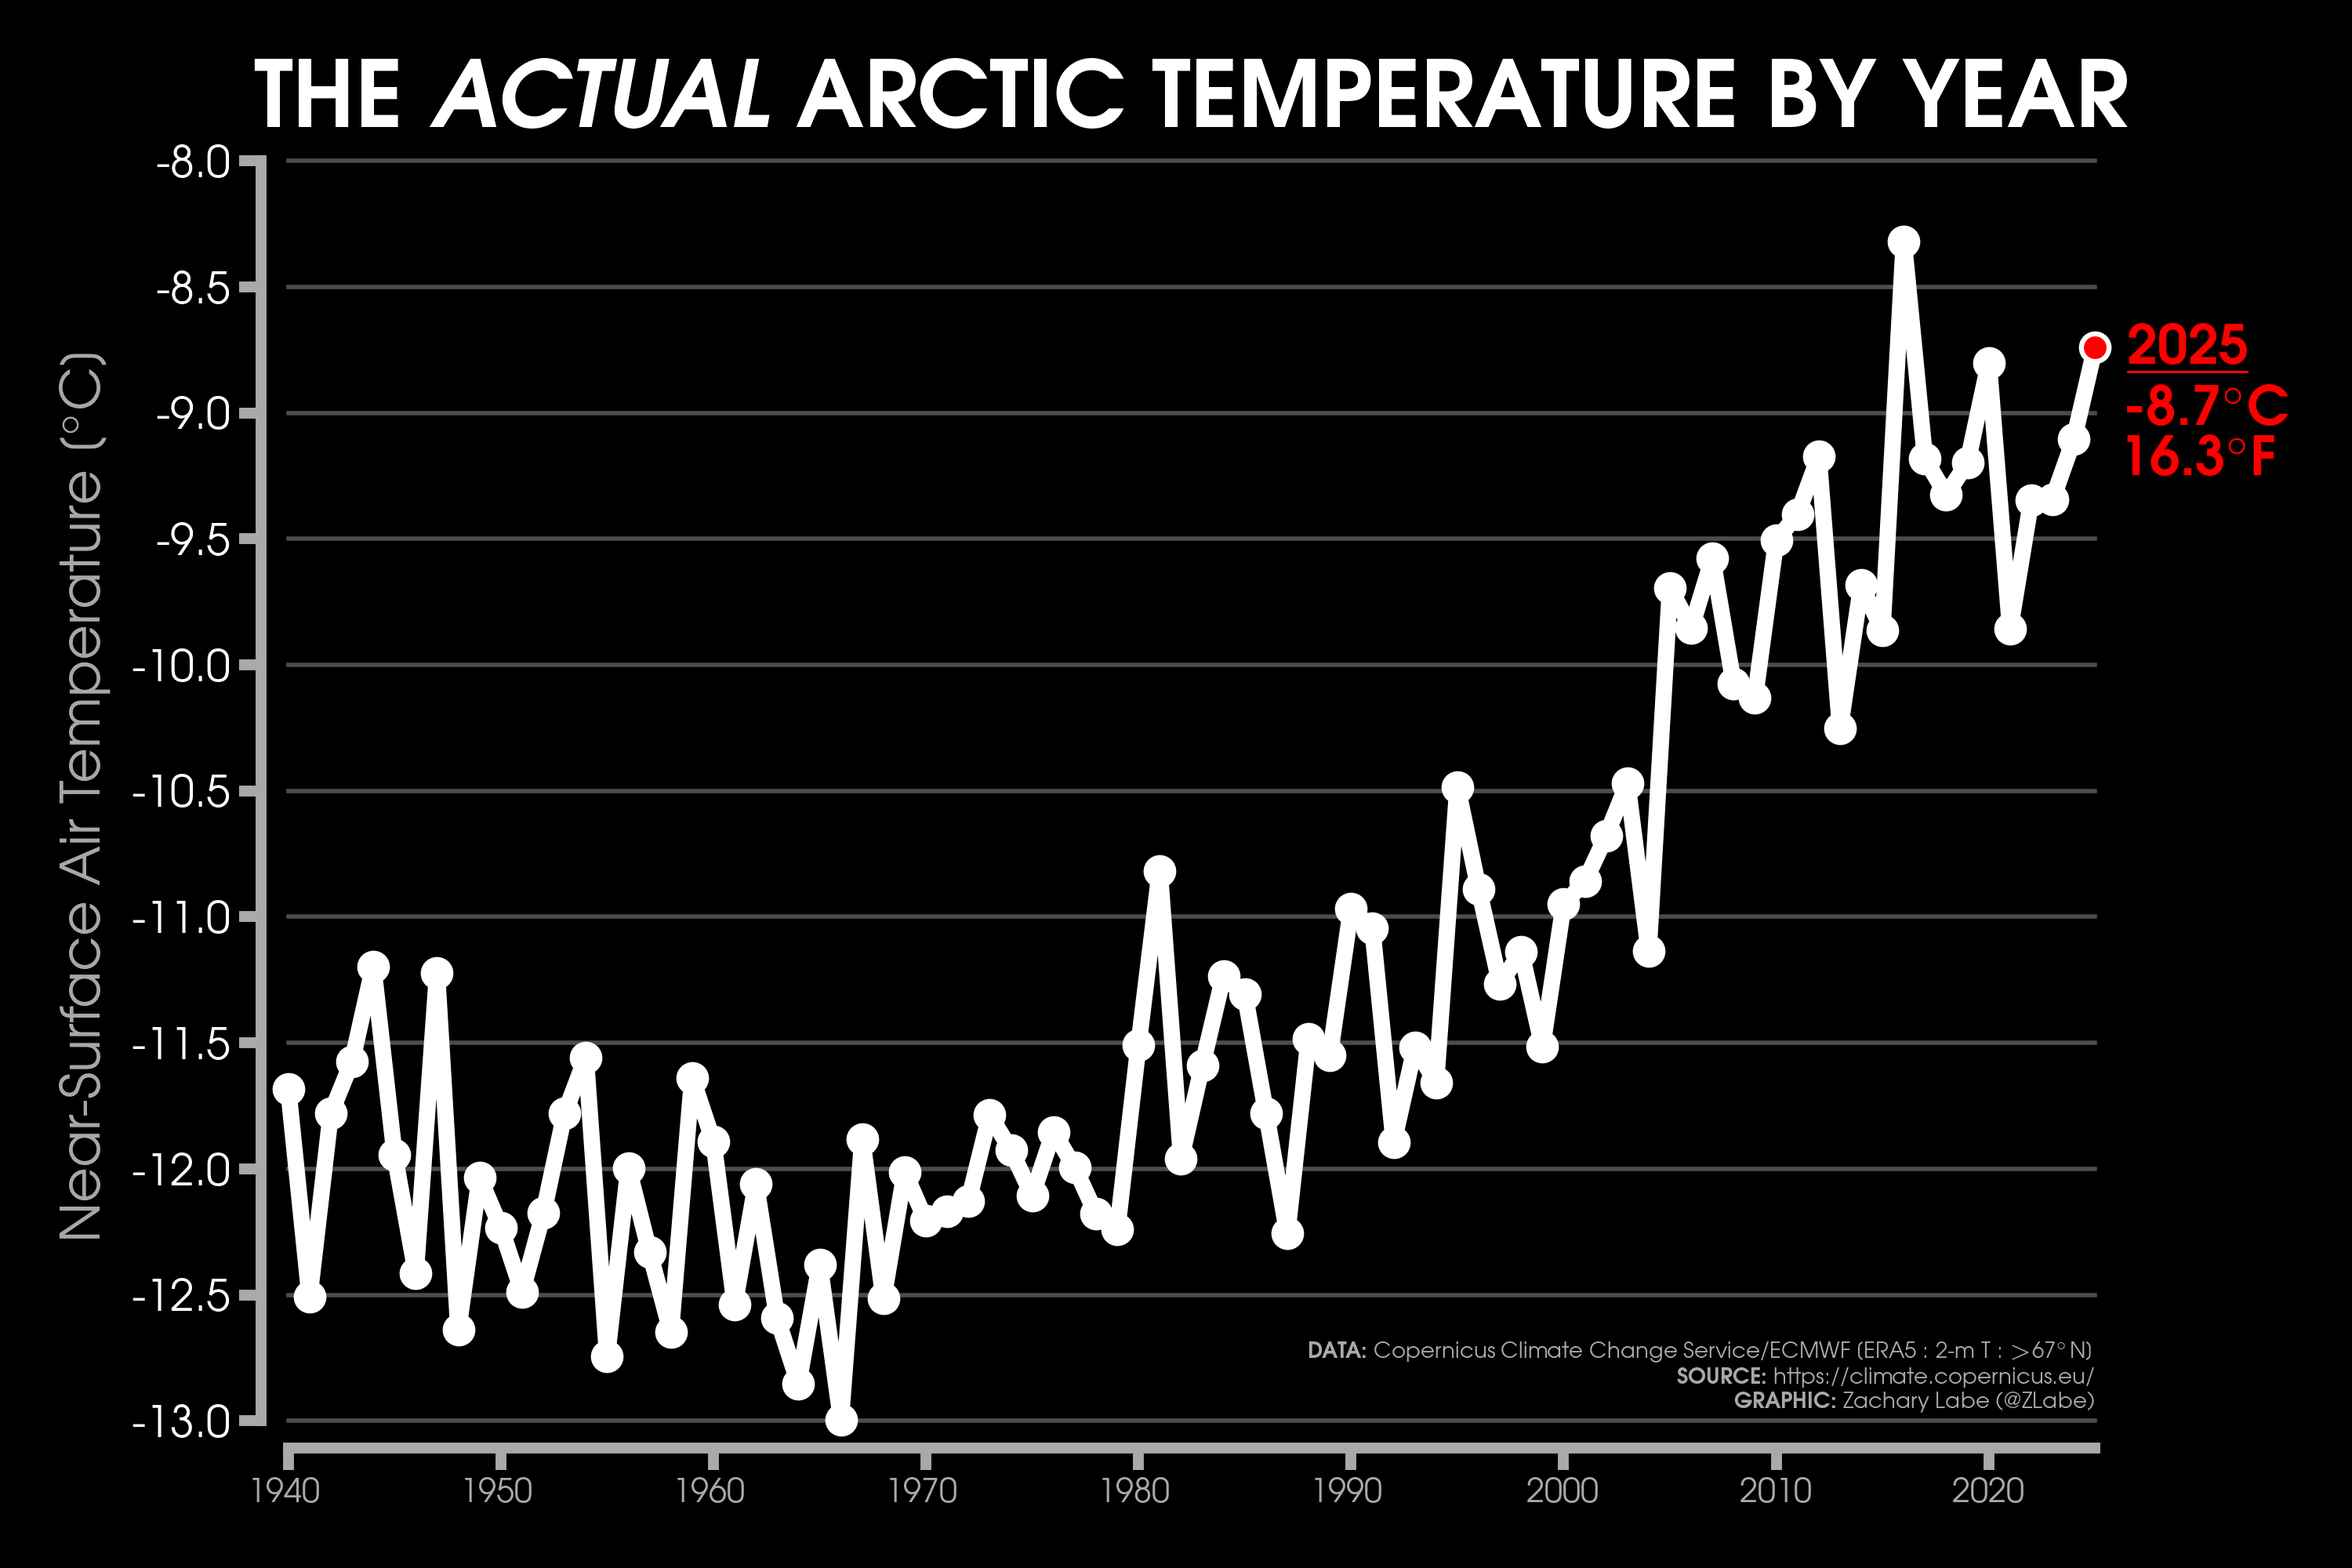
Monthly 2-m air temperatures for the Arctic using ERA5 reanalysis (area averaged north of 70°N). Individual years from 1940-2025 are shown by the sequential blue to white lines. 2026 is indicated by the red line. Due to preliminary data from ERA5T (for 2026), this graphic will be updated at a 1-month lag. Updated through May 2026.Monthly 2-m air temperature anomalies for the Arctic using ERA5 reanalysis (area averaged north of 70°N). Individual years from 1940-2025 are shown by the sequential blue to red lines. 2026 is indicated by the yellow line. Due to preliminary data from ERA5T (for 2026), this graphic will be updated at a 1-month lag. Anomalies are calculated from a 1951-1980 climate baseline. Updated through May 2026.2026’s monthly 2-m air temperature anomalies for six regions in the Arctic using ERA5 reanalysis. Shading indicates the maximum and minimum temperature anomalies for each month over the 1940-2025 period of record. Due to preliminary data from ERA5T (for 2026), this graphic will be updated at a 1-month lag. Anomalies are calculated from a 1951-1980 climate baseline. Updated through May 2026.Monthly mean near-surface air temperatures and anomalies for May 2026 in the Arctic. Anomalies are computed relative to a 1981-2010 baseline. Data is from ERA5 reanalysis.Monthly temperature anomalies from ERA5 reanalysis of 2-m air temperatures in the Arctic using definitions latitudinal definitions for 2026. Anomalies are computed relative to a climatological baseline of 1981-2010. Figure is updated through May 2026.Daily 2 m surface air temperature for the Arctic averaged above 80°N. Individual years from 1958-2025 are shown by the sequential blue/purple to yellow lines. 2026 is indicated by the red line. ERA40 has been applied for the 1958-2002 climatology (white line), while the operational ECMWF is used for the current year. This figure is modified from the Danish Meteorological Institute with more information available at http://ocean.dmi.dk/arctic/meant80n.uk.php.Total freezing degree days (FDD) in the Arctic (80°N+) calculated from ERA40 and ECMWF. Data modified from http://ocean.dmi.dk/arctic/meant80n.uk.php (DMI) and updated through 2026. FDD are summed over the differences from the freezing point of sea water (-1.8°C).Total freezing degree days (FDD) anomalies in the Arctic (80°N+) calculated from ERA40 and ECMWF. Data modified from http://ocean.dmi.dk/arctic/meant80n.uk.php (DMI) and updated through 2026. FDD are summed over the differences from the freezing point of sea water (-1.8°C). Anomalies are calculated from the ERA40 1958-2002 mean.Total thawing degree days (TDD) in the Arctic (80°N+) calculated from ERA40 and ECMWF. Data modified from http://ocean.dmi.dk/arctic/meant80n.uk.php (DMI) and updated through 2026. TDD are summed over the differences above the freezing point of sea water (-1.8°C).Annual average 2-m temperature anomalies in the Arctic (67°N+) for various reanalysis data sets. Anomalies are calculated from a 1981-2010 baseline. NCEP/NCAR (R1) is available from 1948 to 2025 at https://www.esrl.noaa.gov/psd/data/gridded/data.ncep.reanalysis.html. NCEP-DOE (R2) is available from 1979 to 2025 at https://www.esrl.noaa.gov/psd/data/gridded/data.ncep.reanalysis2.html. CFSR data is available from 1979 to 2025 at https://rda.ucar.edu/datasets/ds093.1/. MERRA-2 is available from 1980 to 2025 at https://gmao.gsfc.nasa.gov/reanalysis/MERRA-2/. JRA-55 is available from 1958 to 2023 at http://jra.kishou.go.jp/JRA-55/index_en.html. ERA-Interim (ERAi) is available from 1979 to 2018 at https://www.ecmwf.int/en/research/climate-reanalysis/era-interim. ERA5 is available from 1979-2025 at https://apps.ecmwf.int/data-catalogues/era5/. Tools including the NOAA/PSL Web-based Reanalysis Intercomparison Tool: Monthly/Seasonal Time Series (WRIT) have been used for the construction of this plot. Analysis will updated as annual data becomes available. Additional reanalysis data sets will also be added with time. Graphic was last updated on 3/23/2026.Annual average surface/2-m temperature anomalies in the Arctic (67°N+) for various reanalysis data sets. Anomalies are calculated from a 1981-2010 baseline. GISS Surface Temperature Analysis (GISTEMP) is available from 1880 to 2025 at https://data.giss.nasa.gov/gistemp/. Berkeley Earth Surface Temperature (Berkeley) is available from 1850 to 2024 at http://berkeleyearth.org/data/. NOAA Merged Land Ocean Global Surface Temperature Analysis (NOAAGlobalTemp) is available from 1850 to 2025 at https://www.ncei.noaa.gov/products/land-based-station/noaa-global-temp. Twentieth Century Reanalysis (20CRv2c) is available from 1851 to 2014 at https://www.esrl.noaa.gov/psd/data/gridded/data.20thC_ReanV2c.pressure.html. NOAA-CIRES-DOE Twentieth Century Reanalysis (20CRv3) is available from 1836 to 2015 at https://www.esrl.noaa.gov/psd/data/gridded/data.20thC_ReanV3.html. ERA-20C is available from 1900 to 2010 at http://apps.ecmwf.int/datasets/data/era20c-daily/levtype=sfc/type=an/. JRA-55 is available from 1958 to 2023 at http://jra.kishou.go.jp/JRA-55/index_en.html. ERA5 is available from 1979-2025 at https://apps.ecmwf.int/data-catalogues/era5/. Tools including the NOAA Physical Sciences Laboratory Web-based Reanalysis Intercomparison Tool: Monthly/Seasonal Time Series (WRIT) were used for the construction of this plot. Analysis will be updated as annual data becomes available. Graphic was last updated on 2/9/2026.Annual mean surface air temperature anomalies for the Arctic (67-90°N) and for the Global average (90°S-90°N) from 1950 to 2025. Linear trend lines (dashed) are also shown over the 1990 to 2025 period. GISS Surface Temperature Analysis (GISTEMPv4) is available from 1880 to 2025 at https://data.giss.nasa.gov/gistemp/. Tools including the NOAA/ESRL Physical Sciences Division Web-based Reanalysis Intercomparison Tool: Monthly/Seasonal Time Series (WRIT) have been used for the construction of this plot. Analysis will updated as annual data becomes available. Graphic was updated on 1/17/2026.Annual mean surface air temperature anomalies for the Arctic (67-90°N; white line), the global average over land areas (90°S-90°N; red line), and the global average over ocean areas (90°S-90°N; blue line) from 1900 to 2025. Linear trend lines (dashed) are also shown over the 1990 to 2025 period. GISS Surface Temperature Analysis (GISTEMPv4) is available from 1880 to 2025 at https://data.giss.nasa.gov/gistemp/. Tools including the NOAA/ESRL Physical Sciences Division Web-based Reanalysis Intercomparison Tool: Monthly/Seasonal Time Series (WRIT) have been used for the construction of this plot. Analysis will updated as annual data becomes available. Graphic was updated on 1/17/2026.Average surface temperature anomalies in the Arctic (67°N+) calculated for each climatological season from 1979 through 2025. Anomalies are calculated from a 1981-2010 baseline. Data is from NOAA Merged Land Ocean Global Surface Temperature Analysis (NOAAGlobalTemp v6.0.0; https://www.ncei.noaa.gov/products/land-based-station/noaa-global-temp). Analysis will be updated at the end of each year. Graphic was updated on 2/8/2026.Annual mean surface air temperature anomalies for the entire globe from 1880 through 2025. A 5-year lowess smoothing line is also shown for this time series. See more on this temperature variability in Labe and Barnes (2022) (https://doi.org/10.1029/2022GL098173). GISS Surface Temperature Analysis (GISTEMPv4) is available from 1880 to 2025 at https://data.giss.nasa.gov/gistemp/. Analysis will updated with each year.Mean 925 hPa air temperature north of 67°N (Arctic Circle) over 1949-2026 (October – February). Temperature reanalysis from NCEP/NCAR R1. Subplot highlights 925 hPa air temperature anomalies averaged from October – February 2026 using a 1991-2020 baseline. (Updated 3/4/2026)Changes in annual mean Arctic sea ice extent (NSIDC, Sea Ice Index v4) and air temperature anomalies (NOAA Merged Land Ocean Global Surface Temperature Analysis; NOAAGlobalTemp v6.0.0) over the satellite era. NOAAGlobalTemp v6.0.0 is available from 1850 to 2025 at https://www.ncei.noaa.gov/products/land-based-station/noaa-global-temp. Updated 2/9/2026.Temperature rankings (1 = warmest, 48 = coldest) from ERA5 reanalysis of Arctic 925 hPa air temperatures (70N+). Figure is updated through May 2026.Zonal-mean cross-section (latitude vs. height) of decadal trends in annual mean temperature for the Northern Hemisphere (0-90°N). Trends are calculated using ERA5 reanalysis over the 1979 to 2025 period. Graphic updated on 2/11/2026.Monthly temperature anomalies and rankings (1 = warmest, 47 = coldest) from ERA5 reanalysis of 2-m air temperatures in the Arctic (70°N+). Anomalies are computed relative to a climatological baseline of 1981-2010. Figure is updated through 2025 on 2/8/2026.Monthly temperature anomalies and rankings (1 = warmest, 86 = coldest) from ERA5 reanalysis of 2-m air temperatures in the Arctic (64N+) from January 1940 to December 2025. Anomalies for each month/year are computed relative to a climatological baseline of 1951-1980. Figure is updated through 2025 on 2/8/2026.Zonal-mean (45°N to 90°N) cross-section (latitude vs. height) of decadal air temperature trends in boreal winter (December-January-February). Trends are calculated using ERA5 reanalysis over the 1980 to 2025 period. This figure was adapted from Labe et al. [2020, GRL].Monthly 2-m air temperature anomalies from ERA5 reanalysis in the Arctic (67°N+) from January 1950 to December 2025 in a Hovmöller-like diagram. Anomalies for each month/year are computed relative to a climatological baseline of 1951-1980. Figure is updated through the year 2025. Graphic plotted on 1/10/2026Animation of annual mean near-surface temperature anomalies in the Arctic for each year from 1950 to 2025. Data is from ERA5 (https://doi.org/10.24381/cds.f17050d7). Anomalies are calculated relative to a 1951 to 1980 climate baseline. Graphic was updated on 1/20/2026.Visualization example of mean surface air temperature anomalies averaged over the Arctic Circle using NASA/GISS GISTEMPv4. Each line computes the temperatures anomalies relative to a different reference period (i.e., baseline), which are listed below. This graphic is designed using Python’s ‘matplotlib’ and colors from the ‘Palettable’ package. Updated through 2025.Annual mean temperature anomalies over the last 120 years in the Arctic. Data is from Berkeley Earth Surface Temperatures (BEST; http://berkeleyearth.org/data/) using a reference period of 1951-1980. Graphic updated through 2025 on 2/1/2026.Surface air temperature anomalies over the Arctic during the satellite-era in boreal fall (October to December). This period coincides with the largest Arctic amplification trends. Data is from Berkeley Earth Surface Temperatures (BEST; http://berkeleyearth.org/data/) using a reference period of 1951-1980. Graphic updated from 1979 through 2025 on 2/1/2026.Changes in average October through February Arctic sea ice extent (NSIDC, Sea Ice Index v4) and air temperature anomalies from ERA5 reanalysis (+67°N latitude; 1981-2010 baseline) over the satellite era. Mean monthly periods are calculated from 1979-1980 (denoted as 1980) through 2025-2026 (denoted as 2026). Updated 3/9/2026.Average near-surface (2-m) air temperature for each year from 1940 to 2025 over the Arctic Circle (north of 67°N latitude). Data is from ERA5 reanalysis. The actual mean Arctic temperature in 2025 was approximately -8.7°C (16.3°F). Updated 2/8/2026.
[4]Labe, Z.M. and E.A. Barnes (2022), Comparison of climate model large ensembles with observations in the Arctic using simple neural networks. Earth and Space Science, DOI:10.1029/2022EA002348 [HTML][BibTeX][Code] [Plain Language Summary]
[1]Labe, Z.M., Y. Peings, and G. Magnusdottir (2018), Contributions of ice thickness to the atmospheric response from projected Arctic sea ice loss, Geophysical Research Letters, DOI:10.1029/2018GL078158 [HTML][BibTeX] [Plain Language Summary][Arctic Today]
All of the Python code used to generate these figures are available from my GitHub account. Most scripts use data sets that are generated via ftp retrieval.
*These figures may be freely distributed (with credit). Information about the data can be found on my references page and methods page.