Hi! My name is Zack! I’m a climate scientist looking to find the signal in all the noise. I use data-driven methods to untangle climate change patterns from natural variability, providing clearer insights into climate risks. I also spend a lot of time thinking about how to make science more engaging through storytelling and visualization.
Climate model projections compared to observations in the Arctic
Note: The climate model projections here primarily use SSP3-7.0/RCP8.5, which consider extreme greenhouse gas emissions scenarios (outliers). I will include more realistic SSP2-4.5 graphics in a future update.
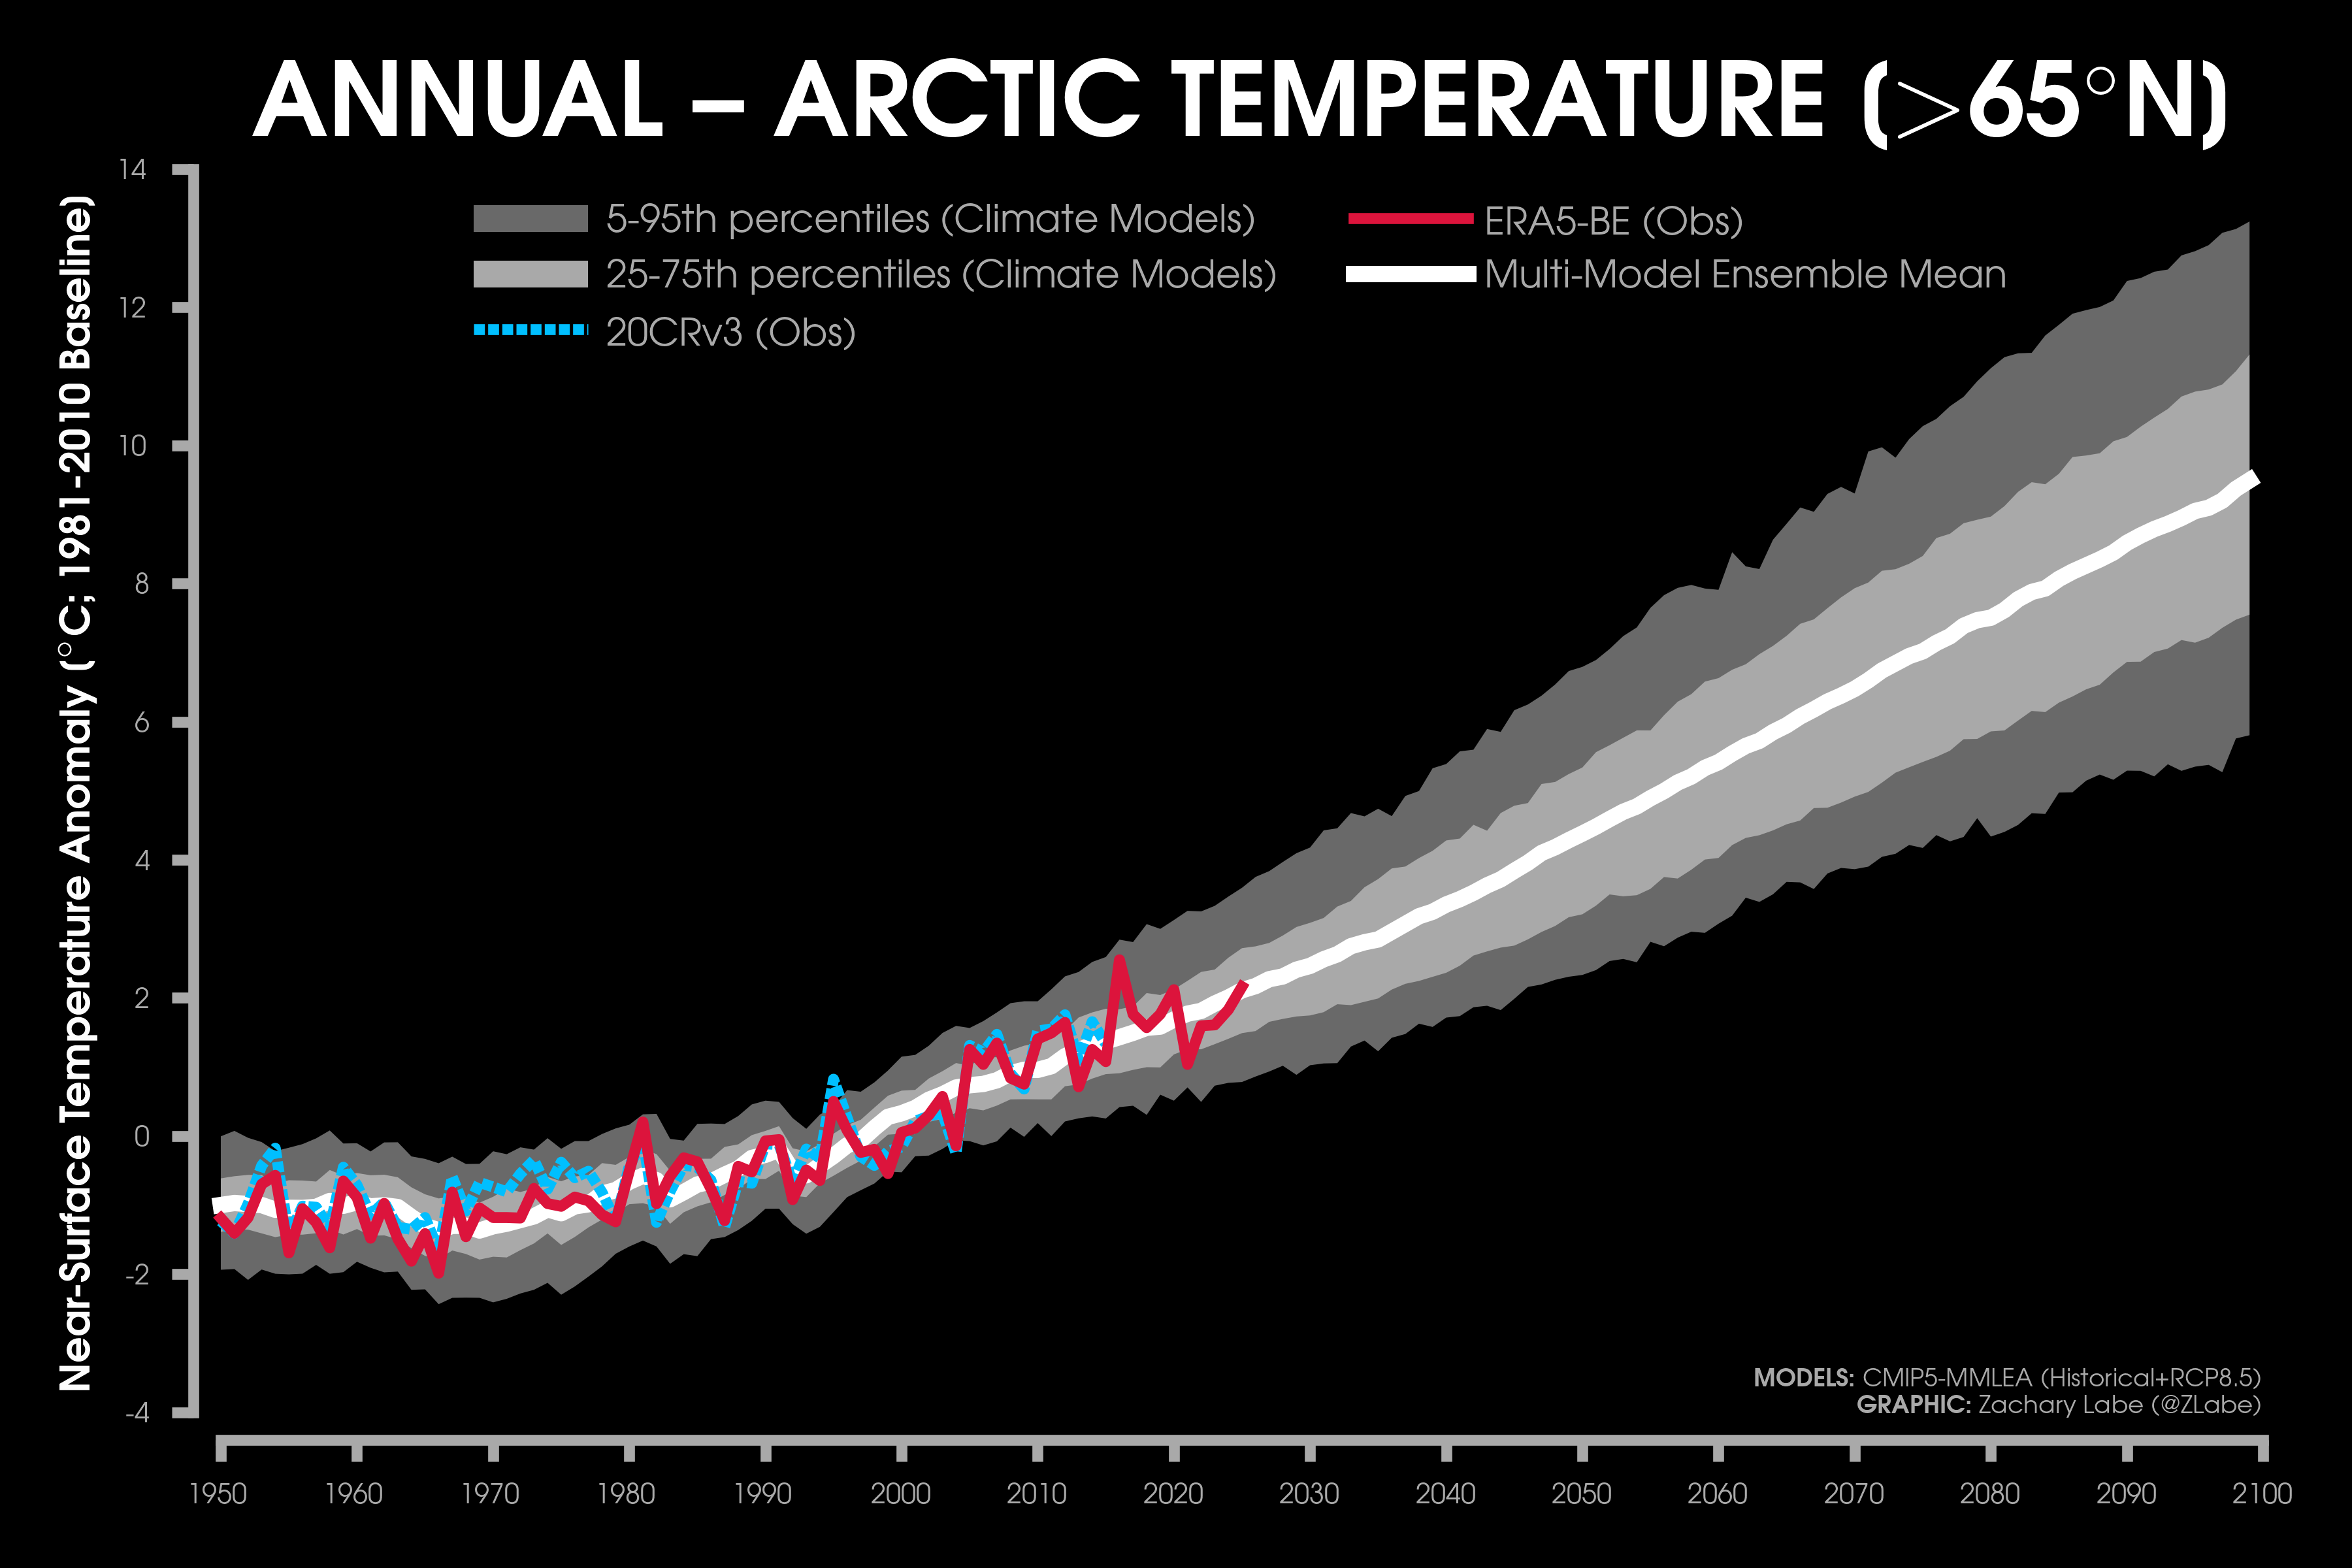
Arctic mean temperature projections (poleward of 65°N Latitude):
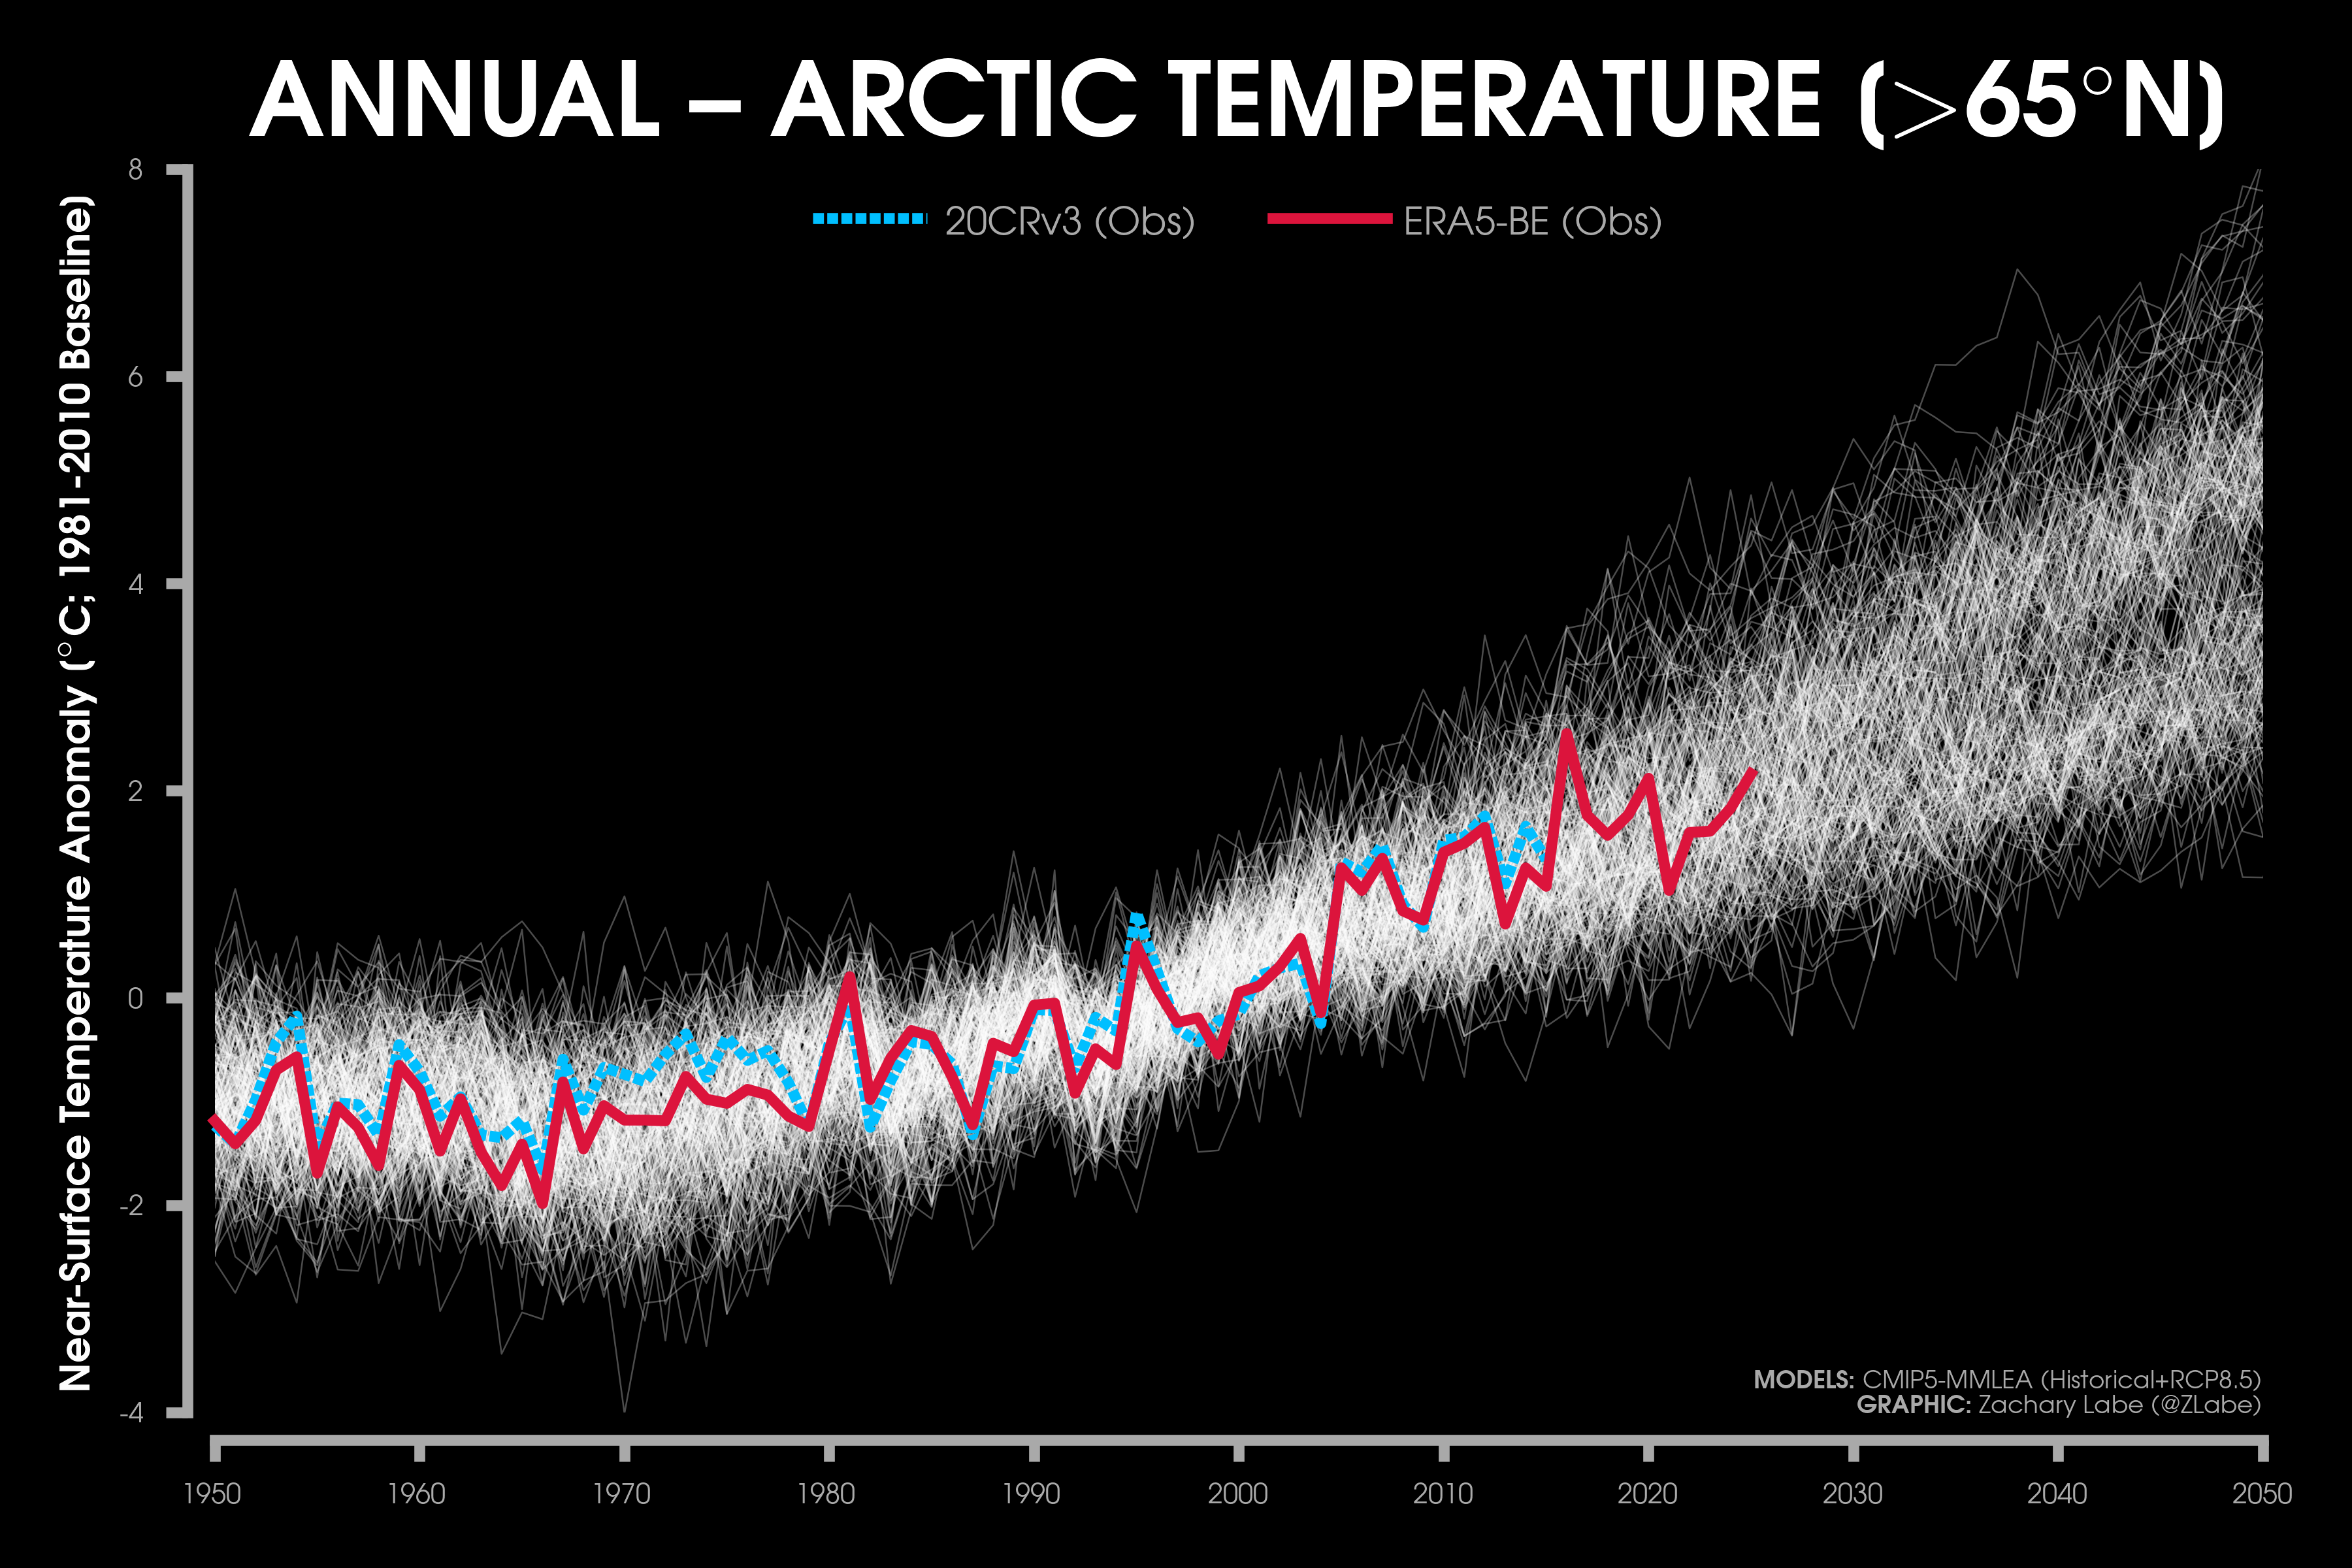
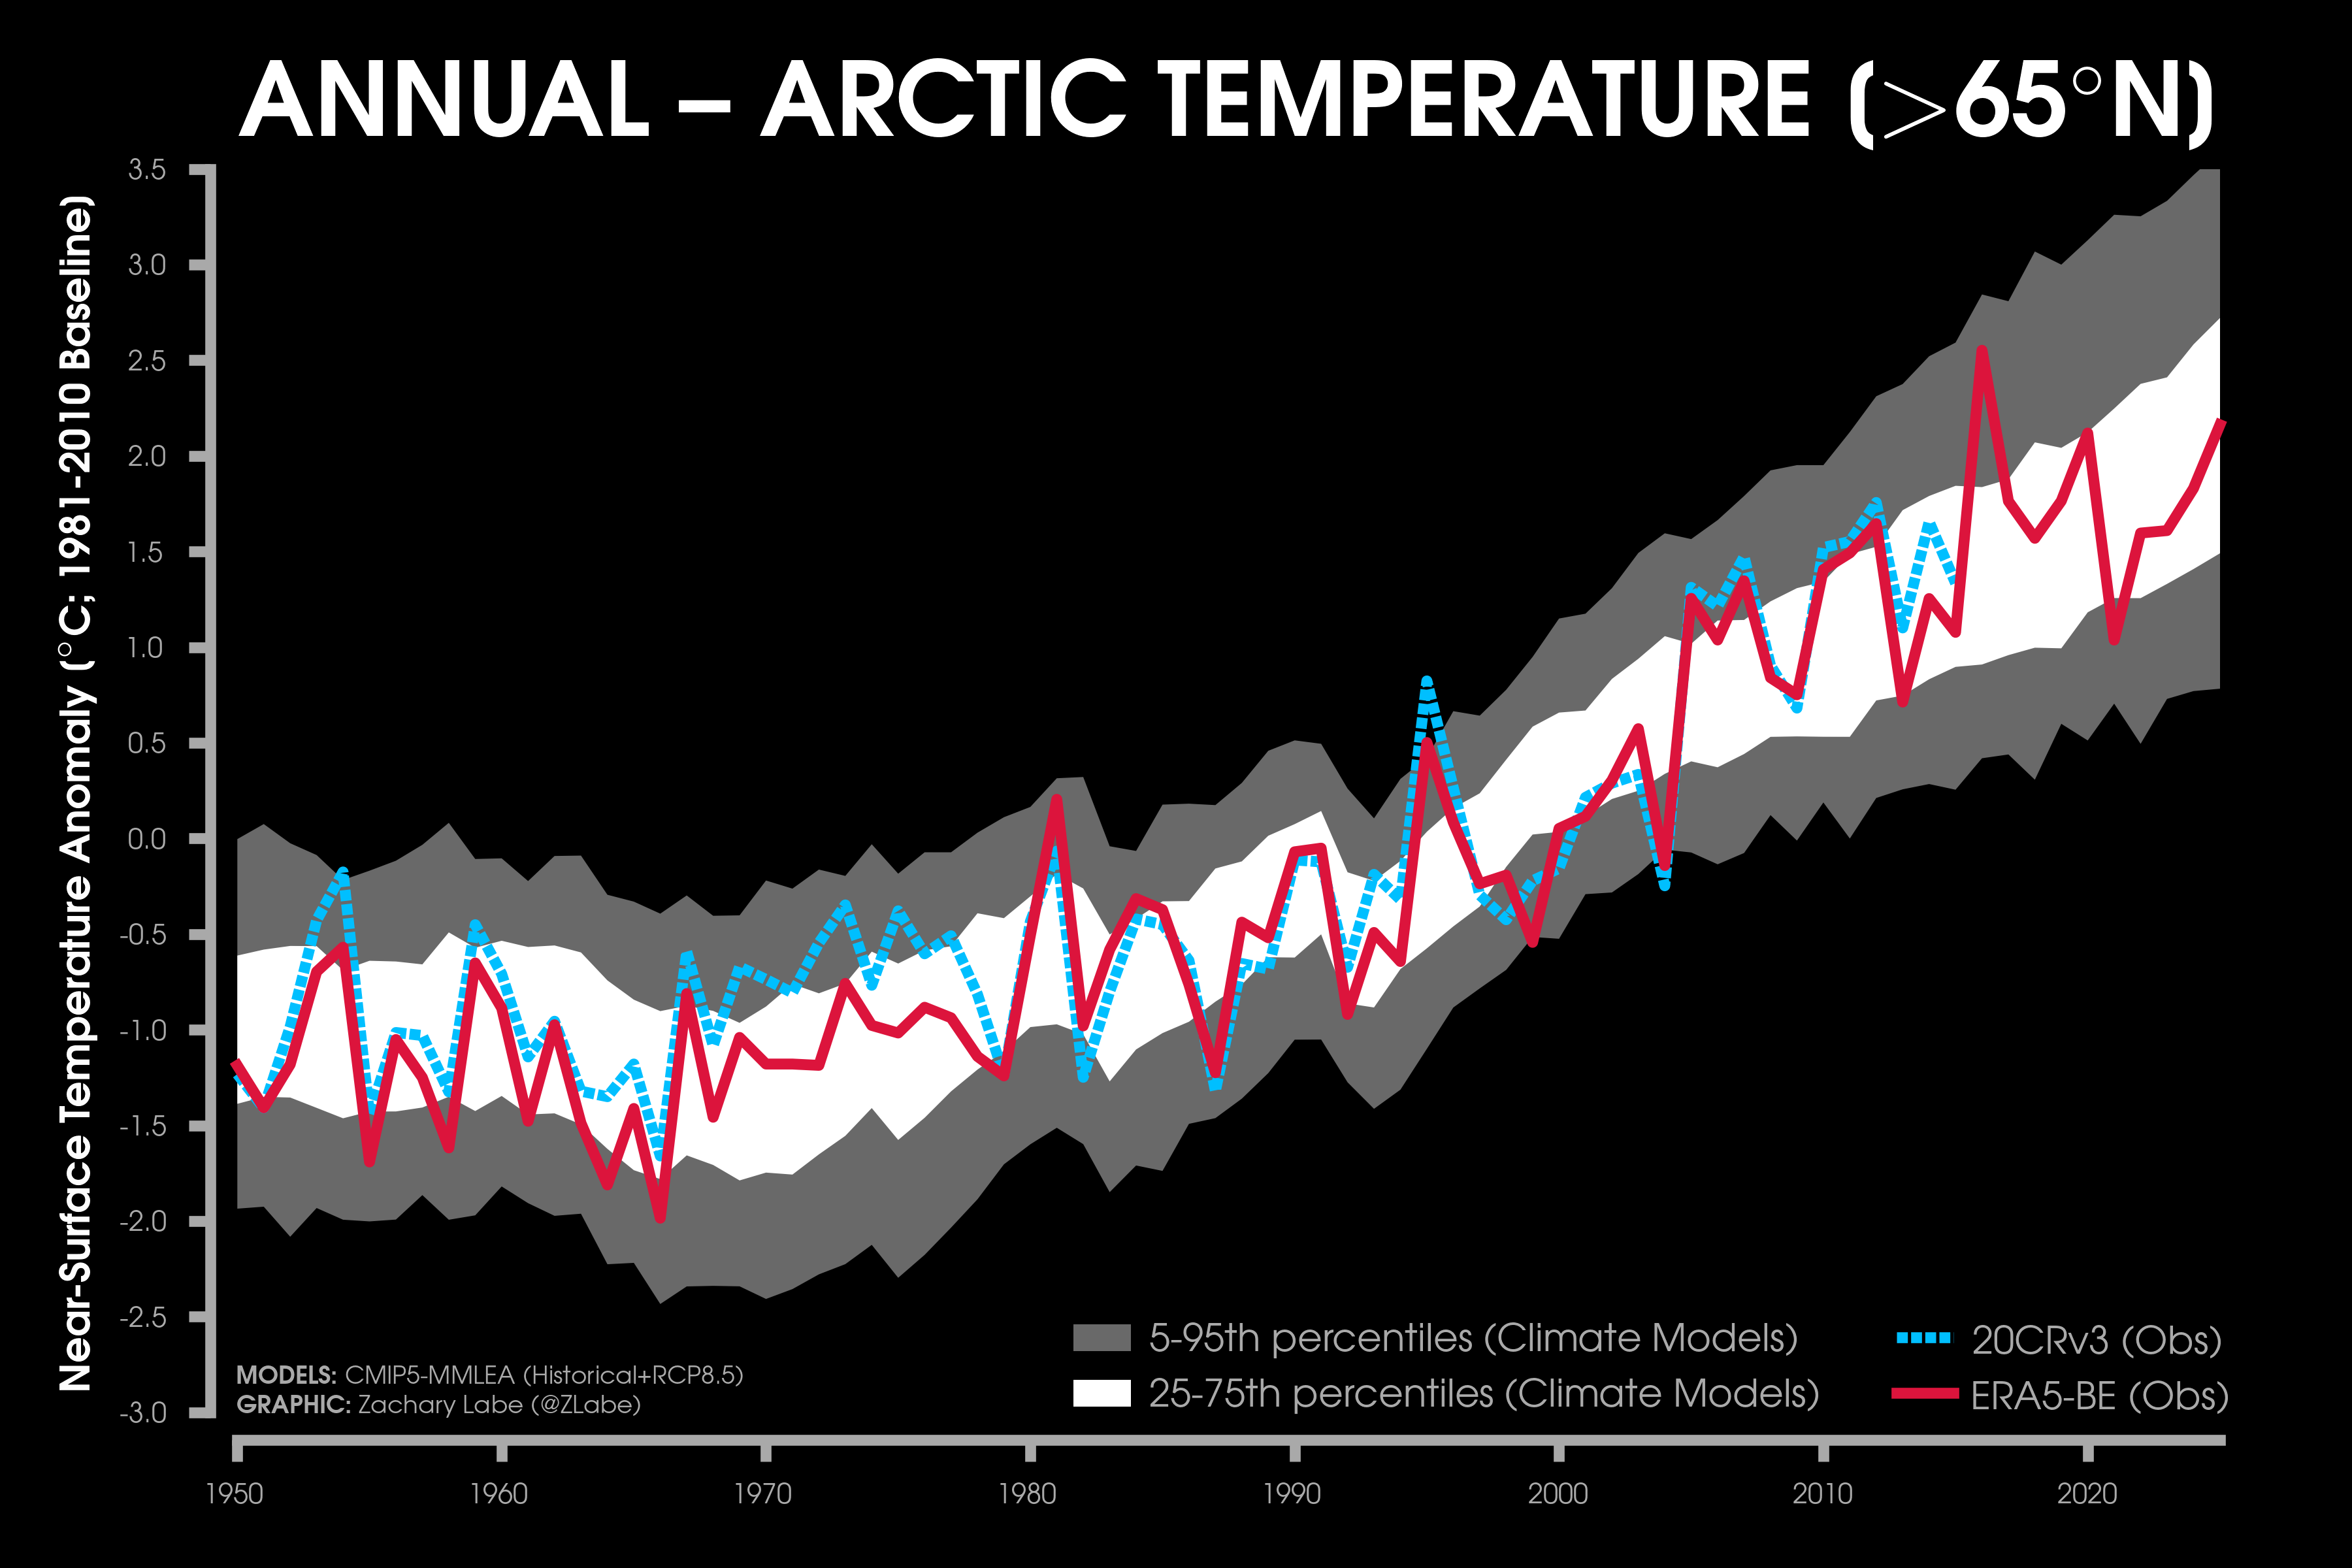
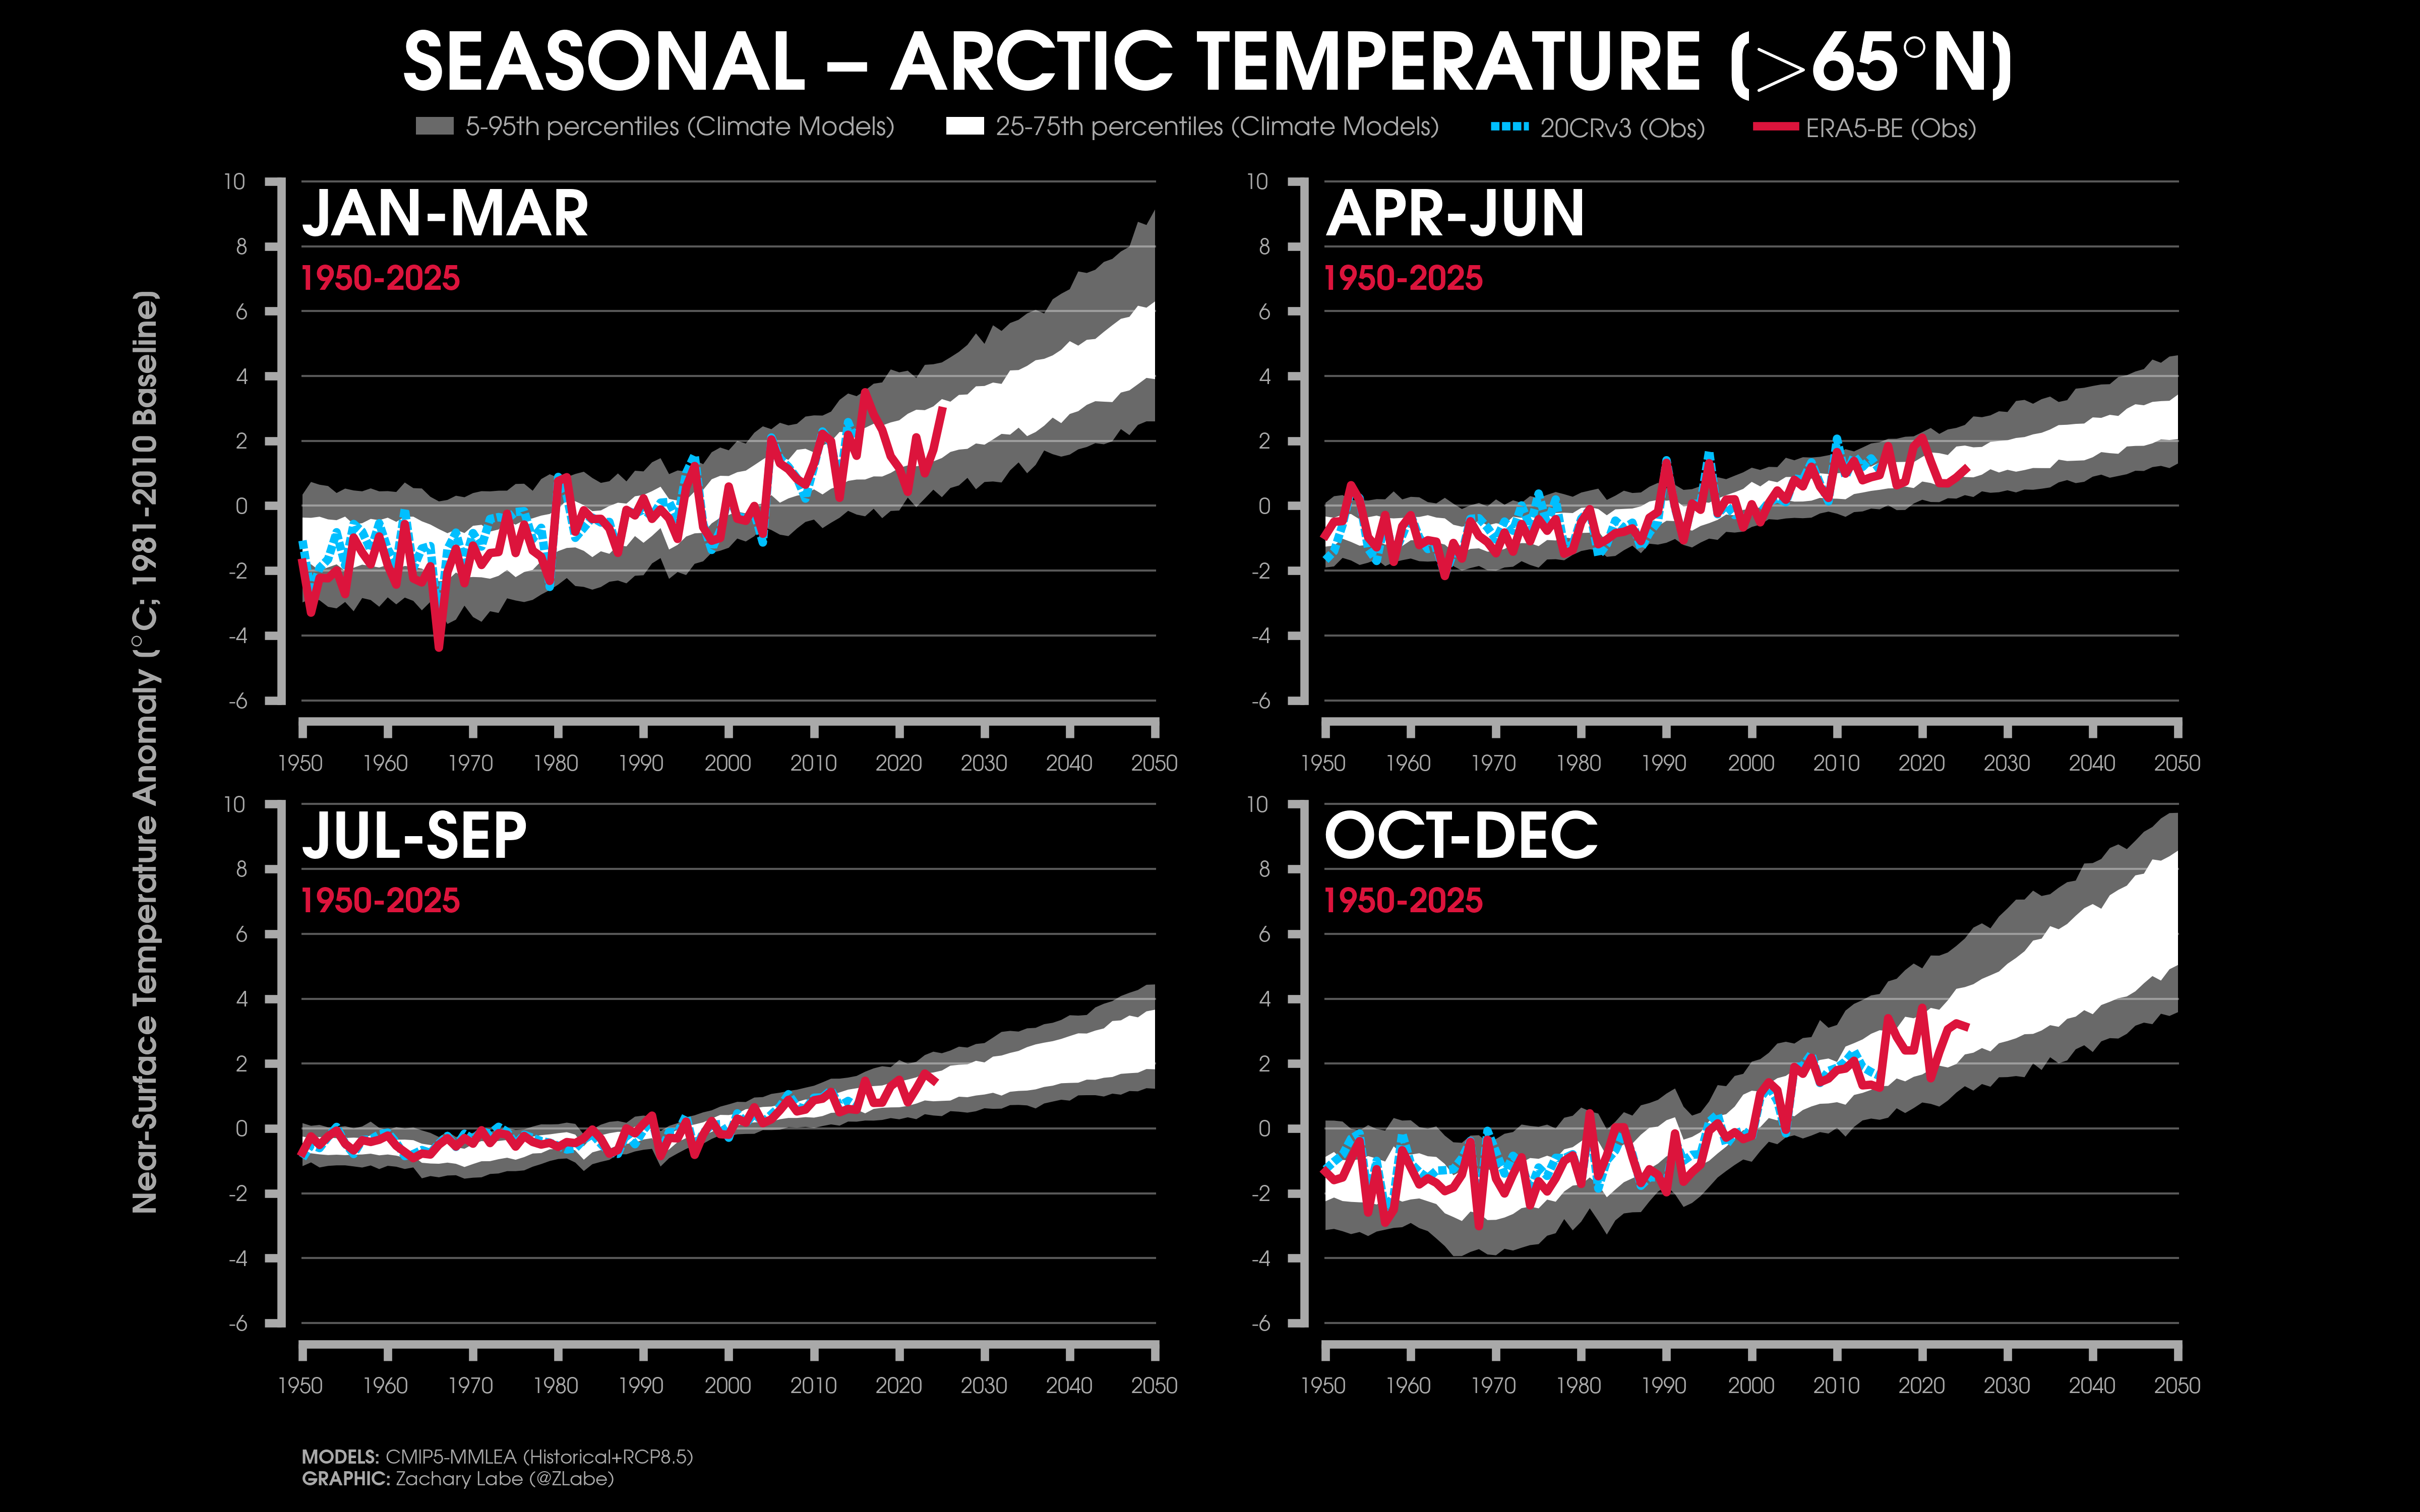
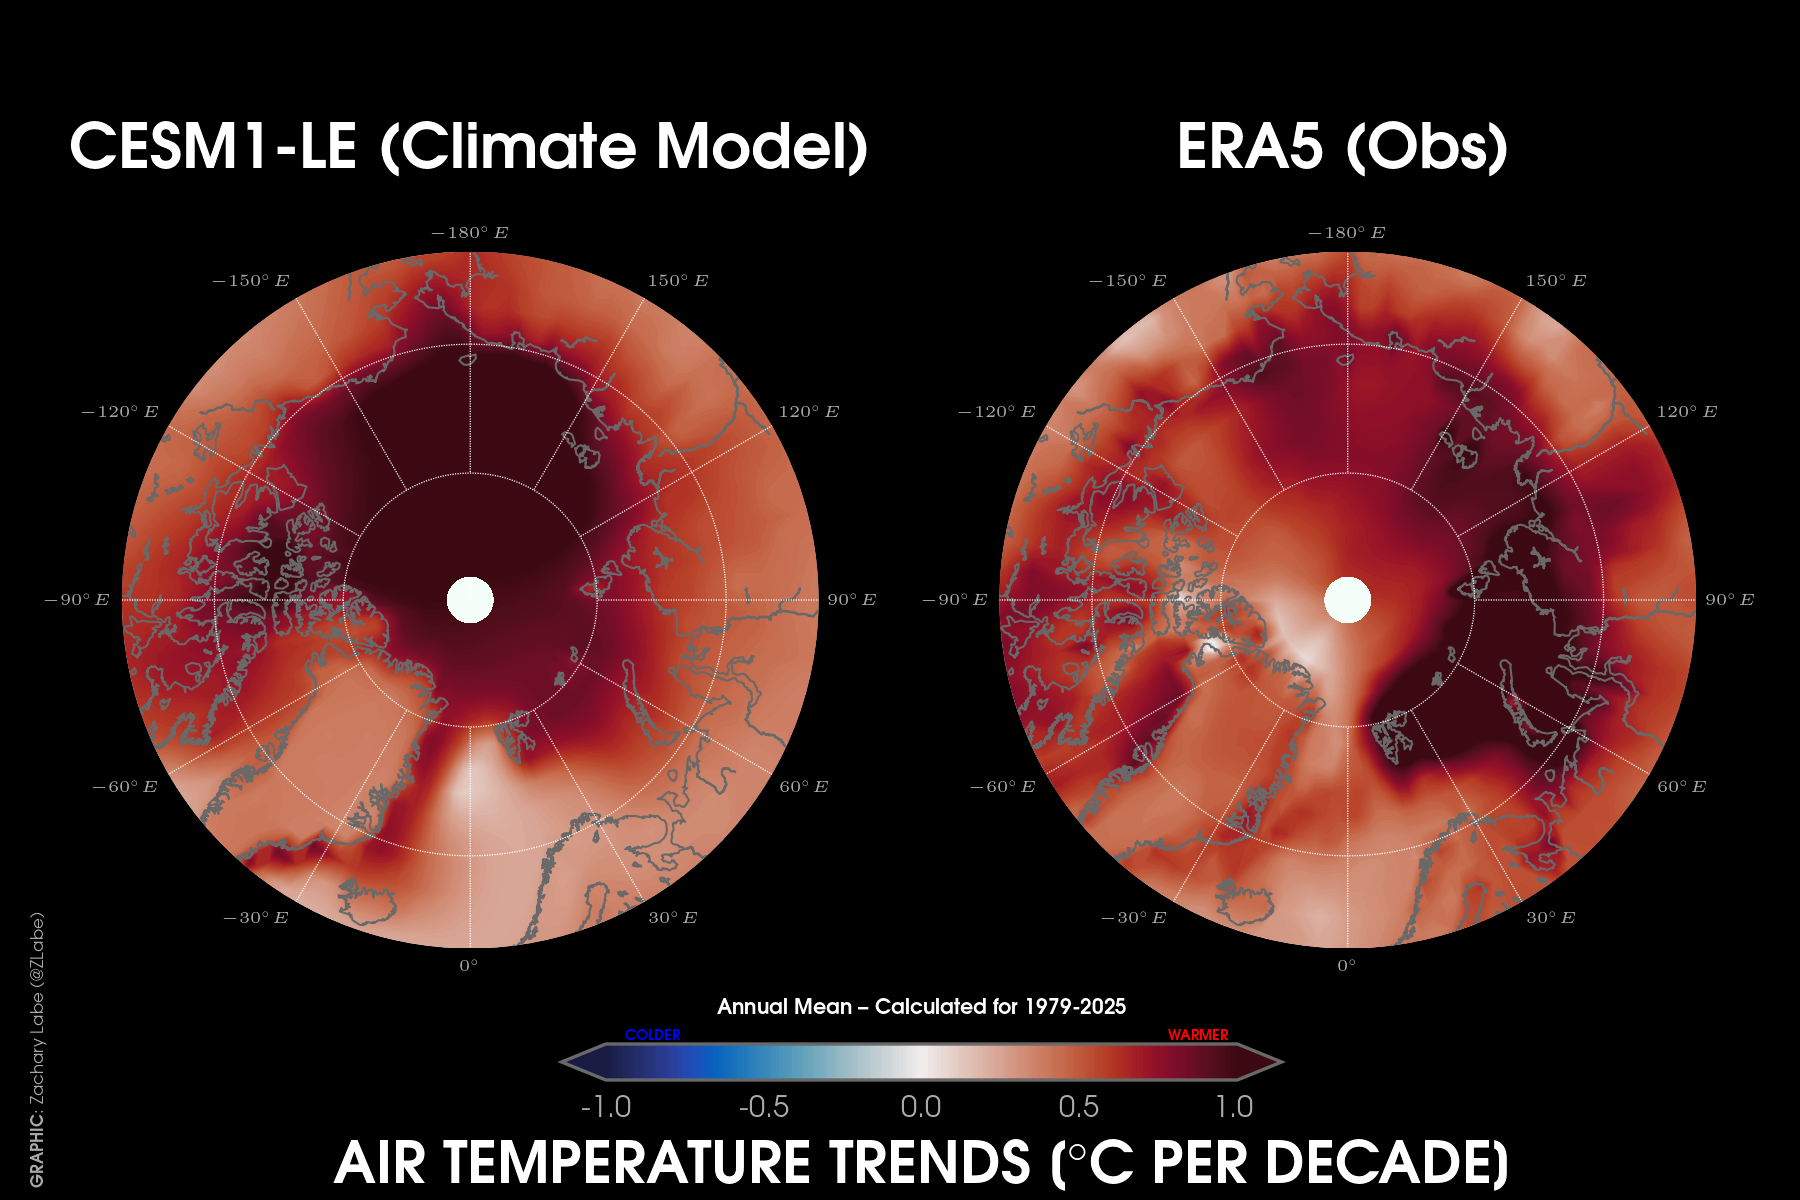
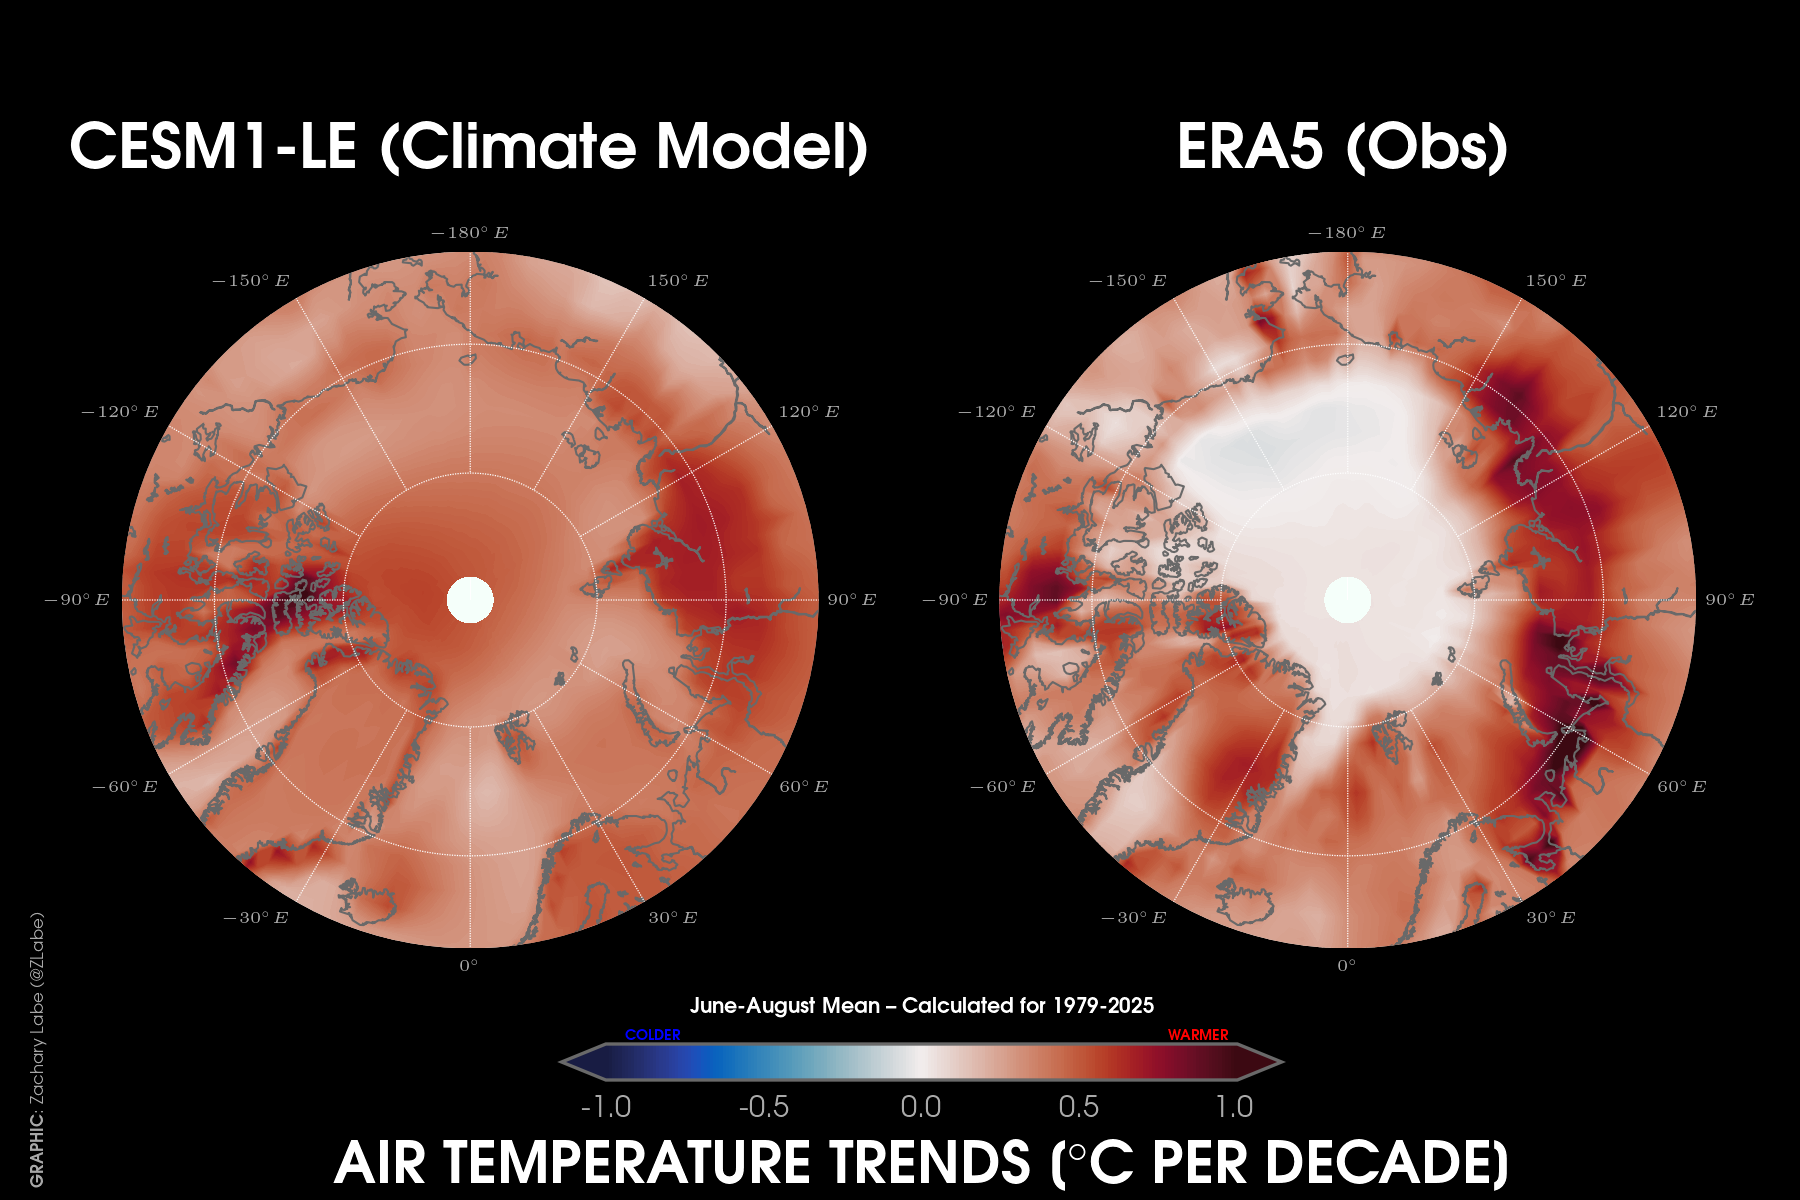
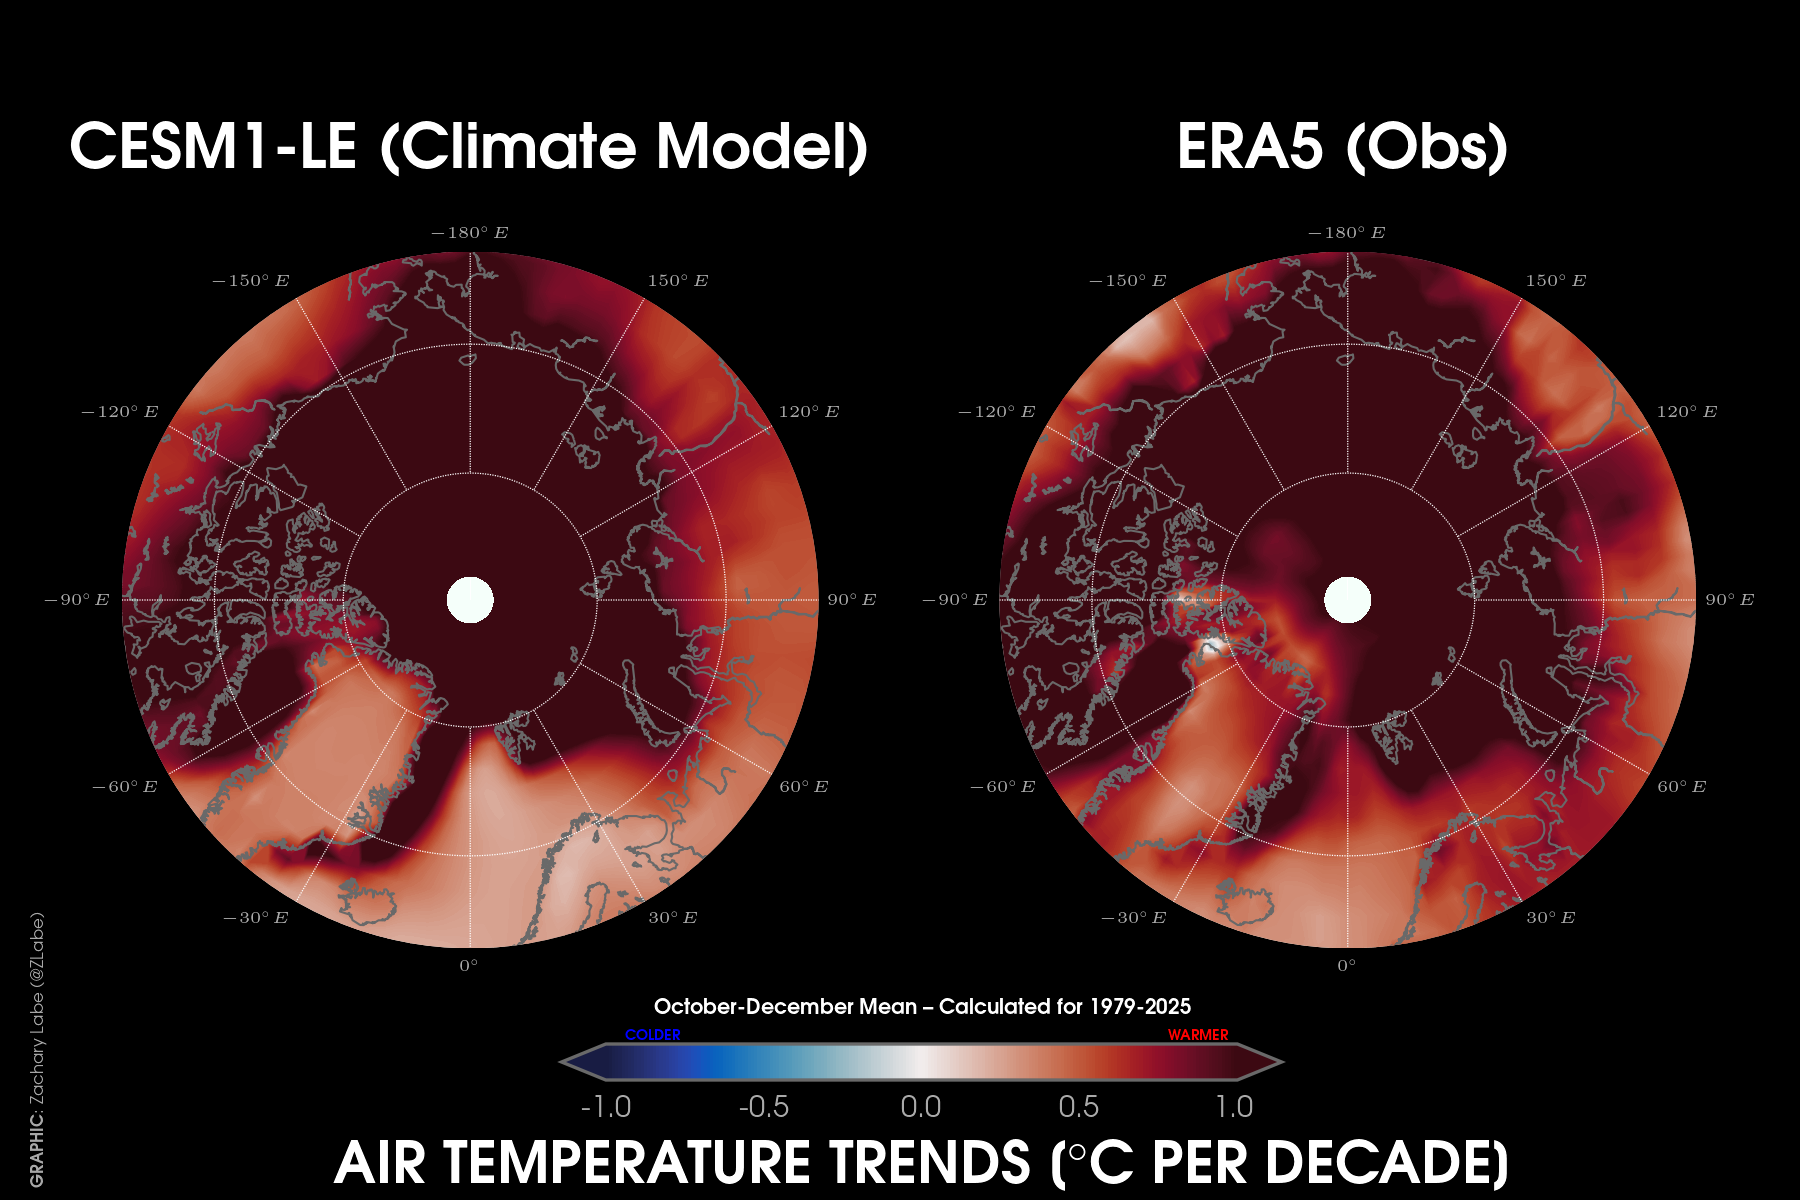
Annual mean near surface temperatures (2-m height; °C) anomalies averaged over the Arctic (north of 65°N latitude) from 1950 to 2025 using observations from the European Centre for Medium-Range Weather Forecasts ERA5 (solid red line) and the National Oceanic and Atmospheric Administration/Cooperative Institute for Research in Environmental Sciences/Department of Energy Twentieth Century Reanalysis (20CR) version 3 (20CRv3; dashed blue line). Note that 20CRv3 is only available from 1950 to 2015. Dark gray shading shows the 5th-95th percentiles of T2M anomalies in the Arctic across 7 global climate model large ensembles from the entire multi-model large ensemble archive (MMLEA) through 2099. Light gray shading shows the 25th-75th percentiles of T2M anomalies in the Arctic across the entire MMLEA through 2099. The white line denotes the multi-model ensemble mean. All climate models are forced with CMIP5 historical forcing from 1950 to 2005 and an extreme high emissions scenario (RCP8.5) from 2006 to 2099. These figures are adapted from Labe and Barnes (2022, ESS). The climate models include: Canadian Earth System Model Large Ensemble (CanESM2; 50 ensemble members), Max Planck Institute Grand Ensemble (MPI; 50 ensemble members), Commonwealth Scientific and Industrial Research Organization Large Ensemble (CSIRO-MK3.6; 30 ensemble members), EC-Earth Consortium Large Ensemble (EC-Earth; 16 ensemble members), Geophysical Fluid Dynamics Laboratory Large Ensemble (GFDL-CM3; 20 ensemble members), Geophysical Fluid Dynamics Laboratory Earth System Model Large Ensemble (GFDL ESM2M; 30 ensemble members), and the Community Earth System Model Large Ensemble Community Project (LENS; 40 ensemble members). All anomalies are computed in respect to their 1981 to 2010 climatology.Same data as above, but only for 1950 to 2050. Each climate model ensemble member is shown with a thin white line.Same data as above, but only for 1950 to 2025.Same data as above, but calculated for each season (January to March, April to June, July to September, and October to December) from 1950 to 2050.Annual-mean near-surface temperature trends from 1979 to 2025 for the ensemble mean of the CESM1 Large Ensemble (RCP8.5 scenario) (left) and ERA5 reanalysis (right). In other words, this is the climate change signal only in one climate model. In reality, internal variability will contribute to more spatial variability in temperature trends (as found in observations).Mean June to August near-surface temperature trends from 1979 to 2025 for the ensemble mean of the CESM1 Large Ensemble (RCP8.5 scenario) (left) and ERA5 reanalysis (right). In other words, this is the climate change signal only in one climate model. In reality, internal variability will contribute to more spatial variability in temperature trends (as found in observations).Mean October to December near-surface temperature trends from 1979 to 2025 for the ensemble mean of the CESM1 Large Ensemble (RCP8.5 scenario) (left) and ERA5 reanalysis (right). In other words, this is the climate change signal only in one climate model. In reality, internal variability will contribute to more spatial variability in temperature trends (as found in observations).
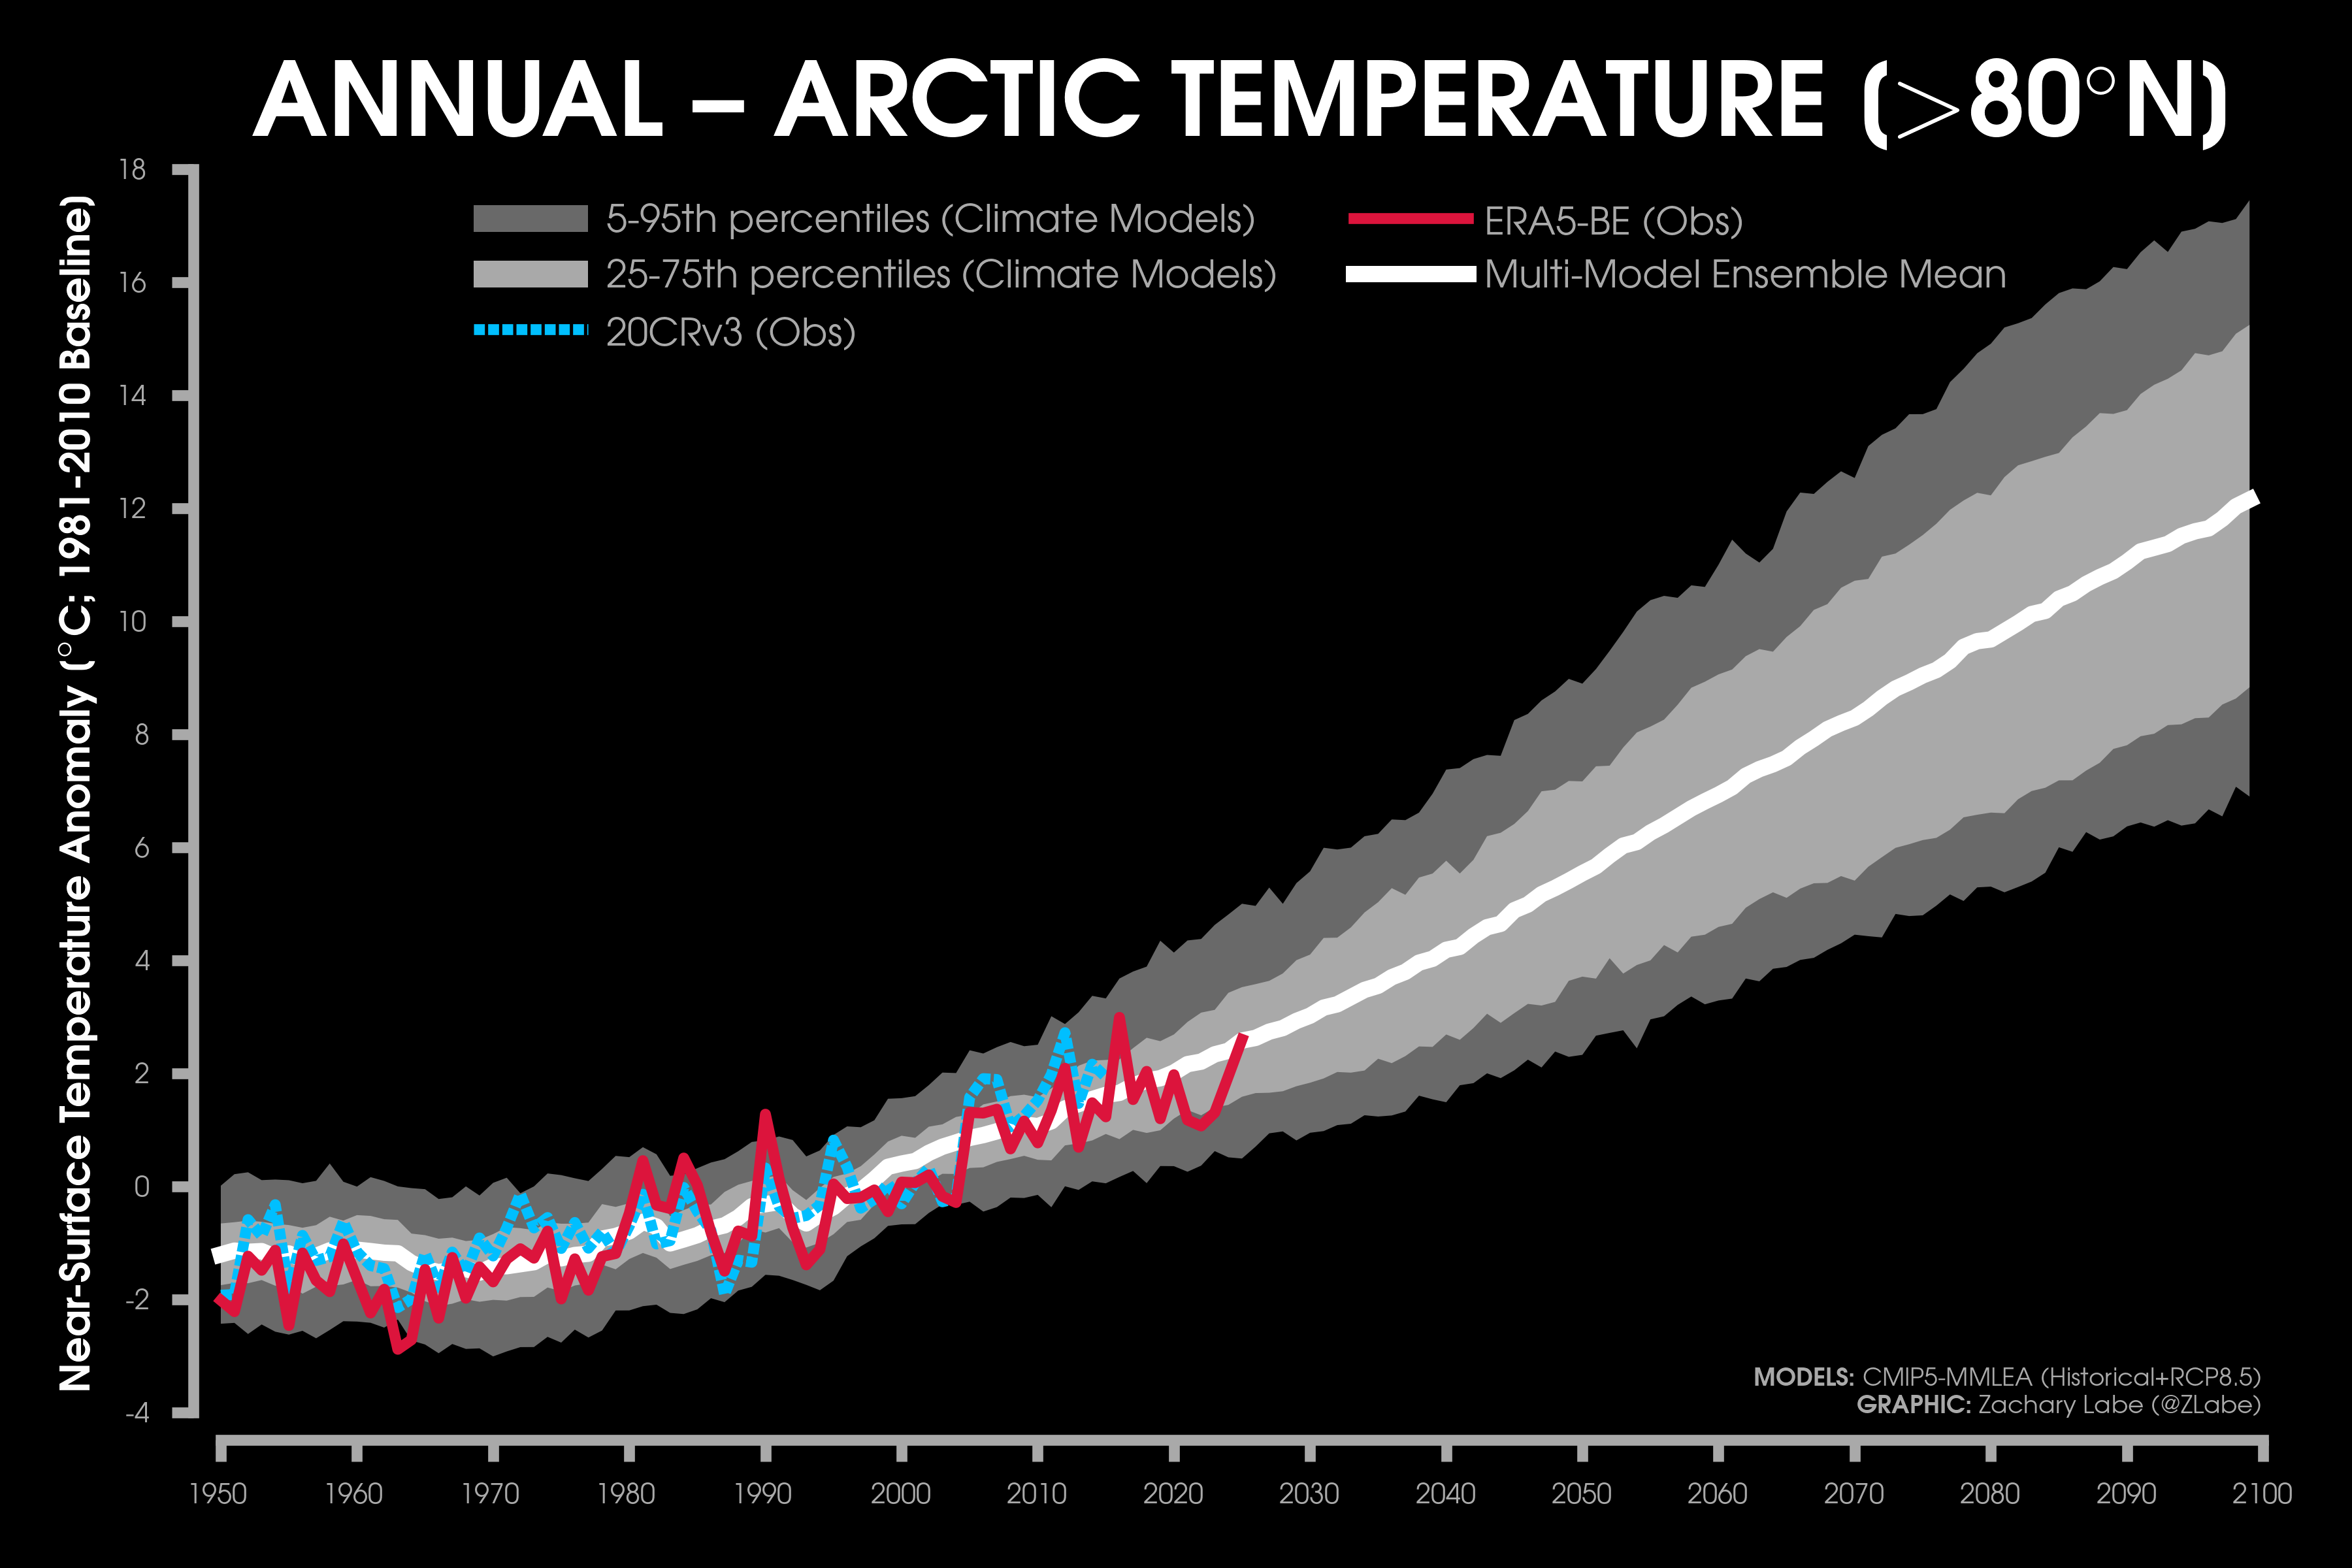
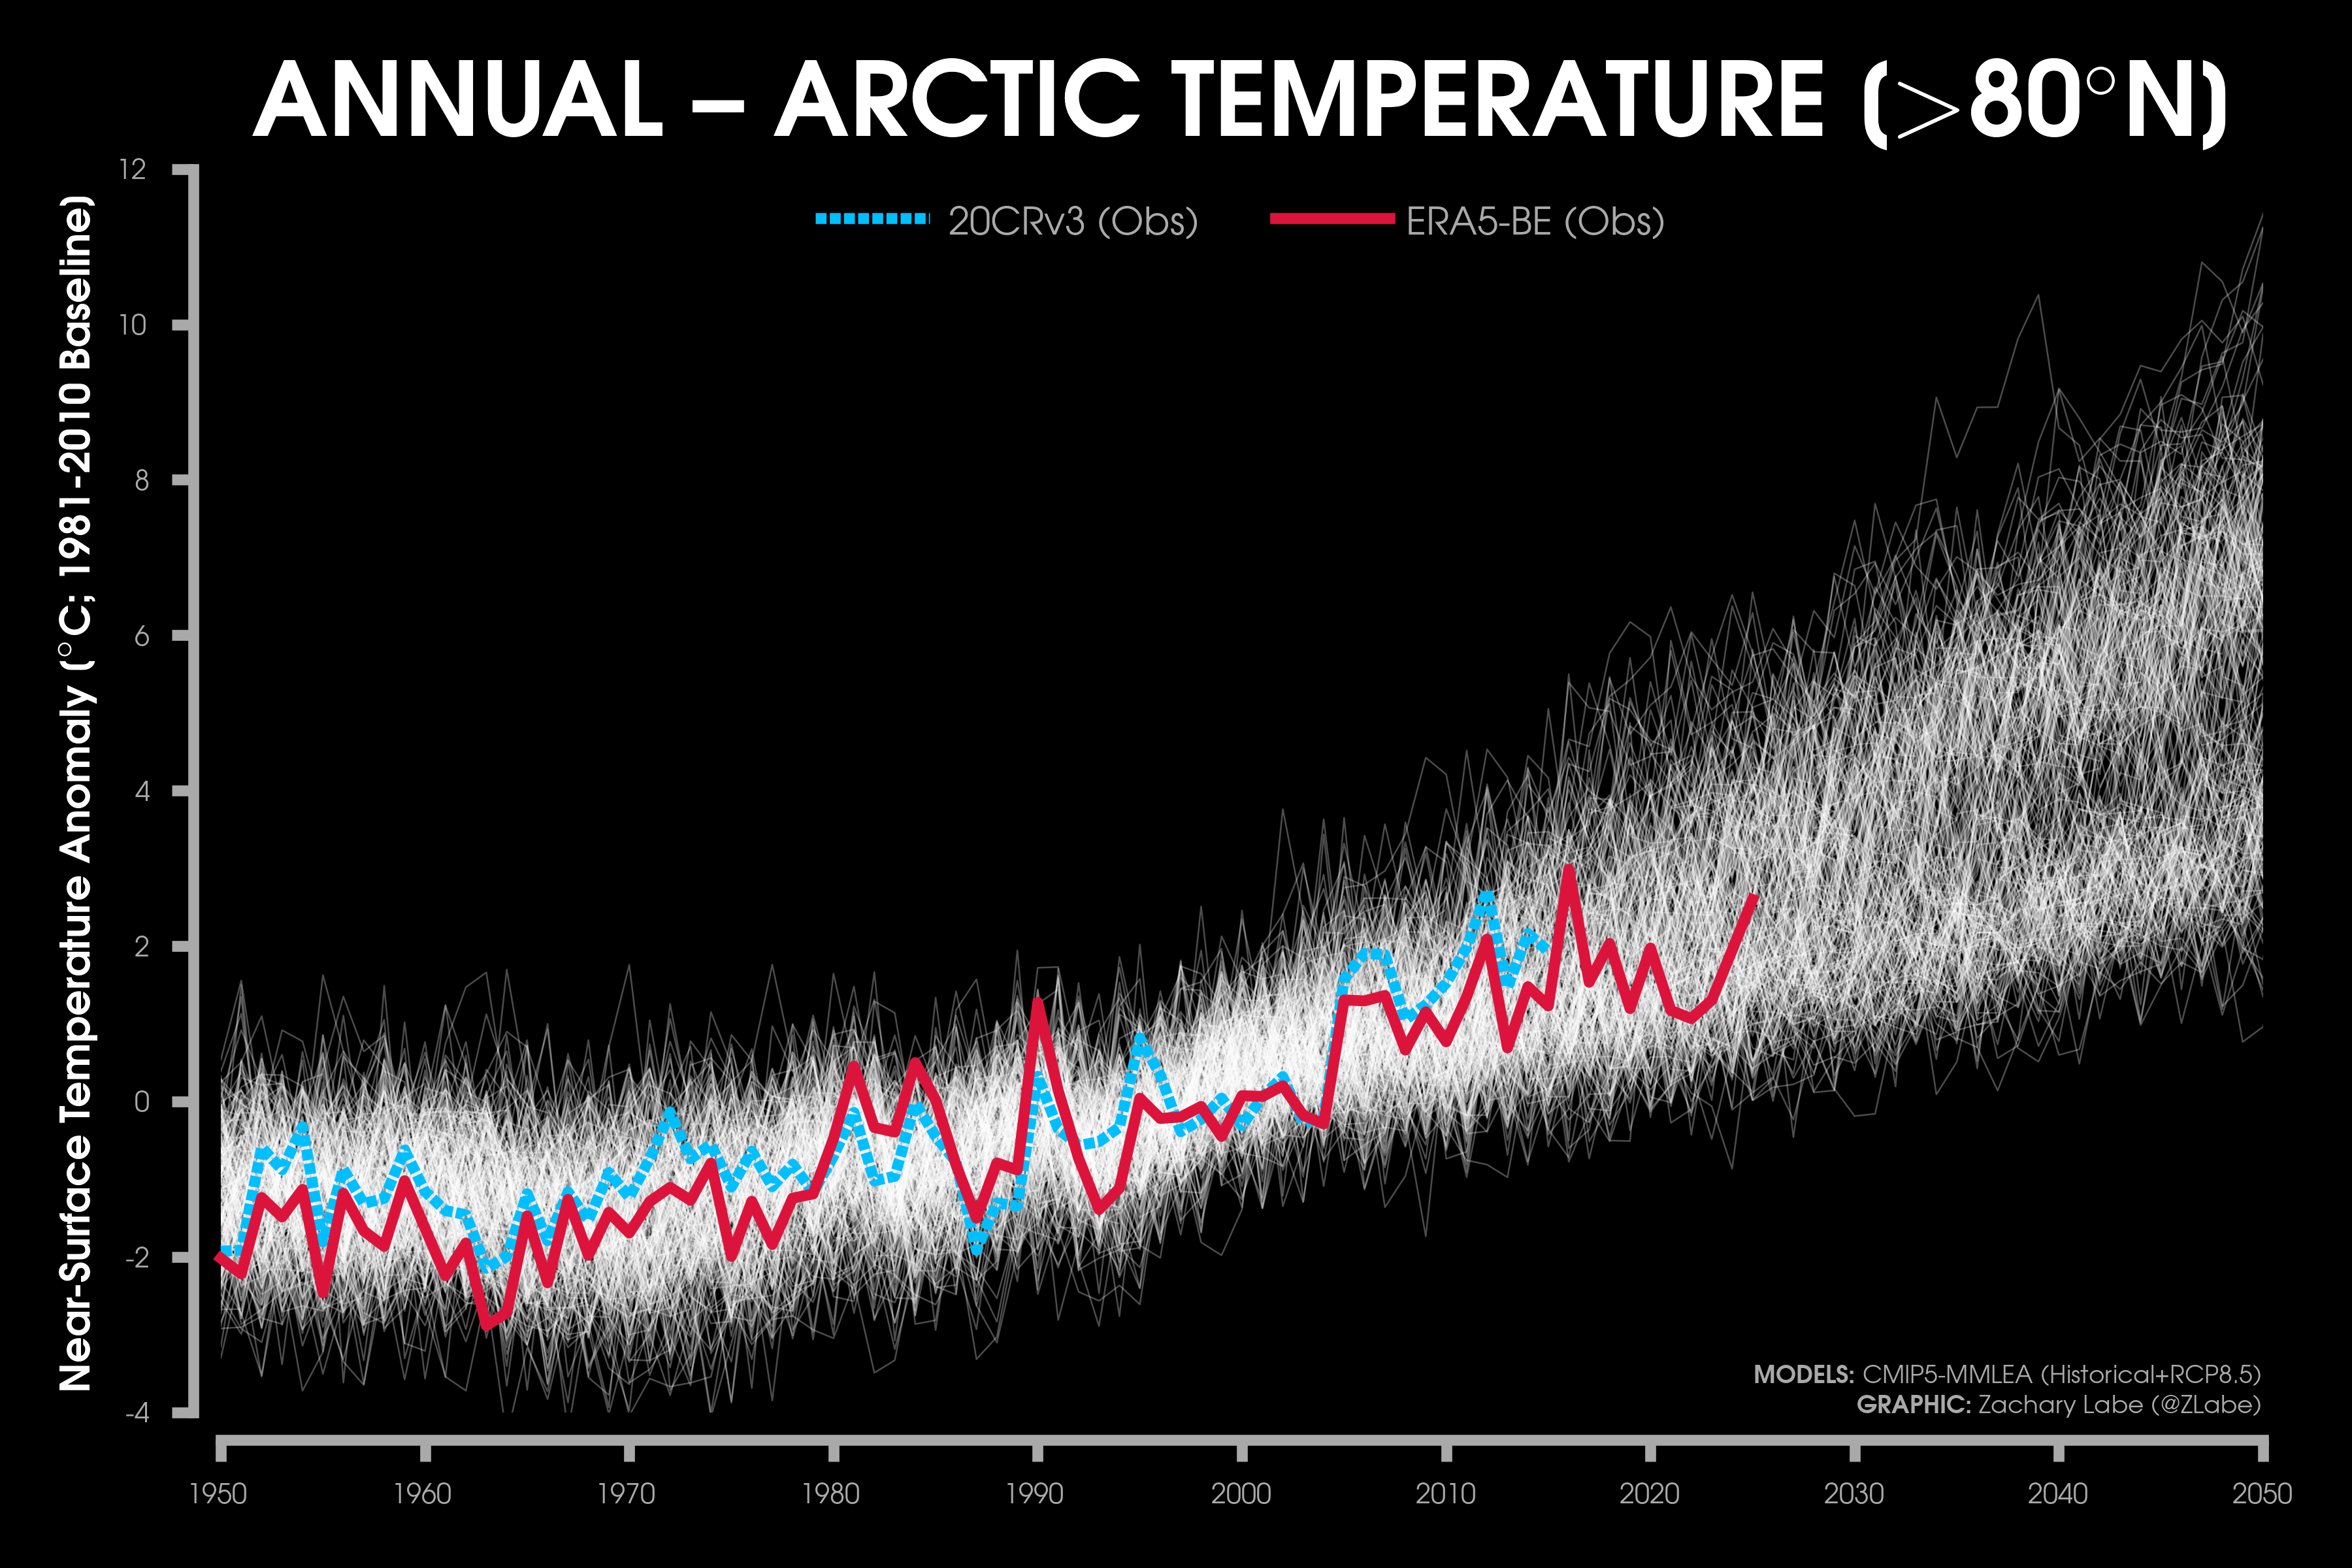
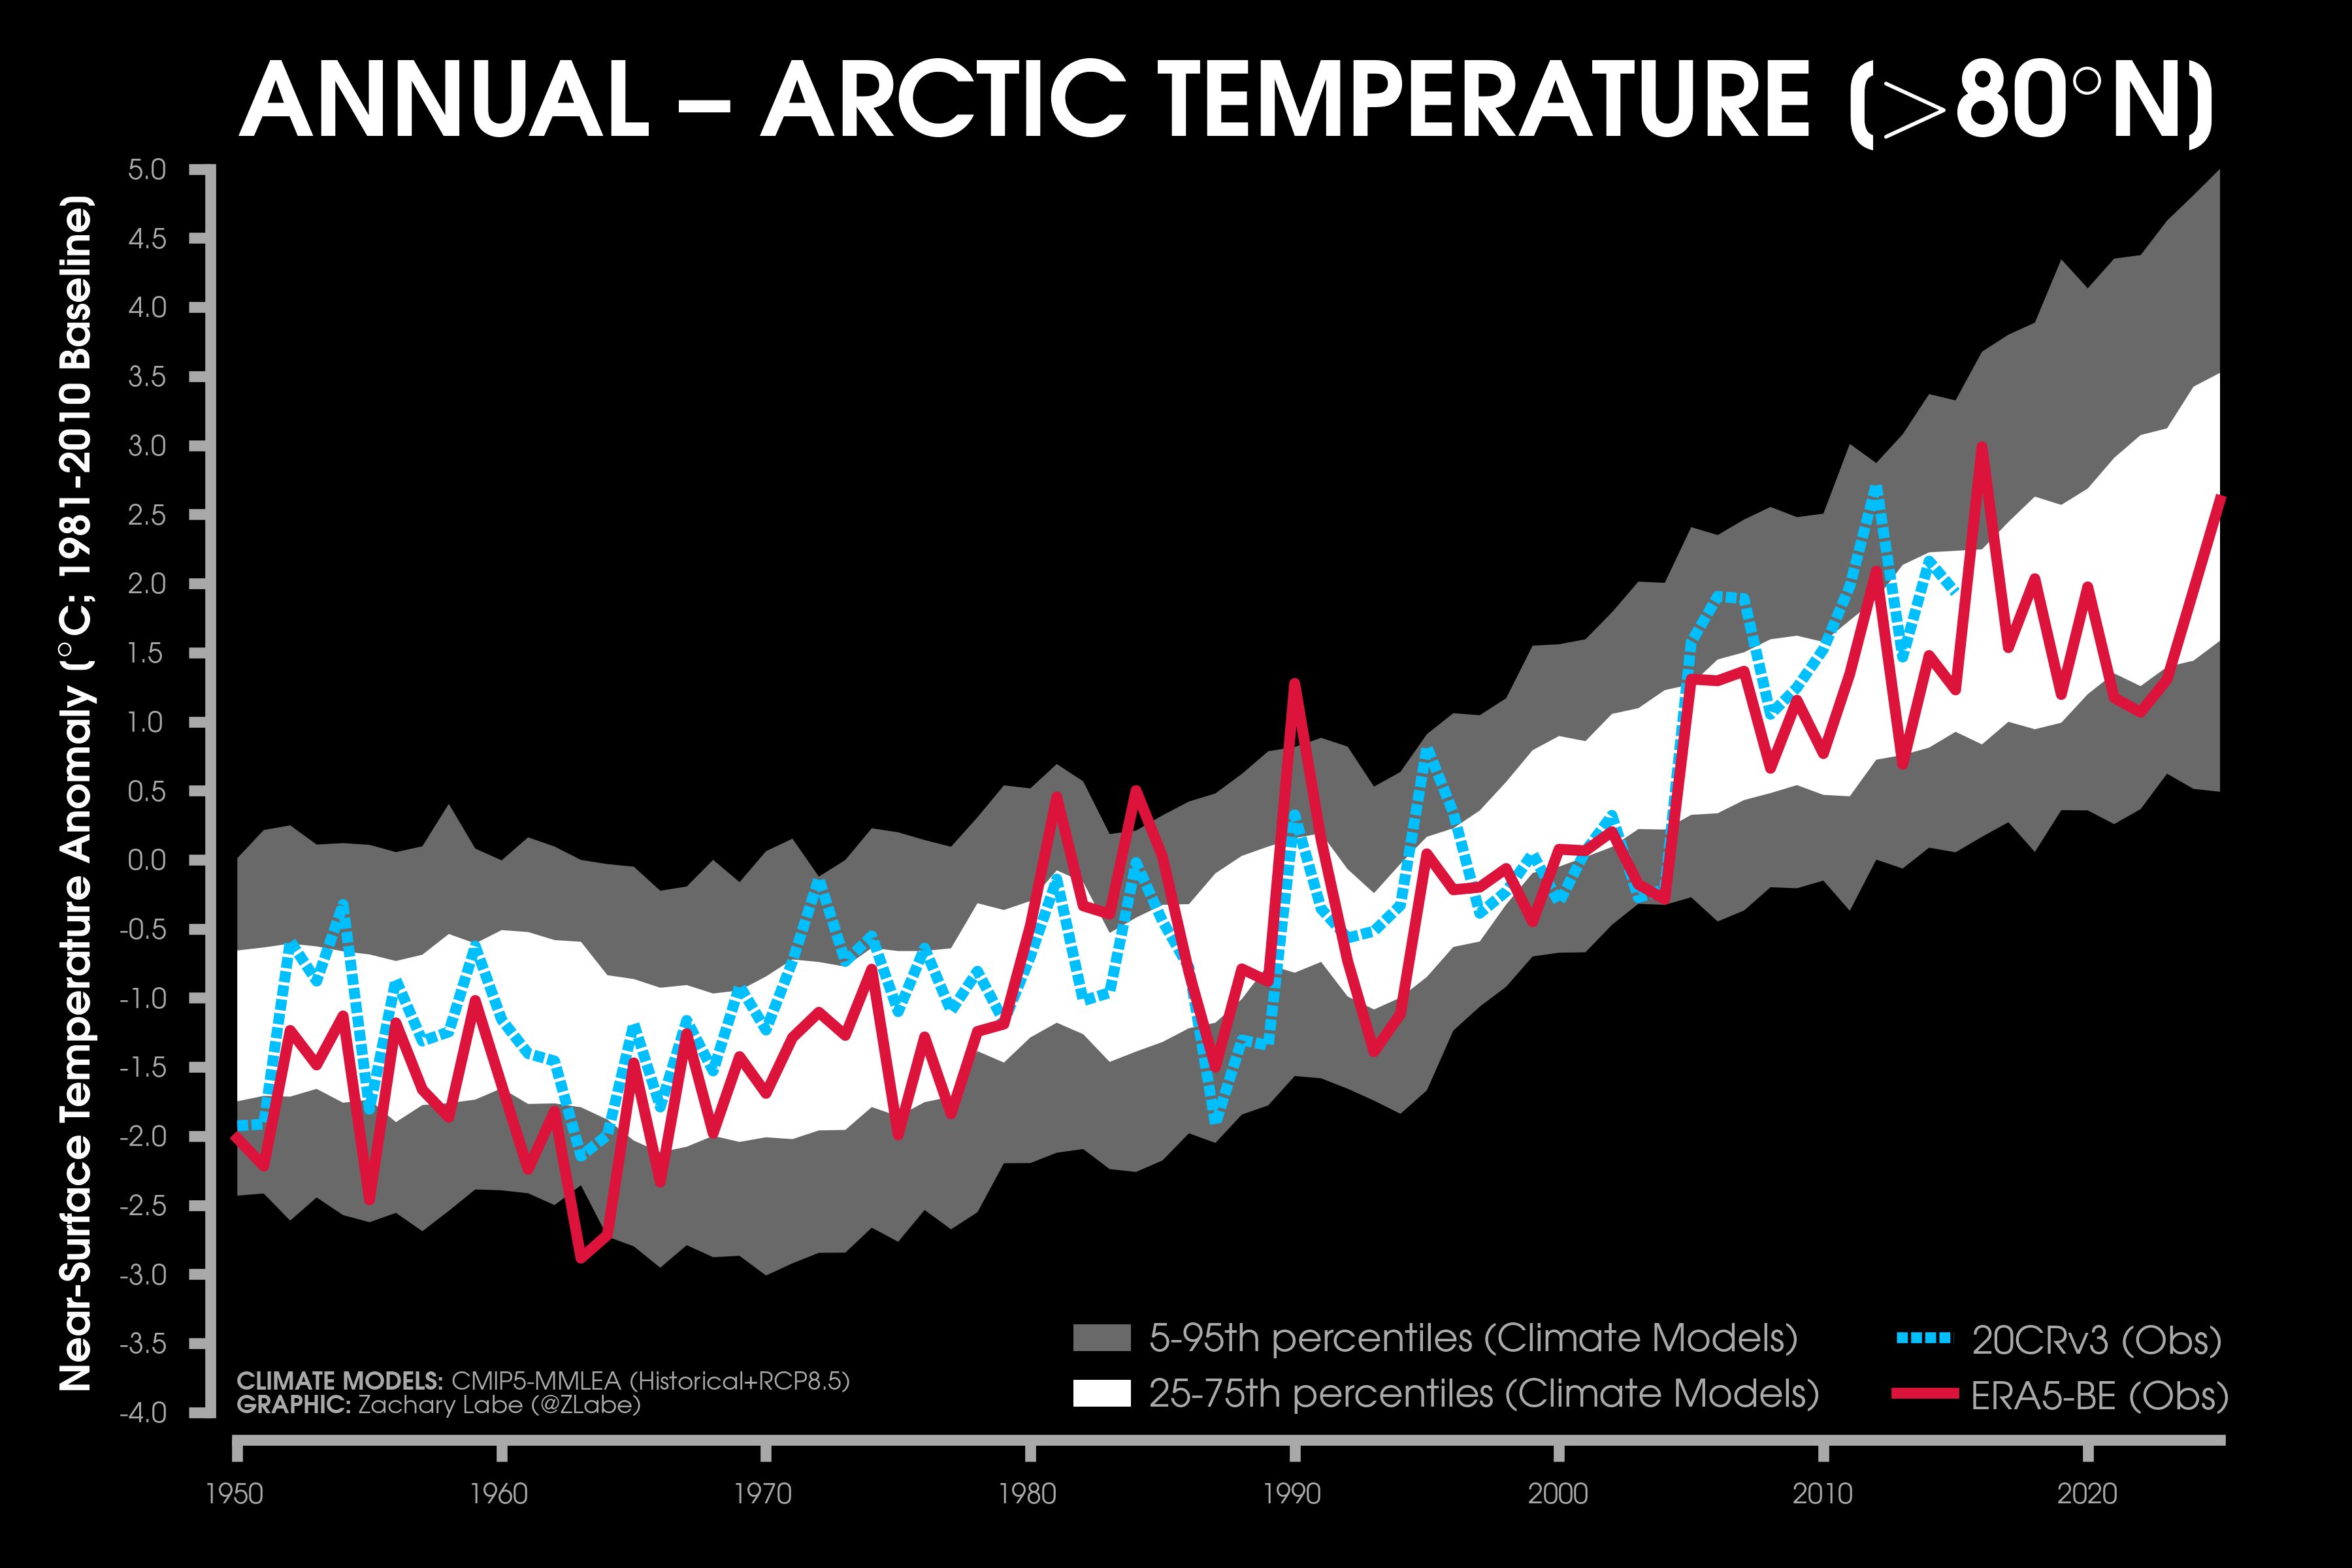
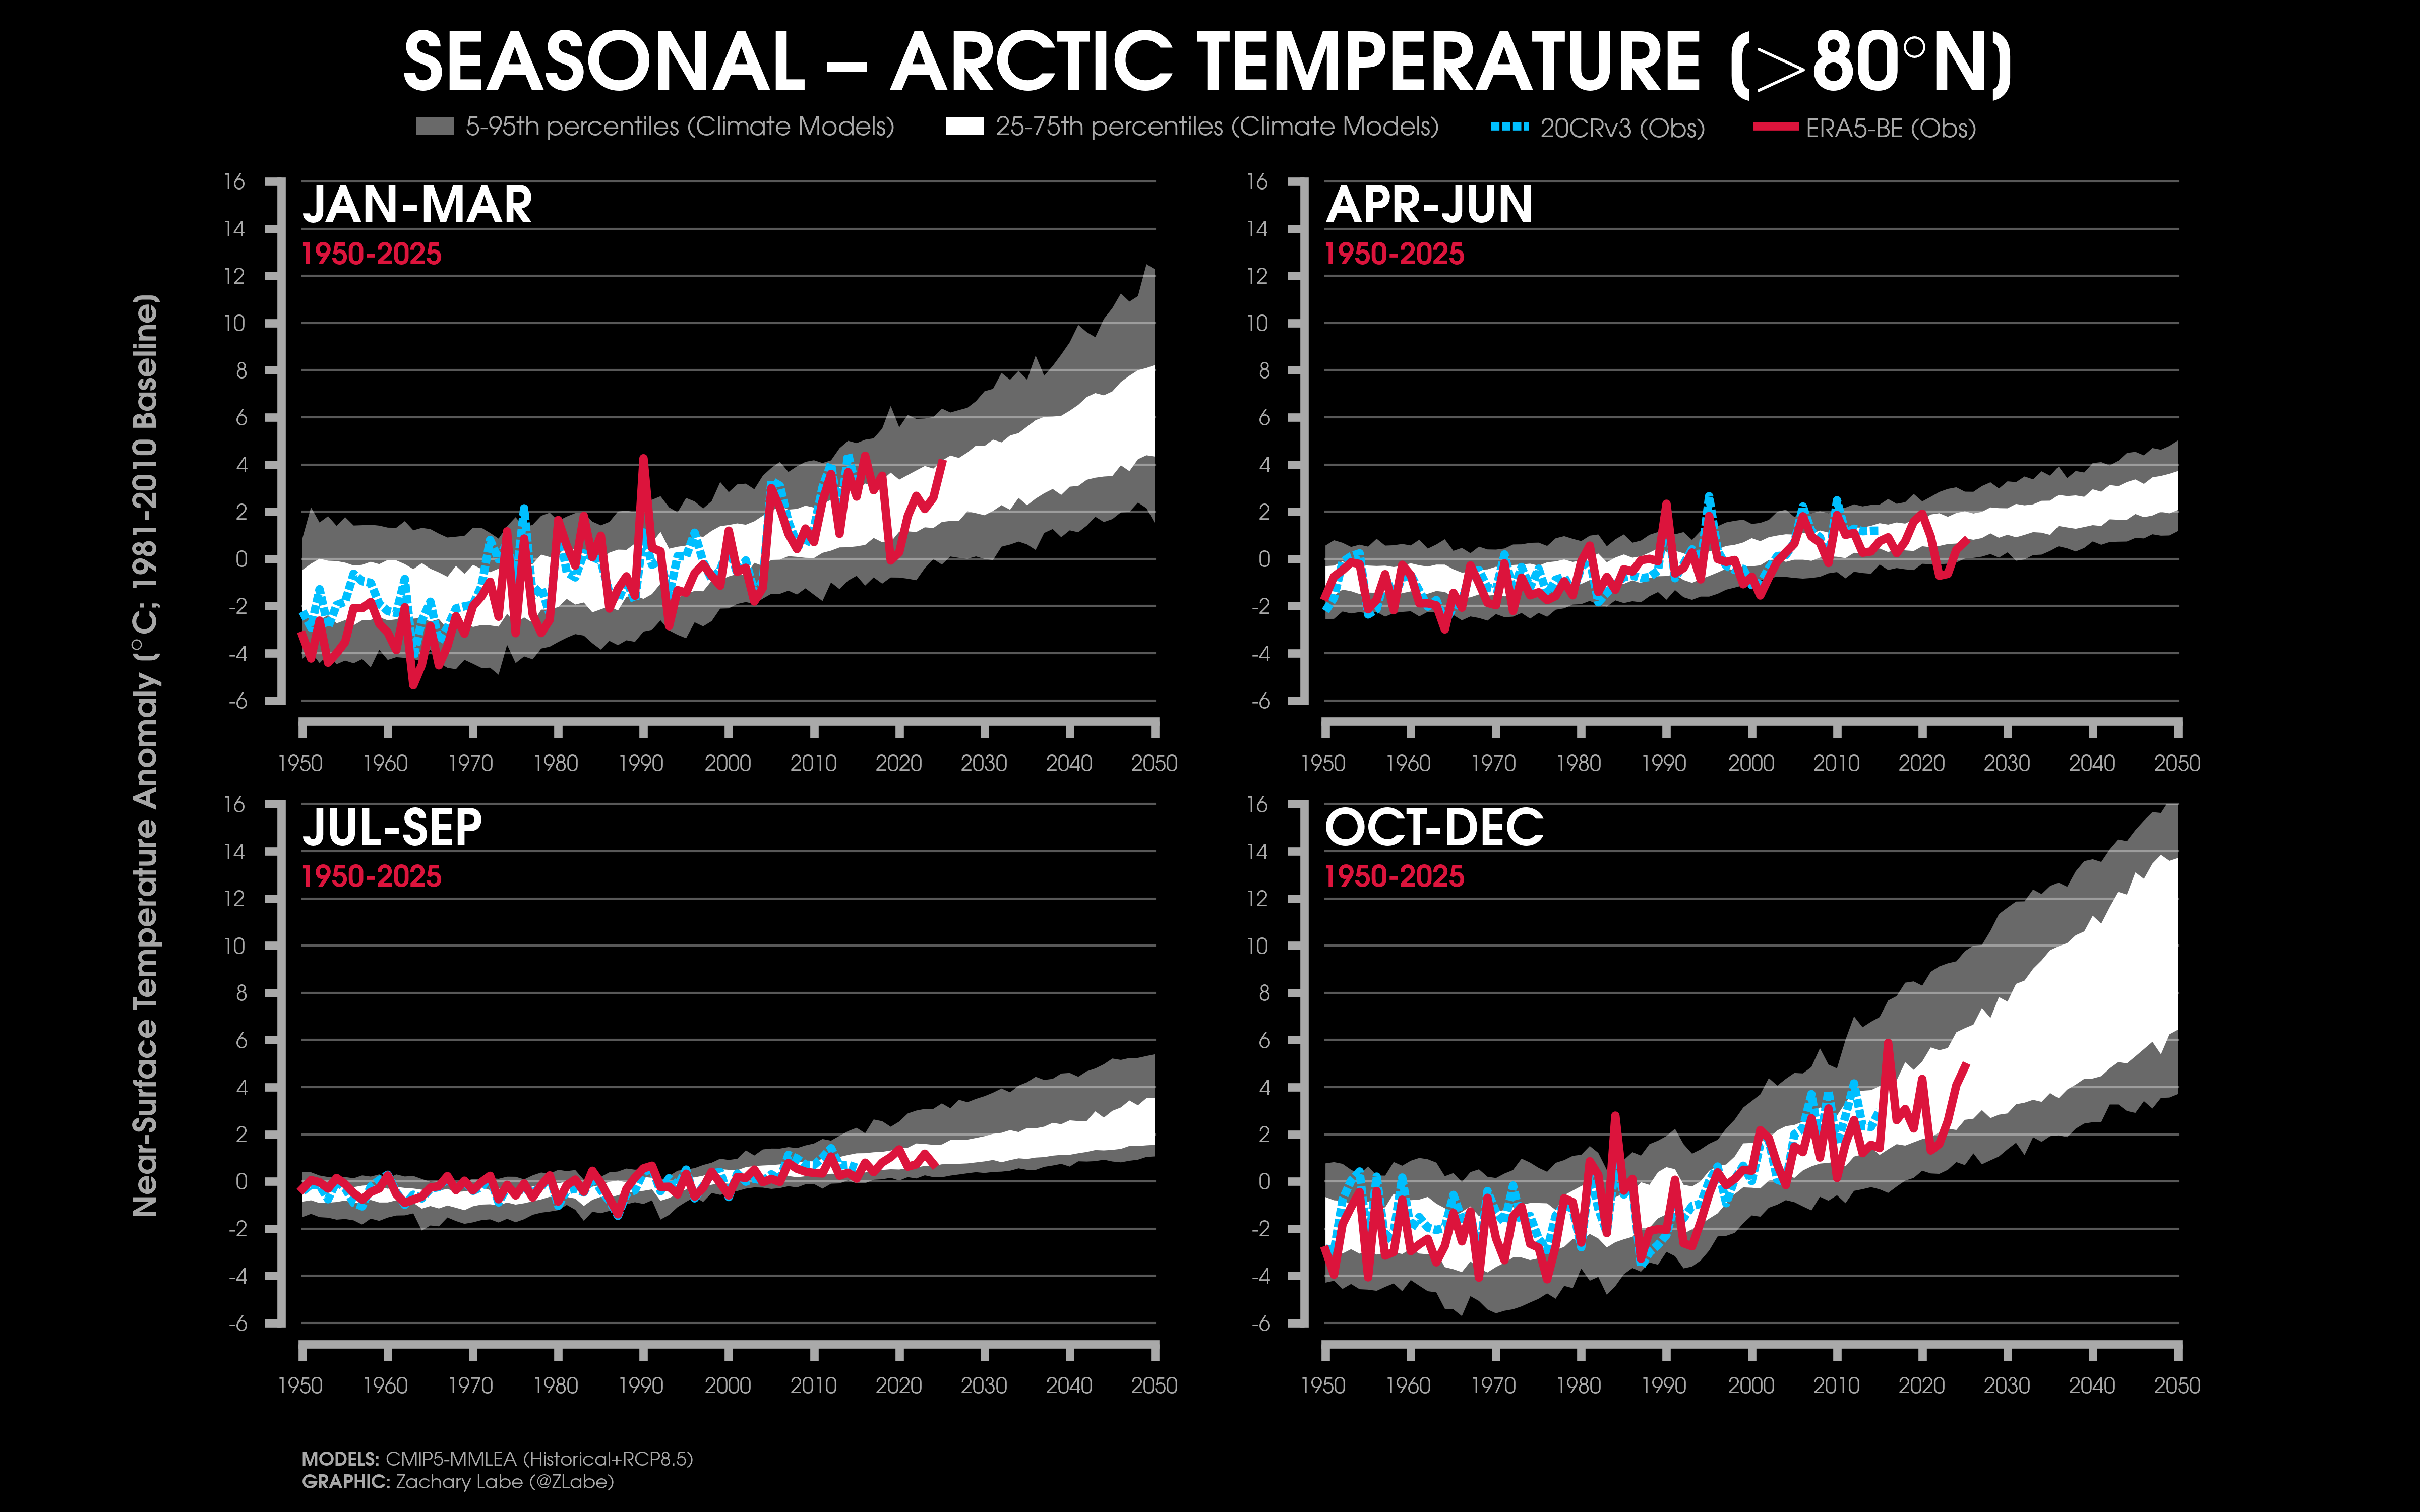
High Arctic mean temperature projections (poleward of 80°N Latitude):
Annual mean near surface temperatures (2-m height; °C) anomalies averaged over the Arctic (north of 80°N latitude) from 1950 to 2025 using observations from the European Centre for Medium-Range Weather Forecasts ERA5 (solid red line) and the National Oceanic and Atmospheric Administration/Cooperative Institute for Research in Environmental Sciences/Department of Energy Twentieth Century Reanalysis (20CR) version 3 (20CRv3; dashed blue line). Note that 20CRv3 is only available from 1950 to 2015. Dark gray shading shows the 5th-95th percentiles of T2M anomalies in the Arctic across 7 global climate model large ensembles from the entire multi-model large ensemble archive (MMLEA) through 2099. Light gray shading shows the 25th-75th percentiles of T2M anomalies in the Arctic across the entire MMLEA through 2099. The white line denotes the multi-model ensemble mean. All climate models are forced with CMIP5 historical forcing from 1950 to 2005 and an extreme high emissions scenario (RCP8.5) from 2006 to 2099. These climate models include: Canadian Earth System Model Large Ensemble (CanESM2; 50 ensemble members), Max Planck Institute Grand Ensemble (MPI; 50 ensemble members), Commonwealth Scientific and Industrial Research Organization Large Ensemble (CSIRO-MK3.6; 30 ensemble members), EC-Earth Consortium Large Ensemble (EC-Earth; 16 ensemble members), Geophysical Fluid Dynamics Laboratory Large Ensemble (GFDL-CM3; 20 ensemble members), Geophysical Fluid Dynamics Laboratory Earth System Model Large Ensemble (GFDL ESM2M; 30 ensemble members), and the Community Earth System Model Large Ensemble Community Project (LENS; 40 ensemble members). All anomalies are computed in respect to their 1981 to 2010 climatology.Same data as above, but only for 1950 to 2050 north of 80°N latitude. Each climate model ensemble member is shown with a thin white line.Same data as above, but for north of 80°N latitude.Same data as above, but calculated for each season (January to March, April to June, July to September, and October to December) from 1950 to 2050 and only north of 80°N latitude.
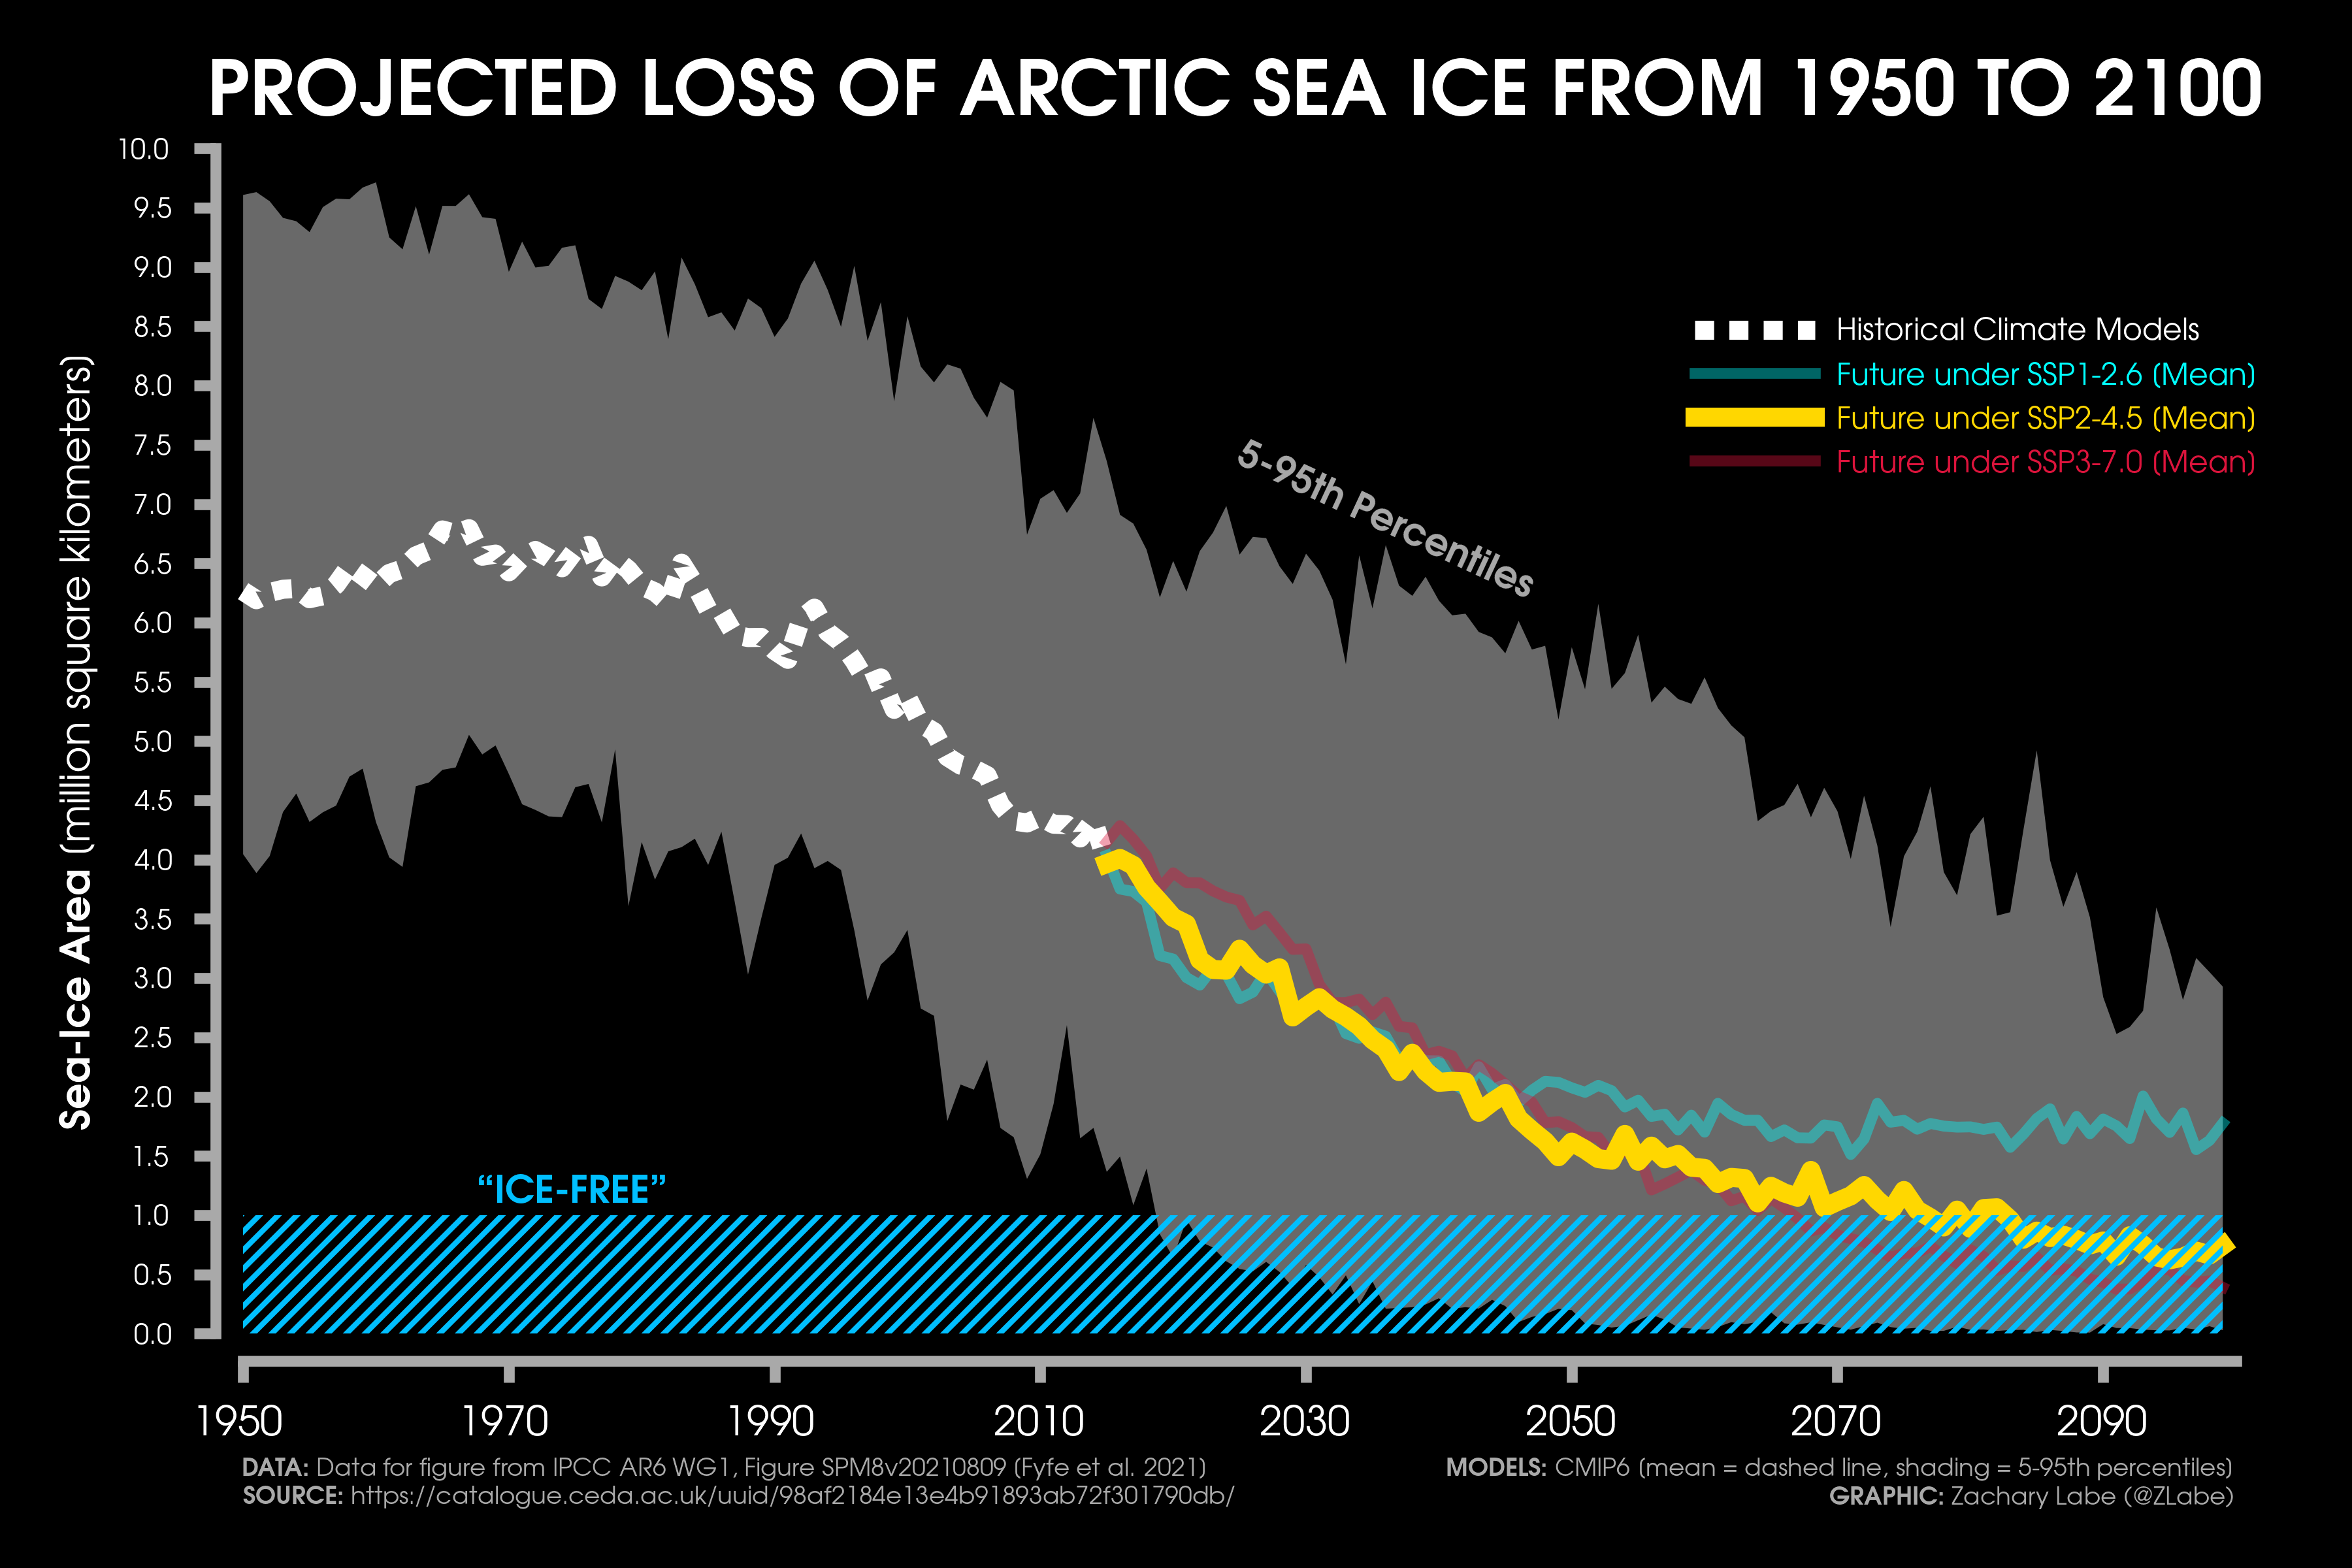
Arctic sea ice projections:
Projections of summertime Arctic sea ice concentration through 2080. This graphic is showing 40 possible future realizations (ensemble members – yellow number) from the CESM1 Large Ensemble (RCP8.5 scenario). In other words, while all 40 ensemble members show a declining trend in Arctic sea ice, there are different interannual to decadal trajectories due to internal variability in the climate system.Projection of summertime Arctic sea ice concentration through 2100. This graphic is showing the ensemble mean (forced response) from the CESM1 Large Ensemble (RCP8.5 scenario). In other words, this is the climate change signal only in one climate model. In reality, internal variability will contribute to either a slower or more rapid rate of future sea ice decline.Simulated historical and future Arctic sea-ice area during the month of September from the CMIP6 global climate model archive. Three emission scenarios are shown for the future period (2015-2100), including SSP1-2.6 (blue line), SSP2-4.5 (yellow line), and SSP3-7.0 (red line). Multi-model means are shown with the lines, and the shading represents the 5-95th percentiles of all the model projections. Data to create this graph are provided by the Summary for Policymakers of the Working Group I Contribution to the IPCC Sixth Assessment Report in Figure SPM.8 (https://catalogue.ceda.ac.uk/uuid/98af2184e13e4b91893ab72f301790db/). Visualization created on 28 June 2025. [Click directly on the image to download or enlarge]
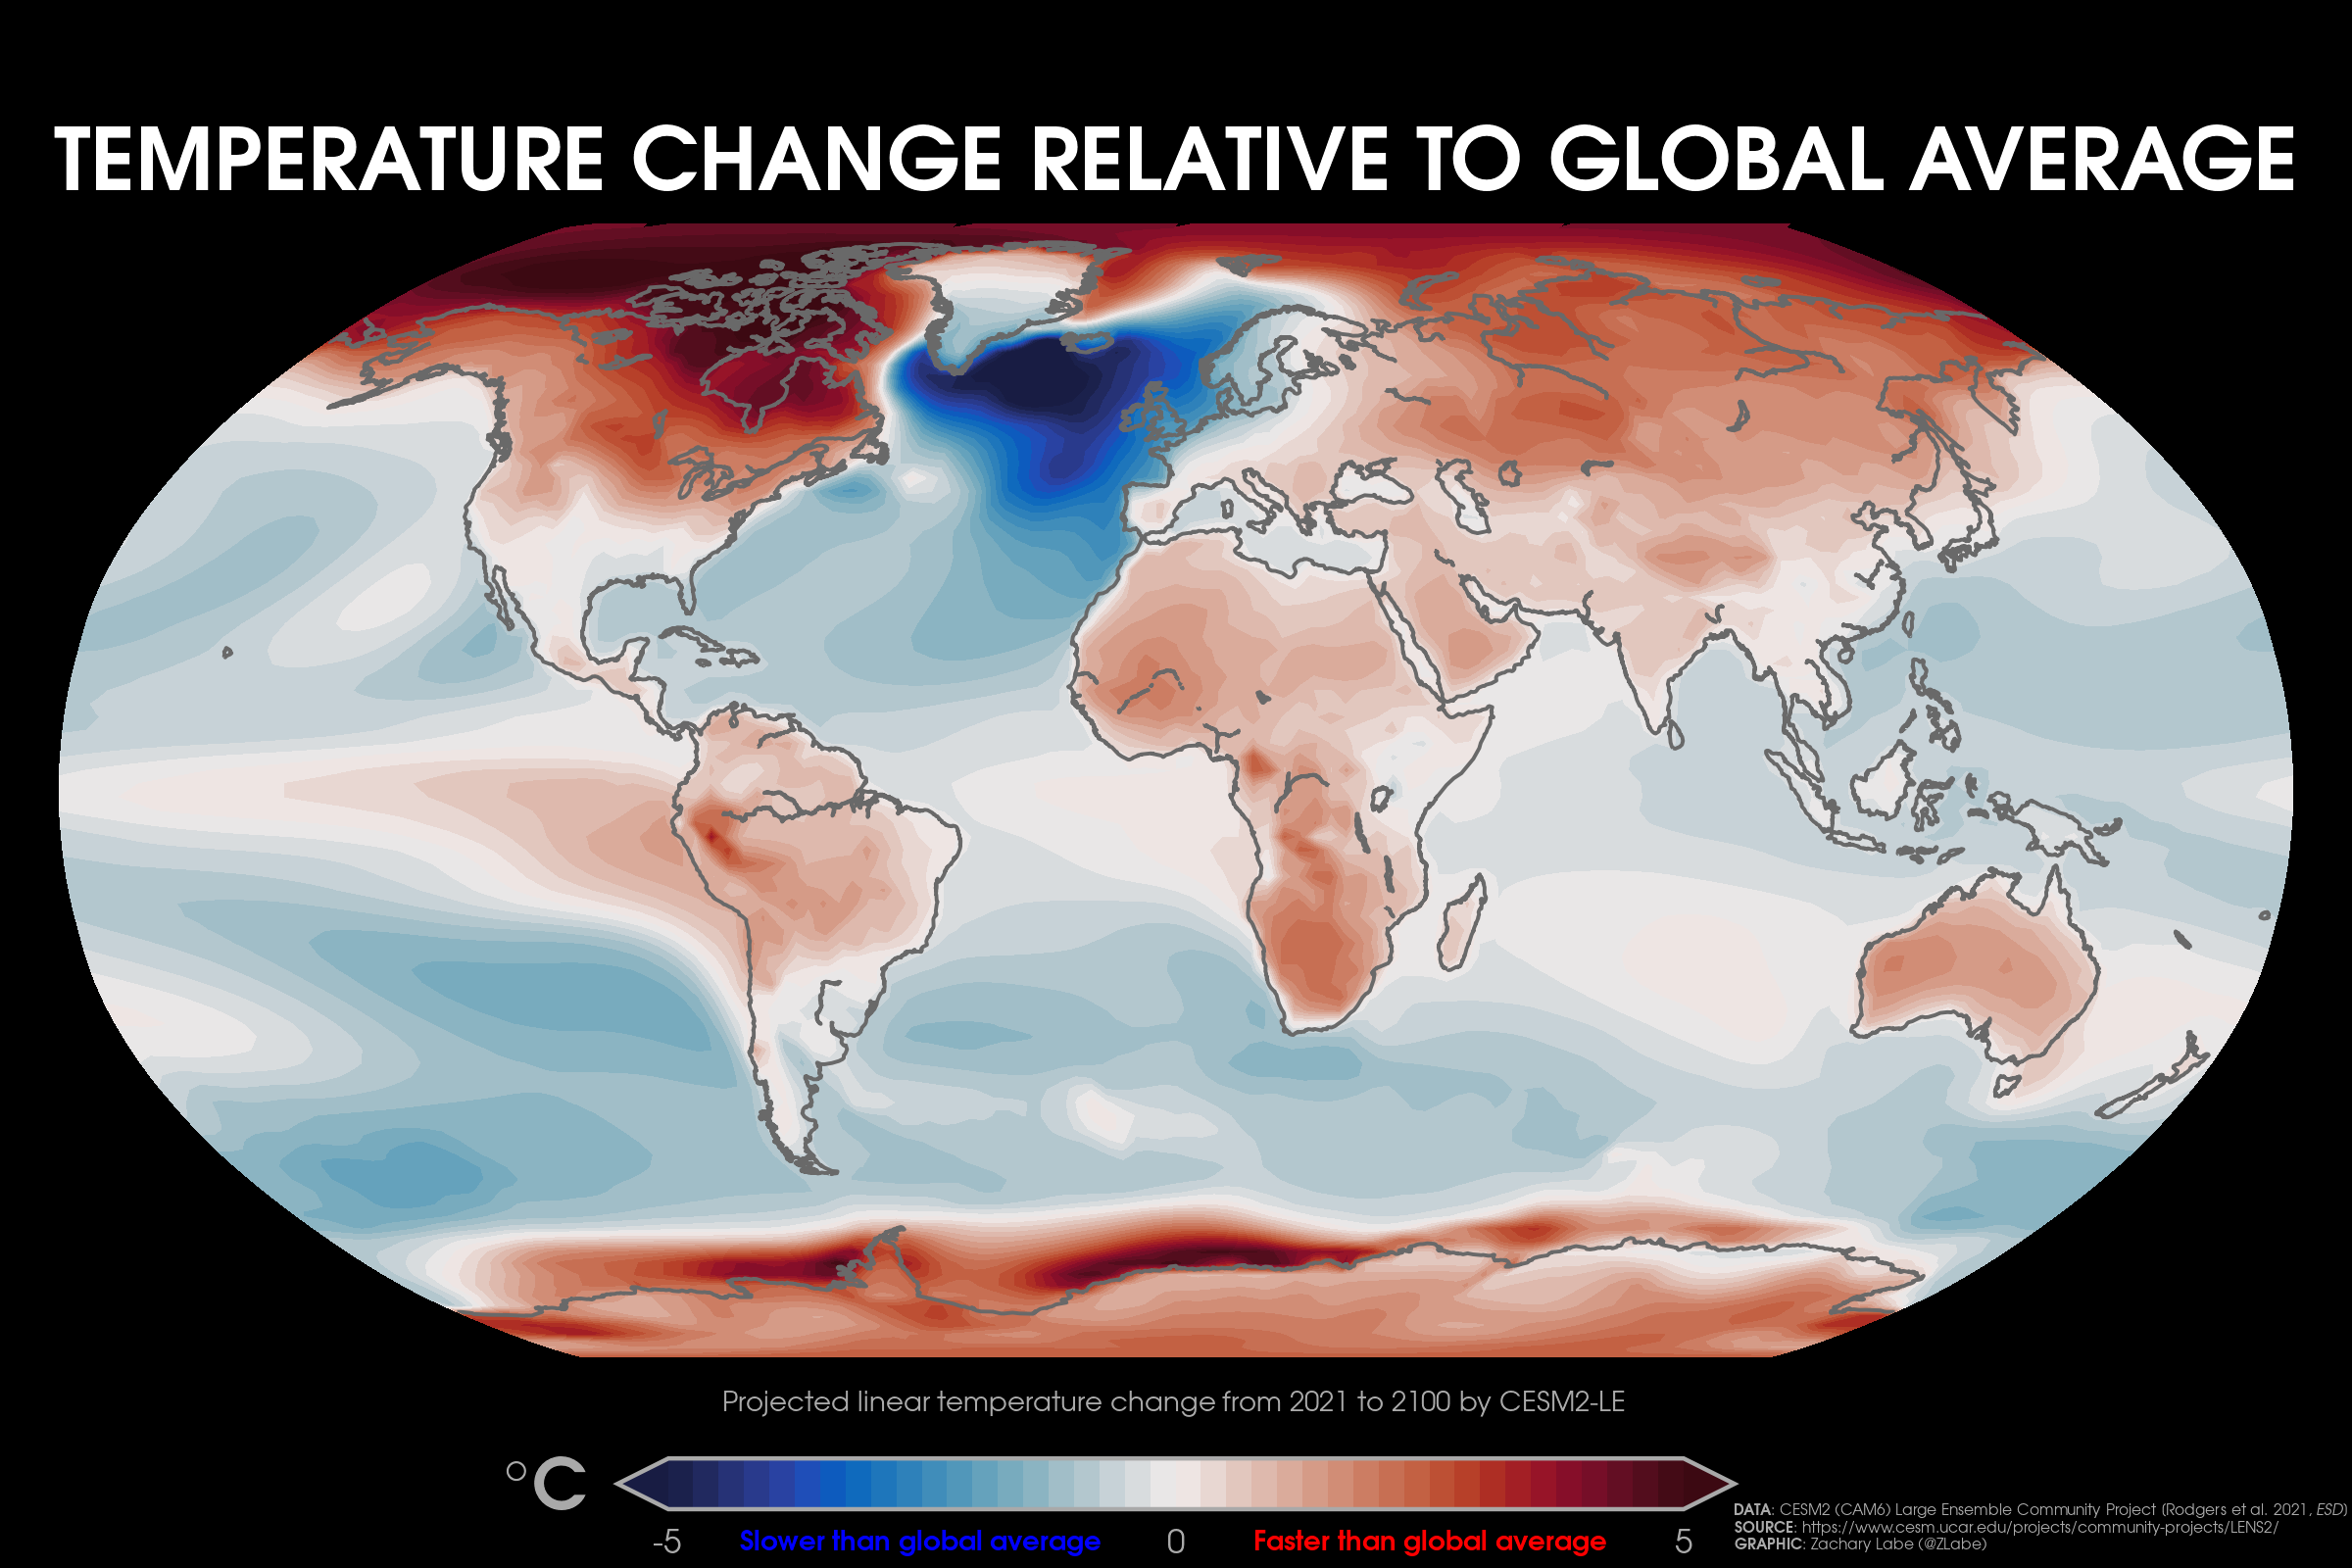
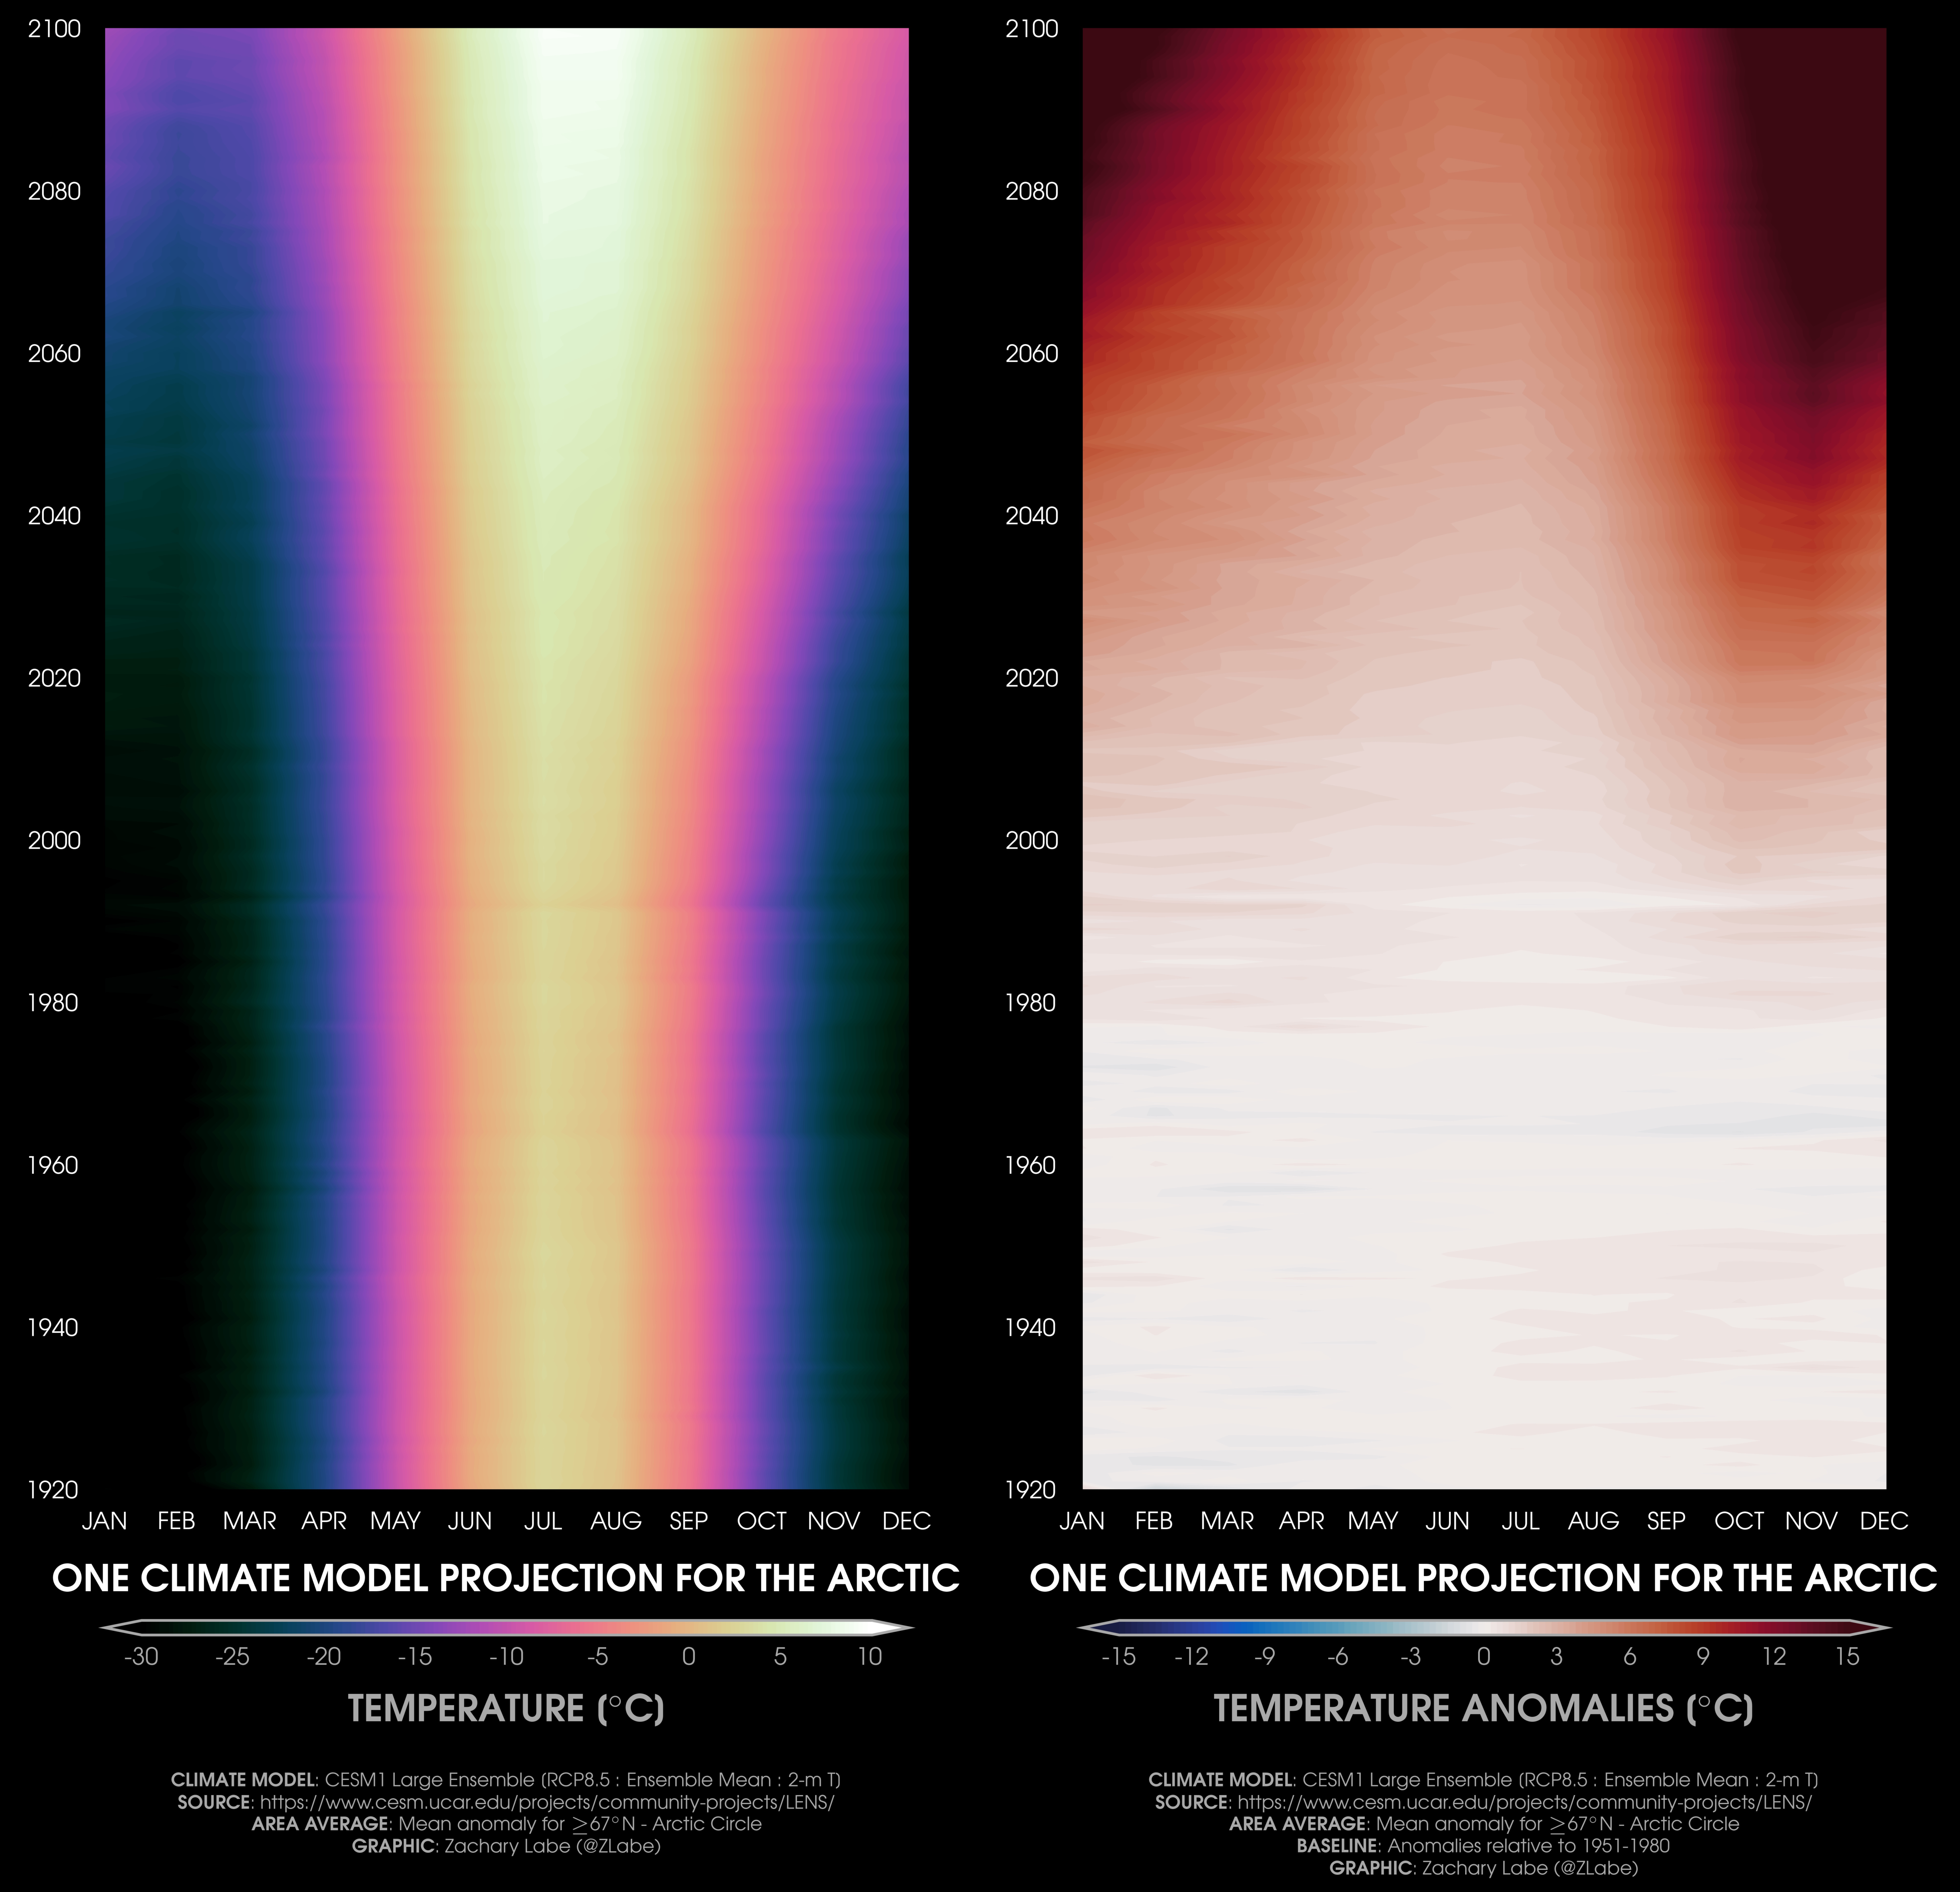
Arctic amplification projections:
One climate model projection of mean October-November near-surface air temperature anomalies from 2001 to 2100. Boreal fall corresponds to the largest Arctic amplification. Anomalies are computed relative to a 1951-1980 baseline. The animation is using the ensemble mean (forced response) from the CESM2 Large Ensemble (SSP3-7.0 scenario).Visualization showing where areas are projected to warm more (red) or less (blue)than the global average mean temperature change, which is calculated from a linear trend from 2021-2100 using the CESM2 Large Ensemble (SSP3-7.0 scenario).Animation of annual mean near-surface air temperature anomalies for each year from 2015 to 2100 for ensemble member #30 from SPEAR_MED (left) and for the ensemble member from SPEAR_MED (right). Anomalies are calculated in reference to 1951-1980 from the historical simulation of GFDL SPEAR_MED (Delworth et al. 2020). The future scenario uses SSP2-4.5 forcing. Visualization created on 17 May 2023. (Note that it may take a few seconds for this animation (GIF) to load on this page (~40MB). You can click on it to enlarge and/or download.)One example of a climate model simulation for monthly Arctic near-surface air temperatures from 1920 to 2100. This graphic is showing the ensemble mean (forced response) from the CESM1 Large Ensemble (RCP8.5 scenario). The left graphic shows the actual temperature, and the right graphic shows the temperature anomalies computed relative to a 1951-1980 baseline.
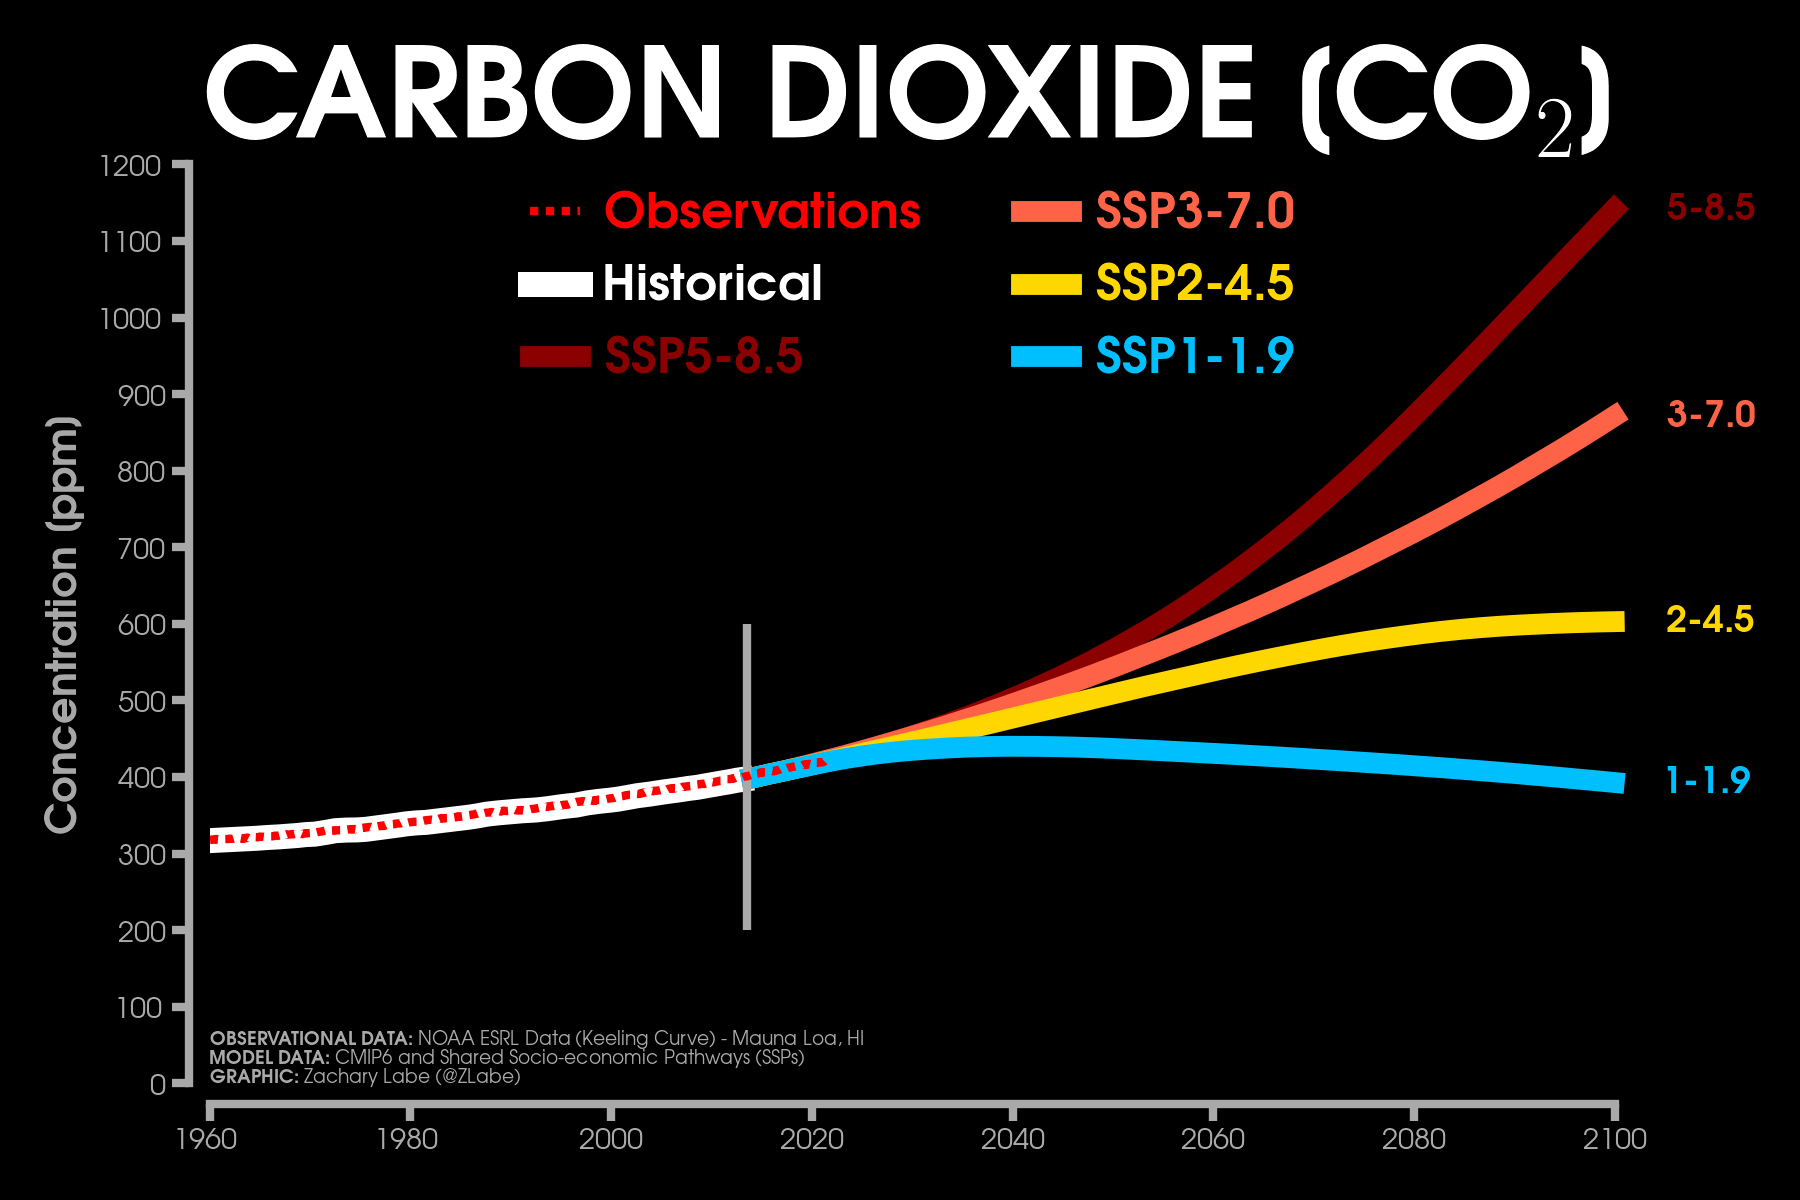
Global projections:
Comparison of annual mean carbon dioxide levels from observations (dashed red line; https://gml.noaa.gov/ccgg/trends/data.html) compared with CMIP6 historical forcing and then a range of future Shared Socioeconomic Pathways (SSPs). The vertical gray line around 2014-2015 indices the transition from historical to SSP forcing, as designated in CMIP6.
Global temperature observations compared with climate models:
[16] Eayrs, C. and Z.M. Labe (2025). The future of sea ice. Comprehensive Cryospheric Science and Environmental Change, DOI:10.1016/B978-0-323-85242-5.00050-6 [HTML][BibTeX]
[15] Timmermans, M.-L. and Z.M. Labe (2024). Sea surface temperature [in “Arctic Report Card 2024”], NOAA, DOI:10.25923/9z96-aq19 [HTML][BibTeX][Code] [Press Release]
[14] Vanek S.B., Z.M. Labe, O. Lauter, K. Shionalyn, M.A. Shadab, E. Adasheva, A. Margevich, M.N. Schaberg, L. Ashokkumar, and J.N. Naoukin (2024). Exploring the past, present, and future of USAPECS: Lessons from a decade of supporting early career research across national and international polar networks. Arctic Yearbook, ISSN 2298-2418 [HTML][BibTeX][PDF]<
[13]Labe, Z.M., T.L. Delworth, N.C. Johnson, and W.F. Cooke (2024). Exploring a data-driven approach to identify regions of change associated with future climate scenarios. Journal of Geophysical Research: Machine Learning and Computation, DOI:10.1029/2024JH000327 [HTML][BibTeX][Code] Plain Language Summary
[12] Timmermans, M.-L. and Z.M. Labe (2024). [The Arctic] Sea surface temperature [in “State of the Climate in 2023”]. Bull. Amer. Meteor. Soc., DOI:10.1175/BAMS-D-24-0101.1 [HTML][BibTeX][Code] [Press Release]
[10] Timmermans, M.-L. and Z.M. Labe (2022). Sea surface temperature [in “Arctic Report Card 2022”], NOAA, DOI:10.25923/p493-2548 [HTML][BibTeX][Code] [Press Release]
[9] Timmermans, M.-L. and Z.M. Labe (2022). [The Arctic] Sea surface temperature [in “State of the Climate in 2021”]. Bull. Amer. Meteor. Soc., DOI:10.1175/BAMS-D-22-0082.1 [HTML][BibTeX][Code] [Press Release]
[8]Labe, Z.M. and E.A. Barnes (2022), Comparison of climate model large ensembles with observations in the Arctic using simple neural networks. Earth and Space Science, DOI:10.1029/2022EA002348 [HTML][BibTeX][Code] [Plain Language Summary]
[7] Timmermans, M.-L. and Z.M. Labe (2021). Sea surface temperature [in “Arctic Report Card 2021”], NOAA, DOI:10.25923/2y8r-0e49 [HTML][BibTeX][Code] [Press Release]
[6] Timmermans, M.-L. and Z.M. Labe (2021). [The Arctic] Sea surface temperature [in “State of the Climate in 2020”]. Bull. Amer. Meteor. Soc., DOI:10.1175/BAMS-D-21-0086.1 [HTML][BibTeX][Code] [Press Release]
[4] Timmermans, M.-L. and Z.M. Labe (2020). Sea surface temperature [in “Arctic Report Card 2020”], NOAA, DOI:10.25923/v0fs-m920 [HTML][BibTeX][Code] [Press Release]
[3] Timmermans, M.-L., Z.M. Labe, and C. Ladd (2020). [The Arctic] Sea surface temperature [in “State of the Climate in 2019”], Bull. Amer. Meteor. Soc., DOI:10.1175/BAMS-D-20-0086.1 [HTML][BibTeX][Code] [Press Release]
[2] Thoman, R.L., U. Bhatt, P. Bieniek, B. Brettschneider, M. Brubaker, S. Danielson, Z.M. Labe, R. Lader, W. Meier, G. Sheffield, and J. Walsh (2019): The record low Bering Sea ice extent in 2018: Context, impacts and an assessment of the role of anthropogenic climate change [in “Explaining Extreme Events of 2018 from a Climate Perspective”]. Bull. Amer. Meteor. Soc, DOI:10.1175/BAMS-D-19-0175.1 [HTML][BibTeX][Code] [Press Release]
[1]Labe, Z.M., G. Magnusdottir, and H.S. Stern (2018), Variability of Arctic sea ice thickness using PIOMAS and the CESM Large Ensemble, Journal of Climate, DOI:10.1175/JCLI-D-17-0436.1 [HTML][BibTeX] [Plain Language Summary]
The views presented here only reflect my own. These figures may be freely distributed (with credit). Information about the data can be found on my references page and methods page.