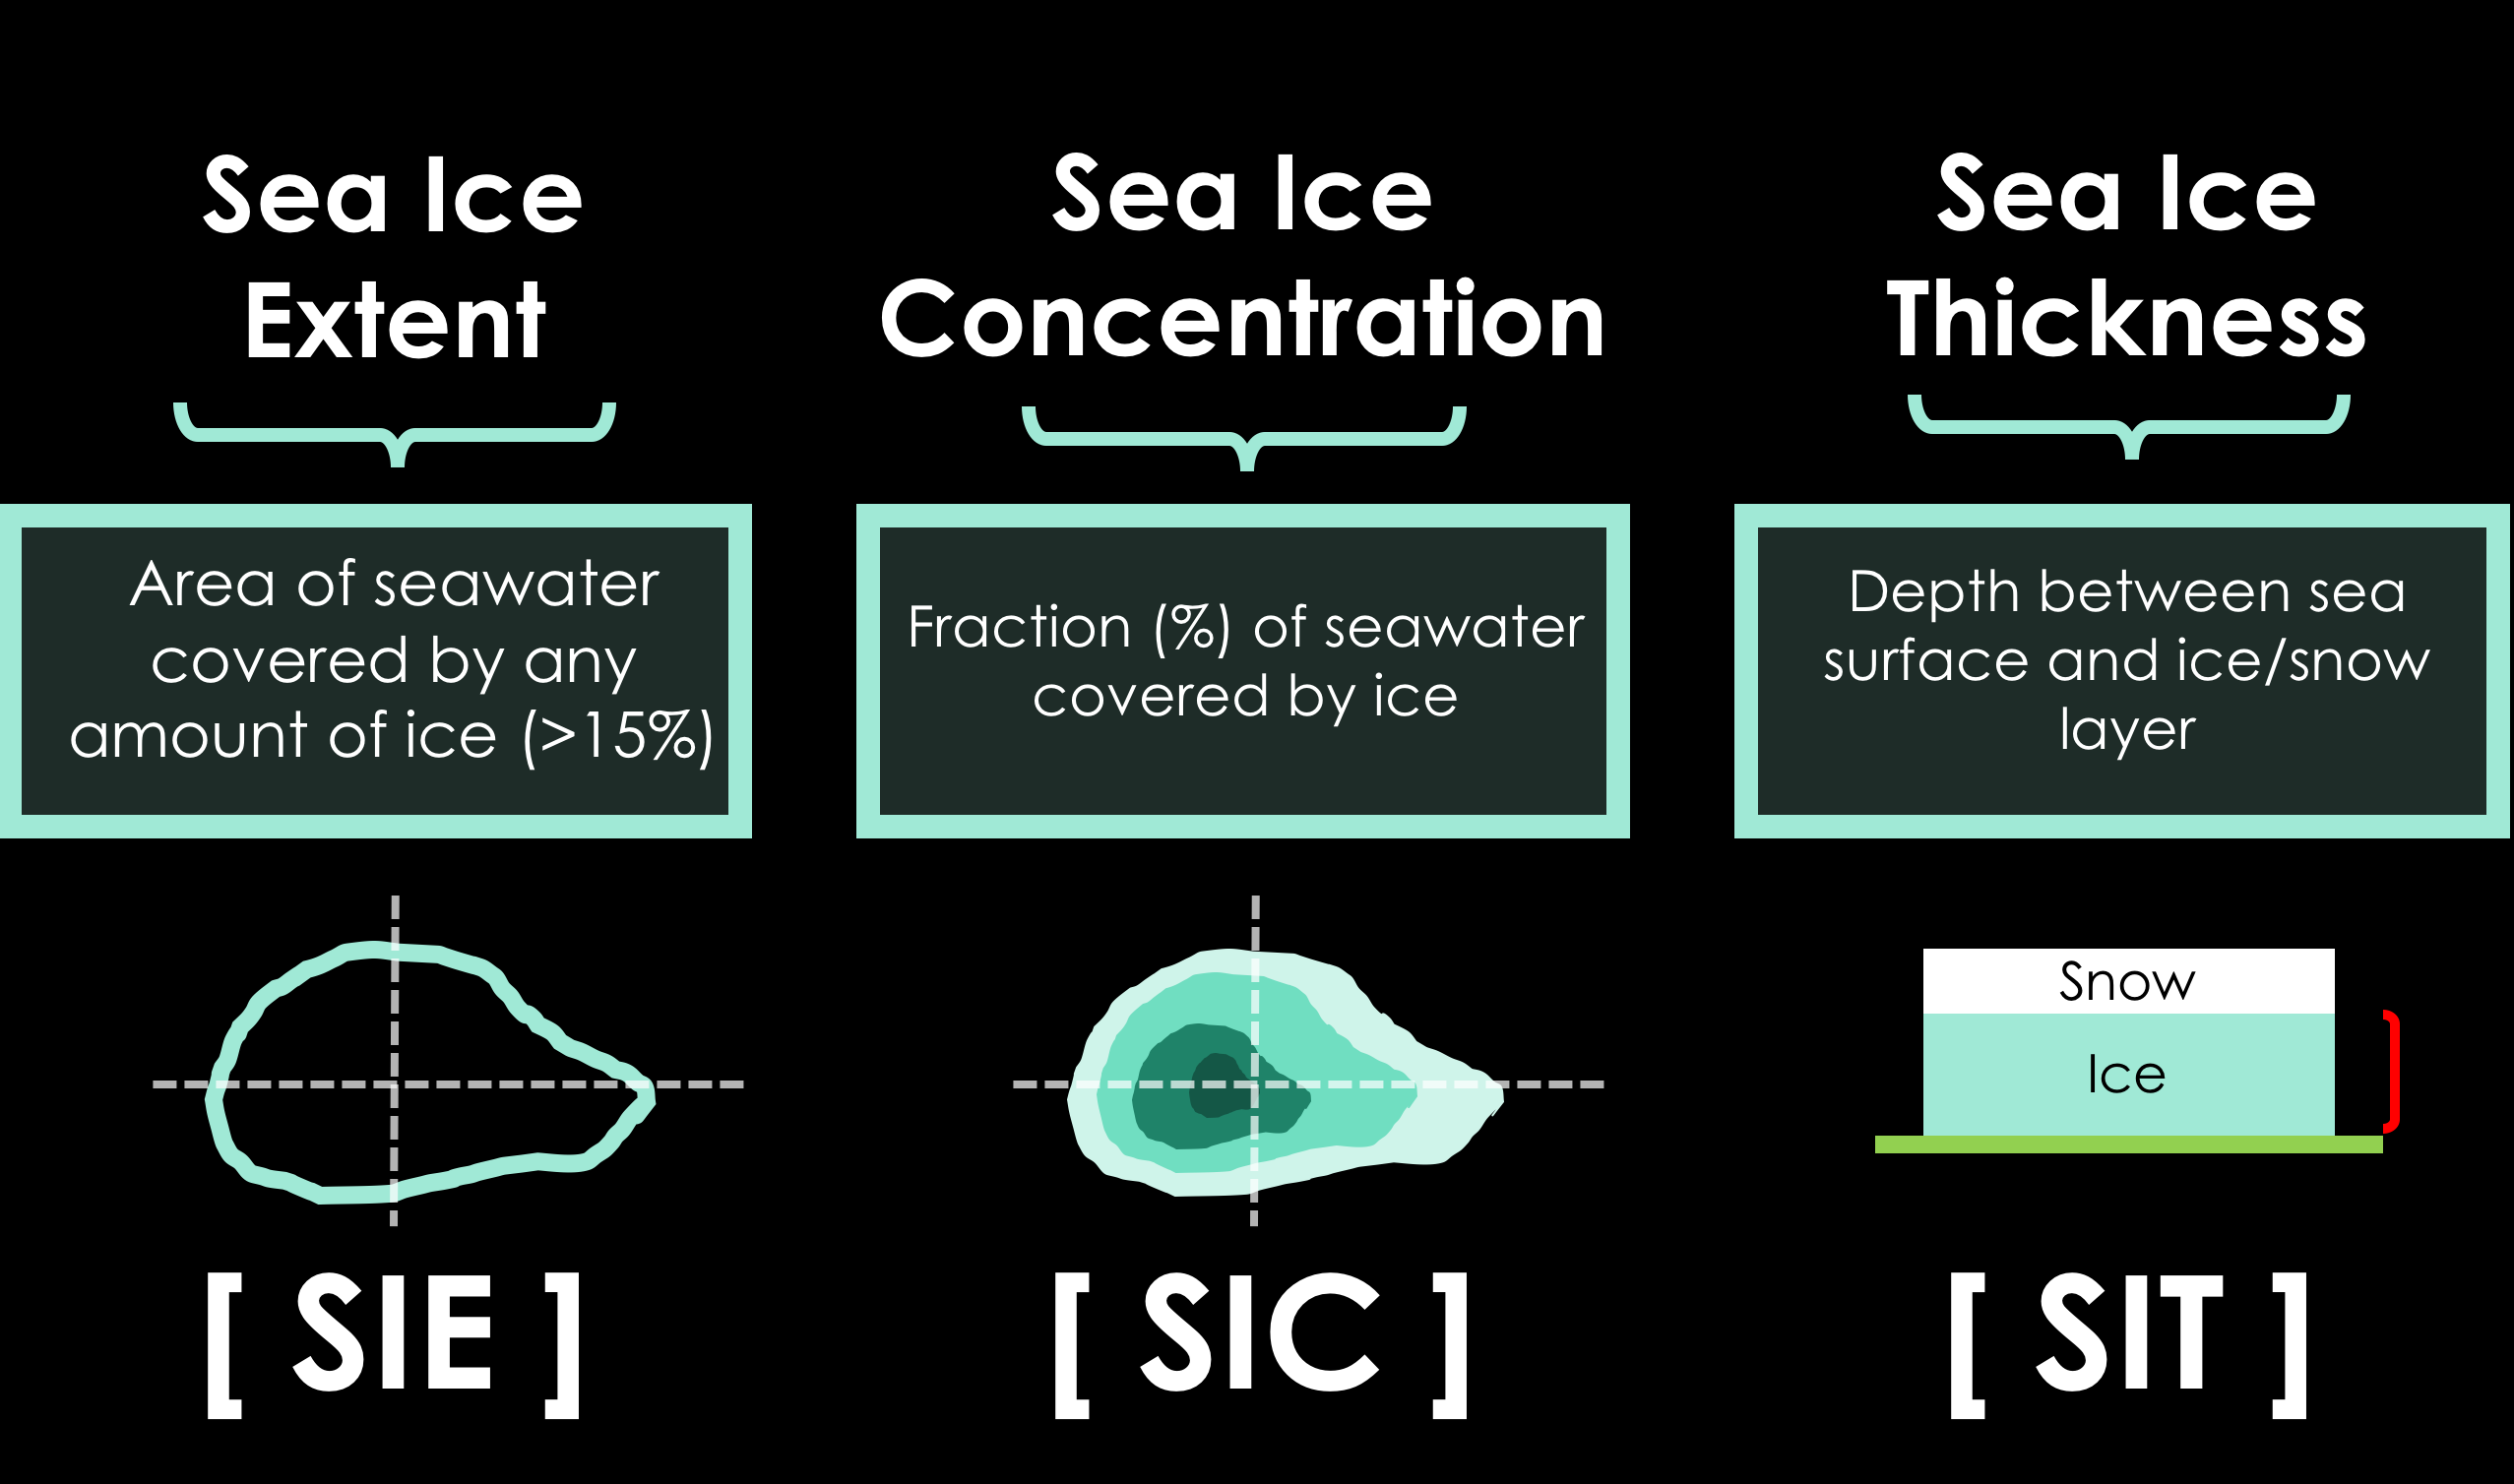
The year-to-year variability and long-term decline in the extent of Arctic sea ice have been well observed since the beginning of the satellite era (from 1978/79 to present). In contrast, observing the changes in sea ice thickness has proven significantly more difficult. While several recent satellite missions (e.g., NASA’s ICESat, ESA’s CryoSat-2, SMOS) have started providing “real observations” of sea ice thickness in the last decade, many challenges still remain including: instrument types, methods for deriving sea ice thickness, measurements of snow depth on top of the ice, various spatial domains and temporal periods, etc (for more information: [Sea Ice Thickness Data Sets: Overview and Comparison]). The short period of available sea ice thickness observations in addition to various methodologies between satellite products make it difficult to assess long-term climate variability.
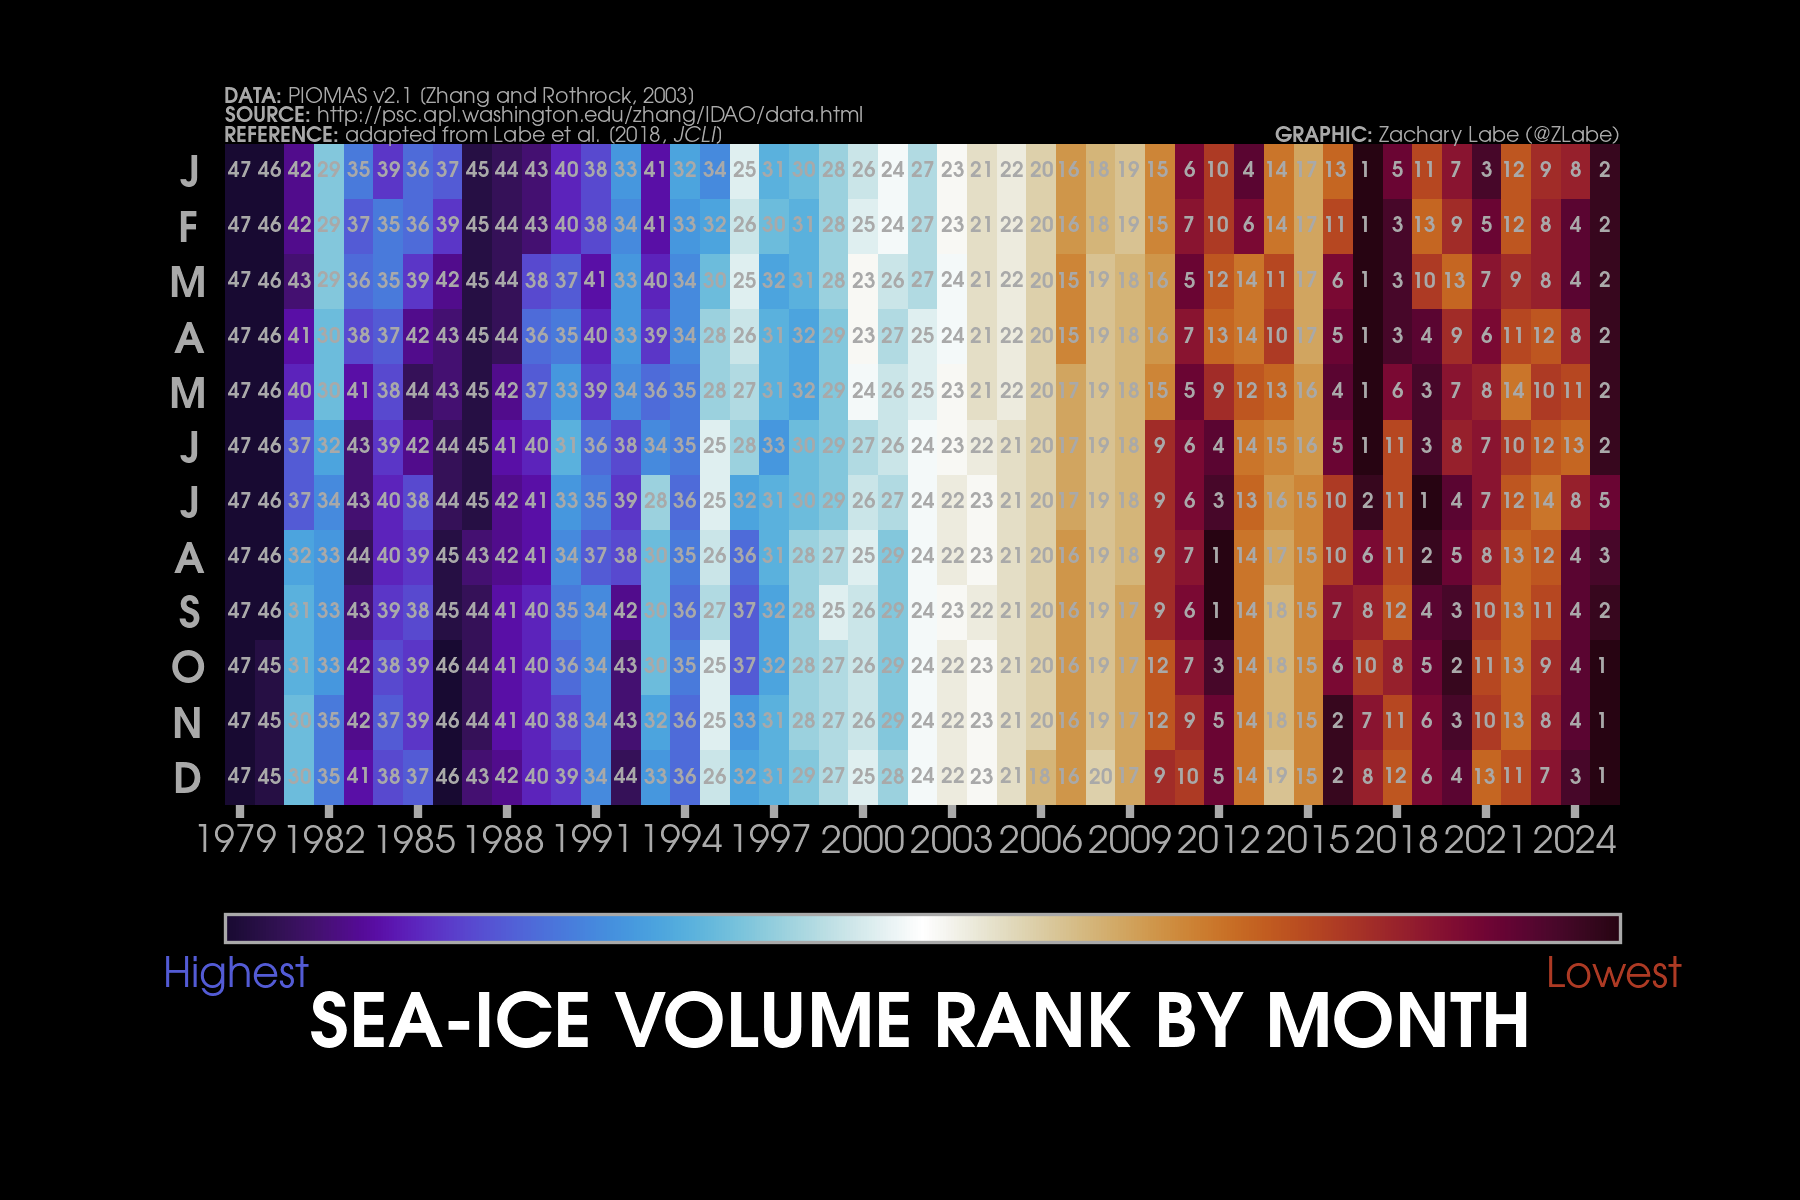
We therefore turn to using a coupled ocean and sea ice model called the Pan-Arctic Ice-Ocean Modeling and Assimilation System (PIOMAS). The model provides daily and monthly sea ice thickness output from 1979 through the present. In our new paper (Labe et al., 2018), we are interested in understanding the year-to-year variability of Arctic sea ice thickness along with the long-term trend. For comparison, we use a global climate model with 40 iterations (known as a “large ensemble”) to understand the historical variability and future projected variability (for more information: Community Earth System Model Large Ensemble project; CESM-LENS). By using the CESM-LENS, we can assess the internal climate variability (“noise – butterfly effect”) in the model without considering intermodel uncertainties (such as from using several different climate models in the Coupled Model Intercomparison Project Phase 5; CMIP5).
We first validate PIOMAS sea ice thickness output with observations from submarines, ICESat, and CryoSat-2. In agreement with earlier studies (e.g., Schweiger et al. 2011), we also show that PIOMAS compares well with observations in reproducing the spatial/temporal variability and long-term decline in sea ice thickness. Although PIOMAS is still a model (with its own uncertainties and limitations), it compares well with the recent satellite record and therefore provides us with an observational data set (or “reanalysis”).
Next we turn to comparing PIOMAS with CESM-LENS over a shared temporal period (1979-2015). While each ensemble member of CESM-LENS is one realization of internal variability, we can assess the spread (maximum sea ice thickness – minimum sea ice thickness or 95-5th percentiles) and other exploratory analysis statistics (e.g., standard deviation, empirical orthogonal function (EOF) analysis) to understand the variability in the model and then compare it with PIOMAS.
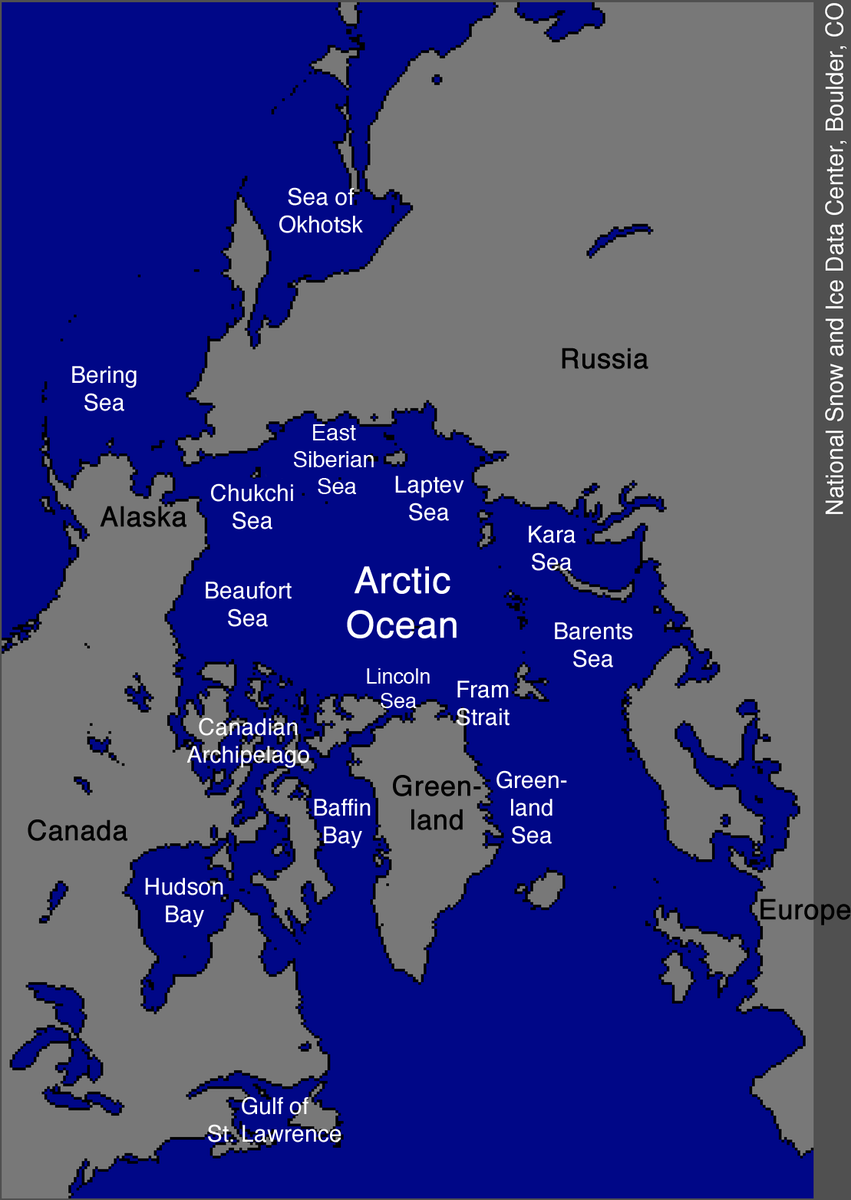
PIOMAS compares well with CESM-LENS in reproducing the temporal and spatial variability of sea ice thickness over the historical record. There are opposite signs of variability between the regions near the East Siberian Sea and near the Fram Strait. This is a result of the Northern Annular Mode (NAM) climate pattern of variability, where sea ice is driven across the Arctic Ocean toward the North Atlantic (Transpolar Drift Stream). We show that CESM-LENS simulates thicker ice than PIOMAS over a large portion of the Arctic Ocean, especially near the East Siberian Sea and along the northern coasts of Greenland and the Canadian Arctic Archipelago. However, the rate of recent sea ice thinning between PIOMAS and CESM-LENS is remarkably similar.
Finally, we look at future projections of sea ice thickness and its variability in CESM-LENS. We focus on the mid and late 21st century, which is simulated under an extreme emissions scenario in CESM-LENS (RCP8.5). As sea ice continues to thin (especially by the mid 21st century), there is a dramatic reduction in year-to-year variability. Sea ice thickness is reduced across the entire Arctic with the only “thick” ice (1-2 m) found along the northern coast of Greenland.

Nevertheless, we emphasize the importance of considering year-to-year variability in future sea ice thickness, which is heavily influenced by weather, ocean dynamics, and other climate modes of variability (e.g., NAM, AMO). We do not expect new minimum thickness records each year. Even so, without a reduction in the emission of greenhouse gases, we project significant losses of Arctic sea ice thickness by the middle to end of the 21st century. This will have large ecological, social, political, and economic consequences beyond just the Arctic. Our future work will assess how sea ice thickness loss contributes to the large-scale atmospheric circulation (see more).
Refereed/Peer-Reviewed:
[1] Labe, Z.M., G. Magnusdottir, and H.S. Stern (2018), Variability of Arctic sea ice thickness using PIOMAS and the CESM Large Ensemble, Journal of Climate, DOI:10.1175/JCLI-D-17-0436.1.
[HTML][BibTeX][Code]
[Plain Language Summary]
Conferences Abstracts/Posters:
[3] Labe, Z.M., G. Magnusdottir, and H.S. Stern. Variability and future projections of Arctic sea ice thickness. Understanding the Causes and Consequences of Polar Amplification Workshop, Aspen Global Change Institute, Aspen, CO (Jun 2017).
[Recording][Slides]
[2] Labe, Z.M., G. Magnusdottir, and H.S. Stern. Arctic Sea Ice Thickness Variability and the Large-scale Atmospheric Circulation Using Satellite Observations, PIOMAS, and the CESM Large Ensemble, 14th Conference on Polar Meteorology and Oceanography, Seattle, WA (Jan 2017).
[Abstract] [Poster][Code]
[1] Labe, Z.M., G. Magnusdottir, and H.S. Stern. Making the most of Arctic sea ice thickness observations, Symposium on Recent Advances in Data Science, University of California, Irvine (Oct 2016).
[Poster][Code]