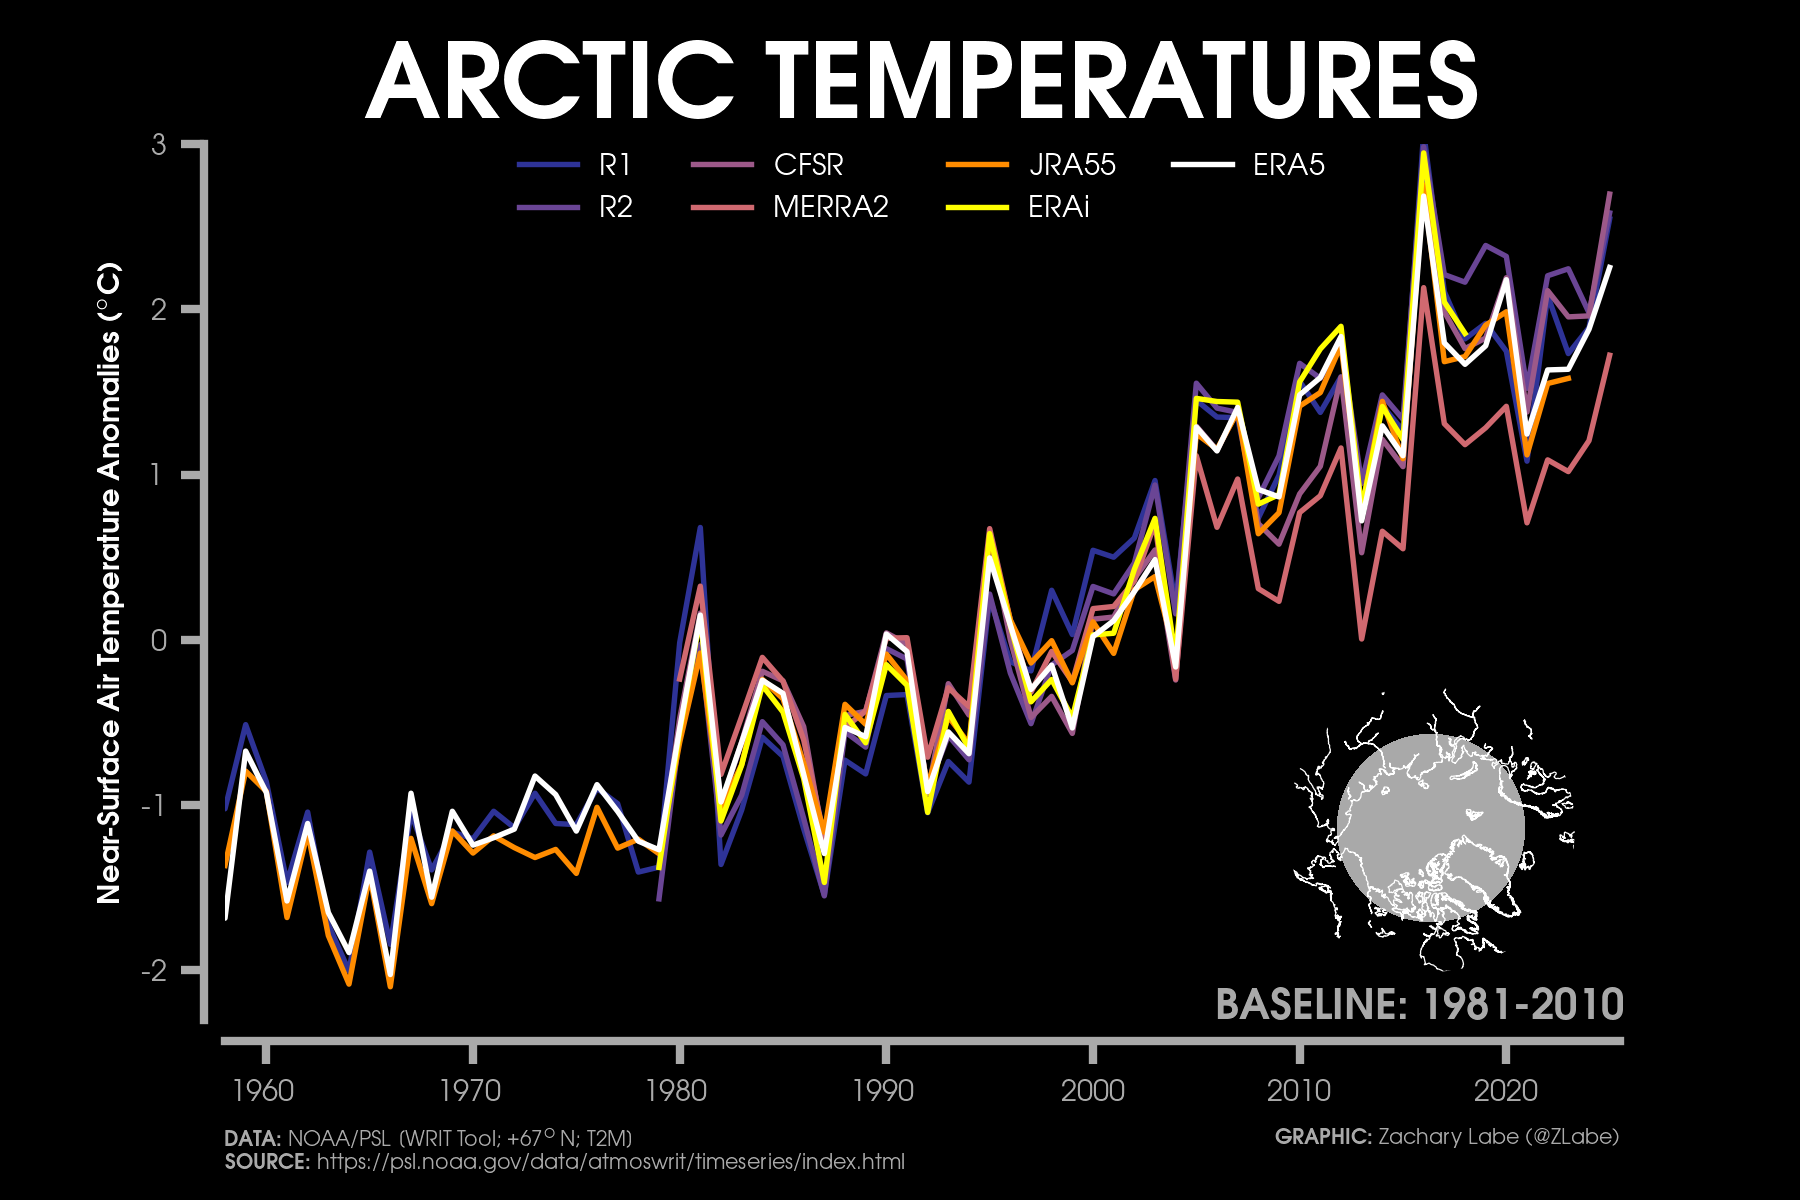
Annual average 2-m temperature anomalies in the Arctic (67°N+) for various reanalysis data sets through 2025. Anomalies are calculated from a 1981-2010 baseline. All of the raw observational data I use for my climate visualizations is free and publicly available. I have compiled a list of their respective data archives and methodological references below. For more general information about climate data, I highly recommend exploring the NCAR Climate Data Guide (Schneider et al. 2013 ) and Advancing Reanalysis page. I also discuss specific examples of climate data visualizations in more detail in my monthly blog. Looking for how to get started in Python? Look here !
If you have any questions about the resources below, please do not hesitate to reach out ! This page is very much under construction as newer data become available. Updates to data products are normal and a critical part of the scientific process. Uncertainties in data are real and normal too. I encourage you to compare datasets from different scientific institutions around the world – though you’ll find the same overall climate change story.
Lastly, a huge thank you to all of the scientists, software engineers, administrators, and support staff that make this all possible. Be kind if something isn’t working, and have fun exploring!
For interactively exploring climate data without coding experience:
Charctic Interactive Sea Ice Graph
Climate Change Warming Stripes
Climate Reanalyzer
GISS Surface Temperature Analysis Plots
IPCC AR6 WGI Interactive Atlas
KNMI Climate Explorer
NOAA Climate.gov Interactive Data
NOAA Daily Mean Climate Composites
NOAA FACility for Weather and Climate AssessmenTS
NOAA Monthly or seasonal time series of climate variables
NOAA National Centers for Environmental Information: Climate at a Glance
NOAA Web-based Reanalysis Intercomparison Tool: Monthly/Seasonal Time-Series
OSI SAF Sea Ice Index Quicklooks
University of Bremen: Sea Ice Data Browser
VIsualization Service of Horizontal scale Observations at Polar region
For using weather model forecast guidance:
Climate Reanalyzer – University of Maine
CyclonicWx – Alex Boreham
Earth Nullschool – Cameron Beccario
Ensemble Situational Awareness Table – NOAA
Forecast Charts – ECMWF
GFS Analyses and Forecasts – Alicia Bentley
Global and Regional Climate Anomalies – Karsten Haustein
Model Analyses and Guidance – NOAA
NBM 1D Viewer – NOAA
NEXLAB – College of DuPage
Pivotal Weather
PolarWx – Tomer Burg
PSU’s e-WALL
Real-Time Quasi-Geostrophic (QG) Diagnostics – Thomas Galarneau
Tropical Cyclone Guidance Project – NCAR/RAL
Tropical Model Guidance – Brian Tang
Tropical Tidbits – Levi Cowan
Weathernerds – Matt Onderlinde
WxCharts – MetDesk For monitoring (near-)surface air temperatures:
Berkeley Earth Surface Temperatures (Rohde and Hausfather, 2020 ): http://berkeleyearth.org/data/
Climate Forecast System Reanalysis (Saha et al. 2010 ): https://rda.ucar.edu/datasets/ds093.1/
ERA5 Reanalysis (Hersbach et al. 2020 ): https://climate.copernicus.eu/climate-reanalysis
ERA5-Land Reanalysis (Muñoz-Sabater et al. 2021 ): https://climate.copernicus.eu/climate-reanalysis
ERA-Interim Reanalysis (Dee et al. 2011 ): https://www.ecmwf.int/en/forecasts/datasets/reanalysis-datasets/era-interim
ERA-20C Reanalysis (Poli et al. 2016 ): https://www.ecmwf.int/en/forecasts/datasets/reanalysis-datasets/era-20c
HadCRUT5 (V5.0.1.0) (Morice et al. 2020 ): https://www.metoffice.gov.uk/hadobs/hadcrut5/data/current/download.html
ERA-40 Reanalysis (Uppala et al. 2005 ): https://apps.ecmwf.int/datasets/data/era40-moda/levtype=sfc/
JRA-55 Reananlysis (Kobayashi et al. 2015 ): https://jra.kishou.go.jp/JRA-55/atlas/en/index.html
JRA-3Q Reananlysis (Kosaka et al. 2024 ): https://jra.kishou.go.jp/JRA-3Q/index_en.html
Modern-Era Retrospective analysis for Research and Applications (V2) (Gelaro et al. 2017 ): https://gmao.gsfc.nasa.gov/reanalysis/MERRA-2/data_access/
NASA/GISS GISTEMP (V4) (Lennsen et al. 2019 ): https://data.giss.nasa.gov/gistemp/
NCEP-NCAR Reanalysis I (Kalnay et al. 1996 ): https://psl.noaa.gov/data/gridded/data.ncep.reanalysis.html
NCEP/DOE Reanalysis II (Kanamitsu et al. 2002 ): https://psl.noaa.gov/data/gridded/data.ncep.reanalysis2.html
NOAA-CIRES 20th Century Reanalysis (V2c) (Compo et al. 2011 ): https://psl.noaa.gov/data/gridded/data.20thC_ReanV2c.html
NOAA/CIRES/DOE 20th Century Reanalysis (V3) (Slivinski et al. 2019 ): https://psl.noaa.gov/data/gridded/data.20thC_ReanV3.html
NOAAGlobalTemp (V5.1) (Zhang et al. 2019 ): https://www.ncei.noaa.gov/products/land-based-station/noaa-global-temp
NOAAGlobalTemp (V6.0.0) (Huang et al. 2022 ): https://www.ncei.noaa.gov/products/land-based-station/noaa-global-temp
NOAA Monthly U.S. Climate Gridded Dataset (V1.0) (Vose et al. 2014 ): https://www.ncei.noaa.gov/access/metadata/landing-page/bin/iso?id=gov.noaa.ncdc:C00332
For monitoring greenhouse gases:
EPICA Dome C – 800KYr CO2 Data (Lüthi et al. 2008 ): https://www.ncdc.noaa.gov/paleo-search/study/6091
Law Dome Ice Core 2000-Year CO2, CH4, N2O and d13C-CO2 (Rubino et al. 2019 ): https://data.csiro.au/collection/csiro:37077
Mauna Loa Observatory, HI Carbon Dioxide Record (Keeling et al. 2001 ): http://doi.org/10.6075/J08W3BHW
NOAA Global Monitoring Laboratory – Earth System Research Laboratories: https://gml.noaa.gov/ccgg/
Scripps CO2 program – Ice-core Data (MacFarling Meure et al. 2006 ): https://scrippsco2.ucsd.edu/data/atmospheric_co2/icecore_merged_products.html For monitoring ocean temperatures:
HadSST.4.0.1.0 (Kennedy et al. 2019 ): https://www.metoffice.gov.uk/hadobs/hadsst4/data/download.html
JMA Ocean Heat Content (Ishii et al. 2017 ): https://www.data.jma.go.jp/gmd/kaiyou/english/ohc/ohc_global_en.html
NOAA Extended Reconstructed Sea Surface Temperature (V5) (Huang et al. 2017 ): https://www.ncei.noaa.gov/products/extended-reconstructed-sst
NOAA Optimum Interpolation Sea Surface Temperature (V2) (Reynolds et al. 2002 ): https://psl.noaa.gov/data/gridded/data.noaa.oisst.v2.html
NOAA Optimum Interpolation Sea Surface Temperature (V2.1) High Resolution (Huang et al. 2021 ): https://psl.noaa.gov/data/gridded/data.noaa.oisst.v2.highres.html
For monitoring sea level rise:
NASA GSFC TOPEX/Poseidon, Jason-1, OSTM/Jason-2, Jason-3, and Sentinel-6 (V5.1) (Beckley et al. 2010 ; Beckley et al. 2017 ): https://climate.nasa.gov/vital-signs/sea-level/
Sea Level Research Group, University of Colorado, TOPEX/Poseidon, Jason-1, Jason-2, Jason-3, and Sentinel-6 MF: https://sealevel.colorado.edu/
For monitoring moisture and precipitation:
HadISDH – Gridded Global Surface Humidity Dataset (Willett et al. 2014 ): https://www.metoffice.gov.uk/hadobs/hadisdh/
Global Precipitation Climatology Project (GPCP) Monthly Analysis Product (Adler et al. 2003 ): https://psl.noaa.gov/data/gridded/data.gpcp.html
For monitoring Arctic sea-ice age:
EASE-Grid Sea Ice Age (V4) (Tschudi et al. 2020 ): https://nsidc.org/data/nsidc-0611/versions/4
Quicklook Arctic Weekly EASE-Grid Sea Ice Age (V1) (Tschudi et al. 2019 ): https://nsidc.org/data/nsidc-0749/versions/1
For monitoring Arctic sea-ice concentration:
Gridded Monthly Sea Ice Extent and Concentration, 1850 Onward (V2) (Walsh et al. 2016 ): https://nsidc.org/data/g10010/
Historical Sea Ice Atlas: Observed Estimates of Sea Ice Concentration in Alaska Waters: https://www.snap.uaf.edu/tools/sea-ice-atlas
NOAA/NSIDC Climate Data Record of Passive Microwave Sea Ice Concentration (V4) (Peng et al. 2013 ): https://nsidc.org/data/g02202/versions/4
NOAA/NSIDC Climate Data Record of Passive Microwave Sea Ice Concentration (V5) (Peng et al. 2013 ): https://nsidc.org/data/g02202/versions/5
NOAA/NSIDC Climate Data Record of Passive Microwave Sea Ice Concentration (V6) (Peng et al. 2013 ): https://nsidc.org/data/g02202/versions/6
Near-Real-Time NOAA/NSIDC Climate Data Record of Passive Microwave Sea Ice Concentration (V2) (Meier et al. 2021 ): https://nsidc.org/data/g10016/versions/2
Near-Real-Time NOAA/NSIDC Climate Data Record of Passive Microwave Sea Ice Concentration (V3) (Meier et al. 2024 ): https://nsidc.org/data/g10016/versions/3
Near-Real-Time NOAA/NSIDC Climate Data Record of Passive Microwave Sea Ice Concentration (V4) (Meier et al. 2024 ): https://nsidc.org/data/g10016/versions/4
For monitoring Arctic sea-ice extent:
Gridded Monthly Sea Ice Extent and Concentration, 1850 Onward (V2) (Walsh et al. 2016 ): https://nsidc.org/data/g10010/
Reconstructed changes in Arctic sea ice over the past 1,450 years (Kinnard et al. 2011 ): https://www.nature.com/articles/nature10581
Sea Ice Index (V3) (Fetterer et al. 2017 ): https://nsidc.org/data/g02135/versions/3
Sea Ice Index (V4) (Fetterer et al. 2025 ): https://nsidc.org/data/g02135/
For monitoring Arctic sea-ice thickness/volume:
CryoSat-2 (Laxon et al. 2013 ):https://cds.climate.copernicus.eu/cdsapp#!/dataset/satellite-sea-ice-thickness?tab=overview
CryoSat-2/SMOS Merged Product (Ricker et al. 2017 ): https://earth.esa.int/eogateway/catalog/smos-cryosat-l4-sea-ice-thickness
CryoSat-2 Year-Round Product (Landy et al. 2022 ): https://data.bas.ac.uk/full-record.php?id=GB/NERC/BAS/PDC/01613
ICESat-2 (Petty et al. 2020 ): https://nsidc.org/data/is2sitmogr4/versions/1
Pan-Arctic Ice Ocean Modeling and Assimilation System (Zhang and Rothrock, 2003 ): http://psc.apl.uw.edu/research/projects/arctic-sea-ice-volume-anomaly/data/
PIOMAS-20C (Schweiger et al. 2019 ): https://psc.apl.uw.edu/research/projects/piomas-20c/
For monitoring Antarctic sea-ice thickness/volume:
Global Ice-Ocean Modeling and Assimilation System (Zhang and Rothrock, 2003 ): http://psc.apl.washington.edu/zhang/Global_seaice/index.htmldata/
For monitoring polar land ice mass:
GRACE and GRACE-FO JPL RL06Mv2 Mascon Solution (Wiese et al. 2019 ): https://climate.nasa.gov/vital-signs/ice-sheets/
World Glacier Monitoring Service (WGMS et al. 2021 ): https://wgms.ch/global-glacier-state/
For monitoring snow cover:
Climate Data Record of Northern Hemisphere Snow Cover Extent (Estilow et al. 2015 ): https://climate.rutgers.edu/snowcover/
More information:
Blog Archive (2025)
Ranking Archive (2025)
Frequently Asked Questions (FAQ)
Open Data and References Open Software and Tools
My visualizations:
Arctic Climate Seasonality and Variability Arctic Sea Ice Extent and Concentration Arctic Sea Ice Volume and Thickness Arctic Temperatures Antarctic Sea Ice Extent and Concentration Climate Change Indicators Climate model projections compared to observations in the Arctic
Global Sea Ice Extent and Concentration Polar Climate Change Figures Climate Viz of the Month The views presented here only reflect my own. These figures may be freely distributed (with credit).