May 2026
Hi! And thanks for visiting! My next ‘climate viz of the month’ blog highlights a region of the Arctic that is no stranger to extreme events or climate change: the Barents Sea. In fact, this is one of the fastest-warming regions on Earth. During boreal fall, when Arctic amplification is near its seasonal peak, temperatures in parts of the Barents Sea region have warmed at rates approaching ten times the global average (see my blog here). For those not familiar with Arctic geography, the Arctic Ocean is divided into several marginal seas, and the Barents Sea lies between northern Norway and Russia. Specifically, it is located north of Scandinavia and is bordered by Novaya Zemlya to the east, Franz Josef Land to the northeast, and Svalbard to the northwest.
The Barents Sea’s location at the boundary between the Arctic and Atlantic Oceans makes it a particularly important oceanographic region where changes in ocean circulation, stratification, and sea ice all interact. It is one of the two primary gateways through which relatively warm ocean water enters the Arctic Ocean, with the other being through the Pacific via the Bering Strait. The Barents Sea is relatively shallow, with depths generally less than 300 meters, and a large volume of warm and salty Atlantic water enters through the Barents Sea Opening between northern Norway and Bear Island as an extension of the North Atlantic Current. Atlantic water also flows northward along the western coast of Svalbard through the Fram Strait. As these waters move northward, they lose heat to the atmosphere (e.g., through turbulent heat fluxes) and become transformed (density/salinity) before continuing into the Arctic Ocean (check out this overview).
One of the key drivers of the rapid warming in the Barents Sea has been increasing ocean heat transport from the Atlantic. This process, often referred to as Atlantification, broadly describes the increasing influence of warm and salty Atlantic water on Arctic Ocean properties, leading to weakened upper-ocean stratification and declining sea ice. Both changes in oceanic conditions and large-scale atmospheric circulation influence the strength of Atlantification. In fact, recent studies have demonstrated that these processes are closely coupled and contain important (multi-)decadal variability. For example, atmospheric circulation patterns such as the Arctic Oscillation and Arctic Dipole can influence the transport and distribution of Atlantic water entering the Arctic. This complexity may help explain why the long-term decline in September Arctic sea-ice extent has slowed in recent years, although this remains a very active area of research. Polyakov et al. (2023), for example, suggest that temporarily reduced ocean heat fluxes into the Arctic may have contributed to this temporary hiatus.
Along with warming of the upper ocean, additional climate feedbacks are amplifying climate change in the Barents Sea. These include the ice-albedo feedback, increased poleward transport of heat and moisture through the atmosphere, and other processes that reinforce Arctic warming. During boreal winter, the Barents Sea has experienced some of the largest declines in sea-ice extent anywhere in the Arctic, making it one of the most rapidly changing parts of the polar climate system.
The Barents Sea also contains a large fraction of the Arctic’s marginal ice zone, which marks the transition between open ocean and the pack ice farther north. The ice edge here can be highly variable throughout the year and often consists of lower sea-ice concentration. Given its relatively southern location and easier accessibility, accurately predicting sea ice conditions in this region is especially important for shipping, fisheries, and other marine activities. Conditions within the marginal ice zone can change substantially over the course of just a day as extratropical storms break apart the ice or steering flow winds push it farther north or south.
Since complicated oceanic and atmospheric factors both influence Barents Sea ice conditions, it can be difficult to attribute the primary driver of any individual sea-ice anomaly in real time. However, while this is certainly an oversimplification, I tend to think of processes like Atlantification as setting the longer-term background trend (or decadal variability), while daily/monthly atmospheric patterns often determine whether a particular season ends up with exceptionally low or relatively higher ice conditions. As I’ll discuss more below, this year’s record low sea ice in the Barents Sea has also coincided with record warm temperatures across the region during several months of 2026, adding to the long-term decline driven by human-caused climate change. Even with detailed attribution studies, though, it is nearly impossible to point to a single process responsible for a particular year’s sea-ice conditions. Now finally onto this month’s graphic…
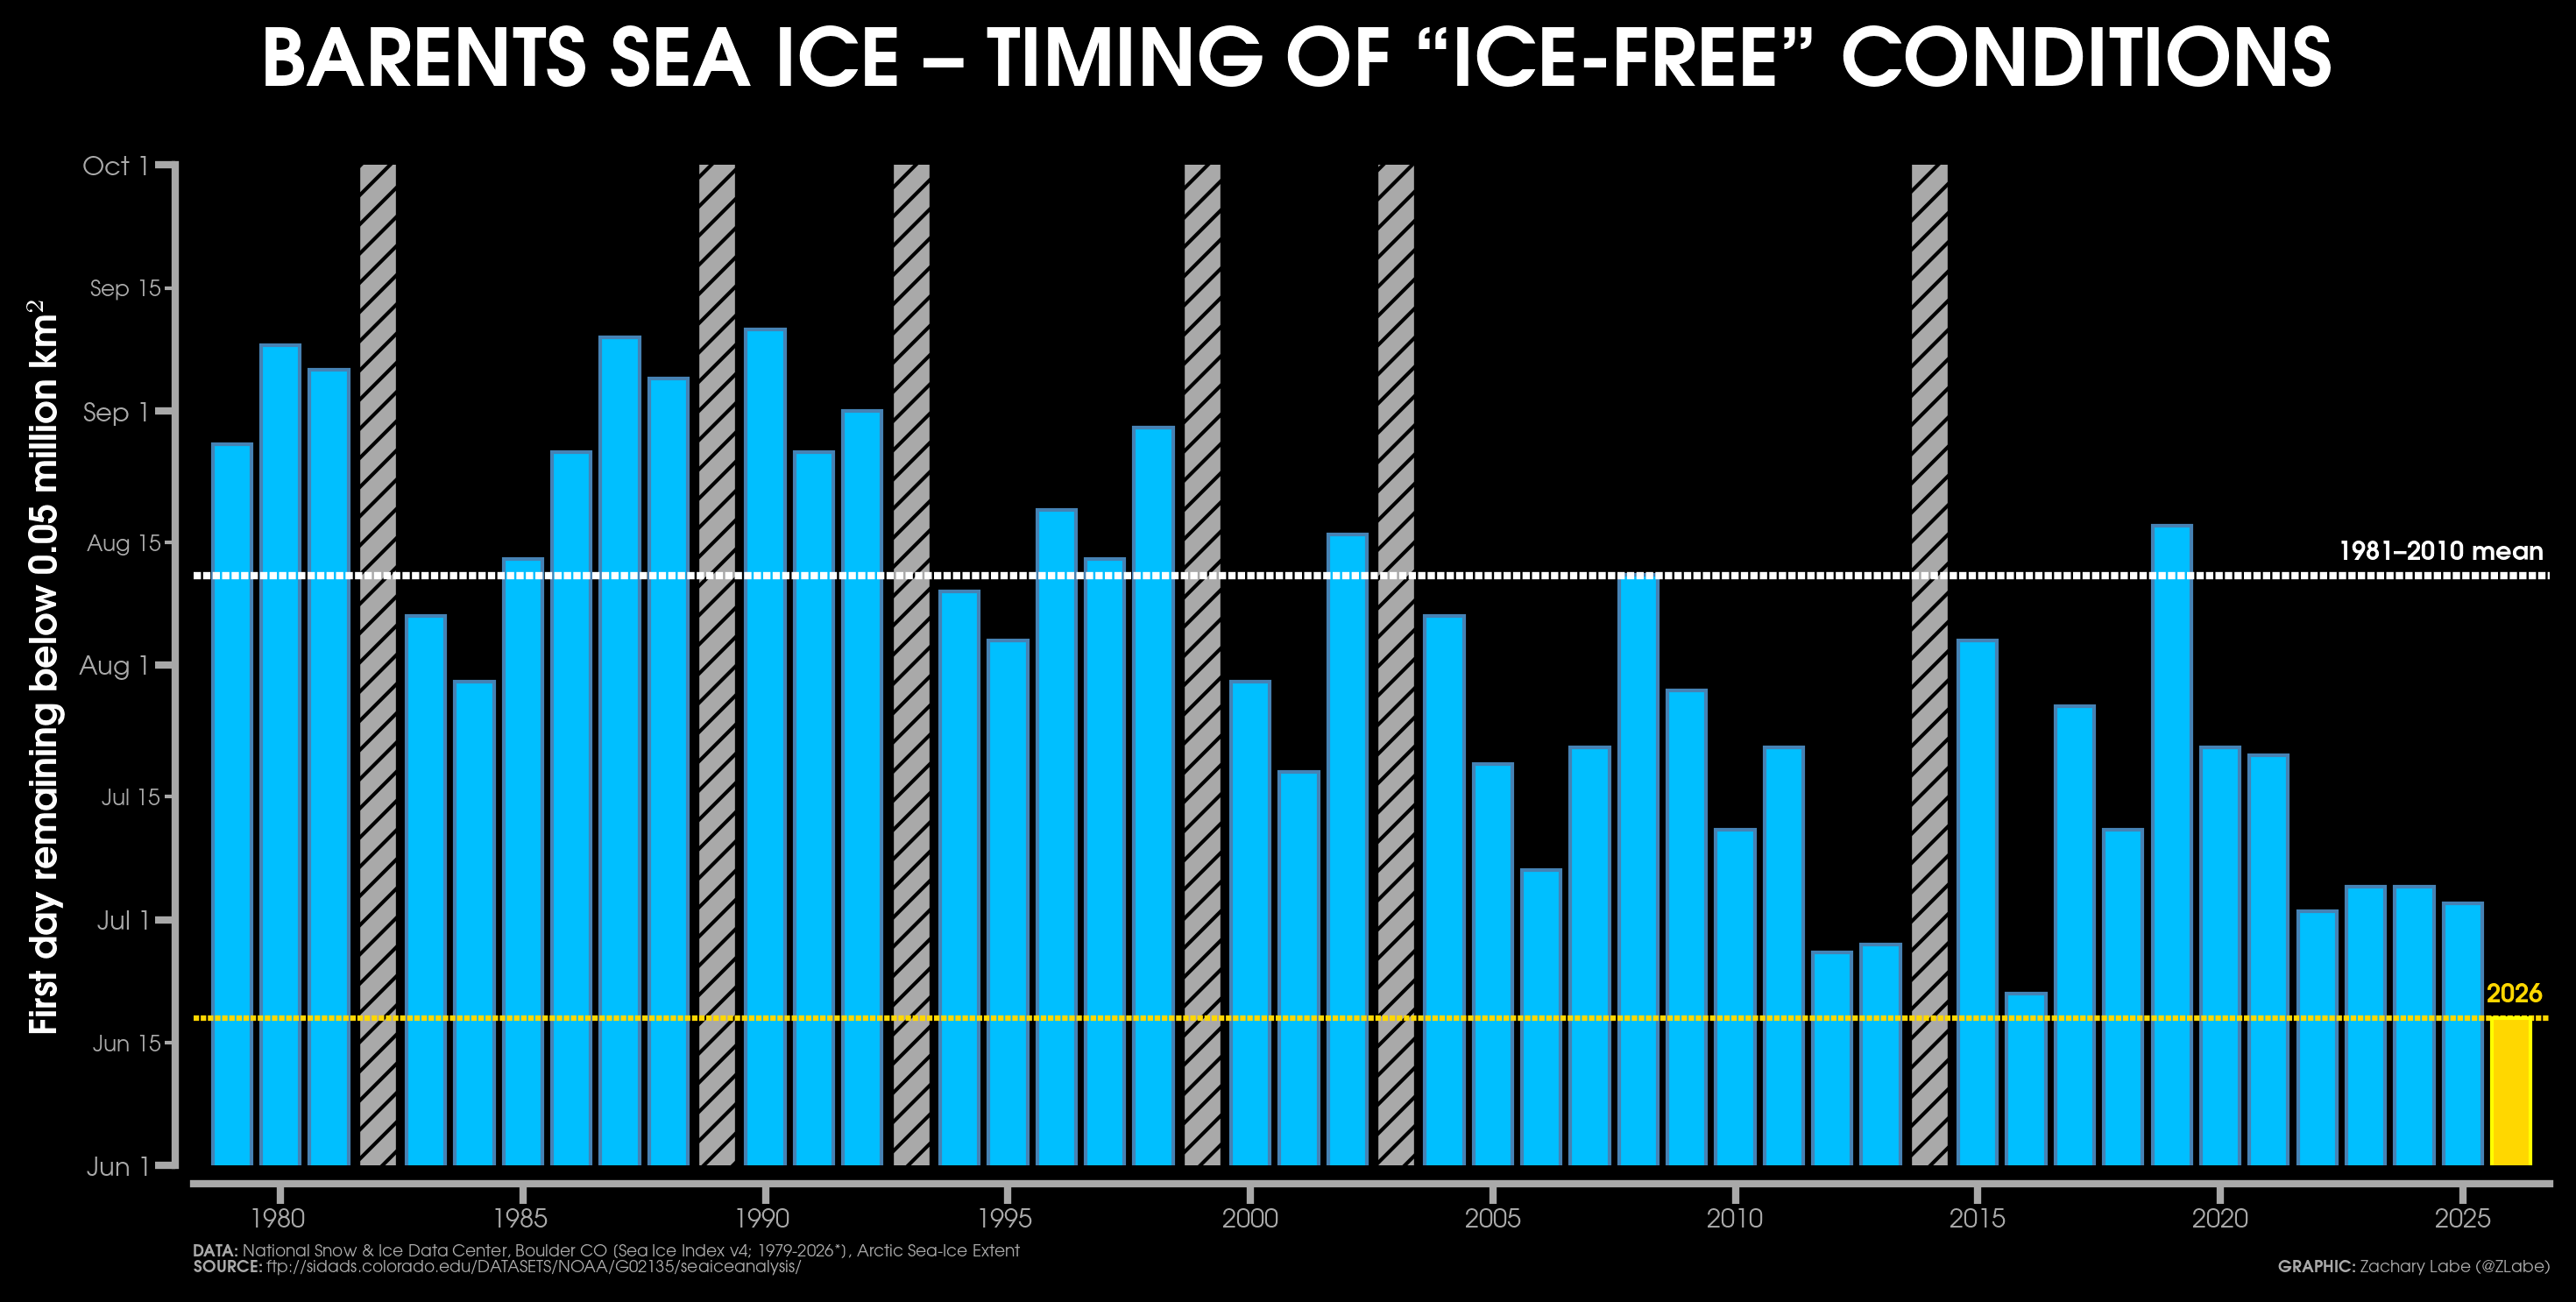
Using satellite-derived data from the National Snow and Ice Data Center (NSIDC) Sea Ice Index version 4, I computed a bar graph showing the timing of the onset of “ice-free” conditions in the Barents Sea. Here, ice-free is defined as the first date when sea-ice extent falls below 50,000 square kilometers during the melt season (boreal summer) and stays below this threshold for at least the next 7 consecutive days. For comparison, the annual maximum in recent years has averaged around 600,000 square kilometers, though it commonly exceeded 1,000,000 square kilometers back in the 1980s. There have been some years that never dropped to such a low sea-ice extent in the basin, and those are denoted by gray bars with black hatching. Looking at the 1981-2010 climatological average, this threshold has typically been reached around August 11. For reference, sea ice in the Barents Sea usually reaches its annual minimum in early to mid-September before rapidly beginning its seasonal expansion southward again by mid-October.
As you probably noticed, there is a dramatic long-term trend toward an earlier onset of these ice-free conditions. Across all years, the trend is statistically significant at about 13 days earlier per decade. Two years in particular stand out: 2016 and 2026, with this year reaching the threshold for the earliest on record (June 18). In fact, daily sea-ice extent in the Barents Sea has been at record-low levels for much of June. Note that the second-earliest year, 2016, was also the warmest year on record for air temperatures in the Barents Sea, while 2024 had the warmest average late-summer sea surface temperatures (see our annual review in the Arctic Report Card). I’ve also included an animation of daily sea-ice concentration in the region since early April, where you can see the unusually early retreat of sea ice north of Svalbard, along with the large day-to-day variability caused by changing weather conditions.
I also want to point out that this is a continuation of the extreme sea-ice conditions observed in the Barents Sea since last year. In fact, August, September, October, November, and December of 2025 all set new monthly record lows for sea-ice extent and were associated with the latest seasonal freeze-up on record. Sea ice did not begin forming across portions of the region until early December, which is truly alarming.
In summary, this month’s blog was intended to highlight another historic climate extreme emerging from the Barents Sea, which is already one of the fastest-changing regions on Earth due to human-caused climate change.
I will be closely monitoring conditions over the next few months as the region experiences an unusually extensive area of open water. As a quick side note, be sure to check out our new study from earlier in 2026, which showed that loss of sea ice in the Greenland and Barents Seas can also influence the atmospheric circulation by strengthening planetary-scale waves and shifting the jet stream. These changes can then contribute to summertime temperature anomalies in the Gulf Stream and Kuroshio-Oyashio Extension regions. Everything is connected in the Earth system!
Now for a quick summary of climate conditions elsewhere across the Arctic during the month of May…
Overall Arctic sea-ice extent averaged the 2nd lowest on record for the month of May, which was unsurprisingly mainly due to the Barents Sea anomaly, though conditions along the entire Arctic ice edge were pretty low too. For instance, current sea-ice extent in the Baffin Bay is a record low for late June. However, similar to recent years, very slow ice melt-out across the Canadian Arctic and Beaufort/Chukchi Seas has continued into June, and my guess is that this will likely yet again prevent another record low for September. As for other sea ice metrics, we sadly still don’t have any PIOMAS/GIOMAS data on ice thickness and volume (see my prior blog for more details). May 2026 temperatures were fairly unremarkable across the Arctic, with colder-than-average temperatures across the Pacific side of the Arctic, especially over the Beaufort Sea. In fact, this was the first month in a while with a slightly negative temperature anomaly near the North Pole (1981-2010 baseline), and this pattern has continued into June. In contrast, the largest warm temperature anomalies were in northwestern Siberia and well exceed 5°C above the 1981-2010 average. Otherwise, I know there are a lot of questions about what this upcoming and potentially very strong El Niño means for sea ice in the Arctic, but I will save this for another day (TLDR, it’s tricky!).
Thank you for reading! My other monthly blogs since 2022 are linked below. If you’d like to support the effort behind maintaining and updating these website graphics, you can do so here: https://buymeacoffee.com/zacklabe.
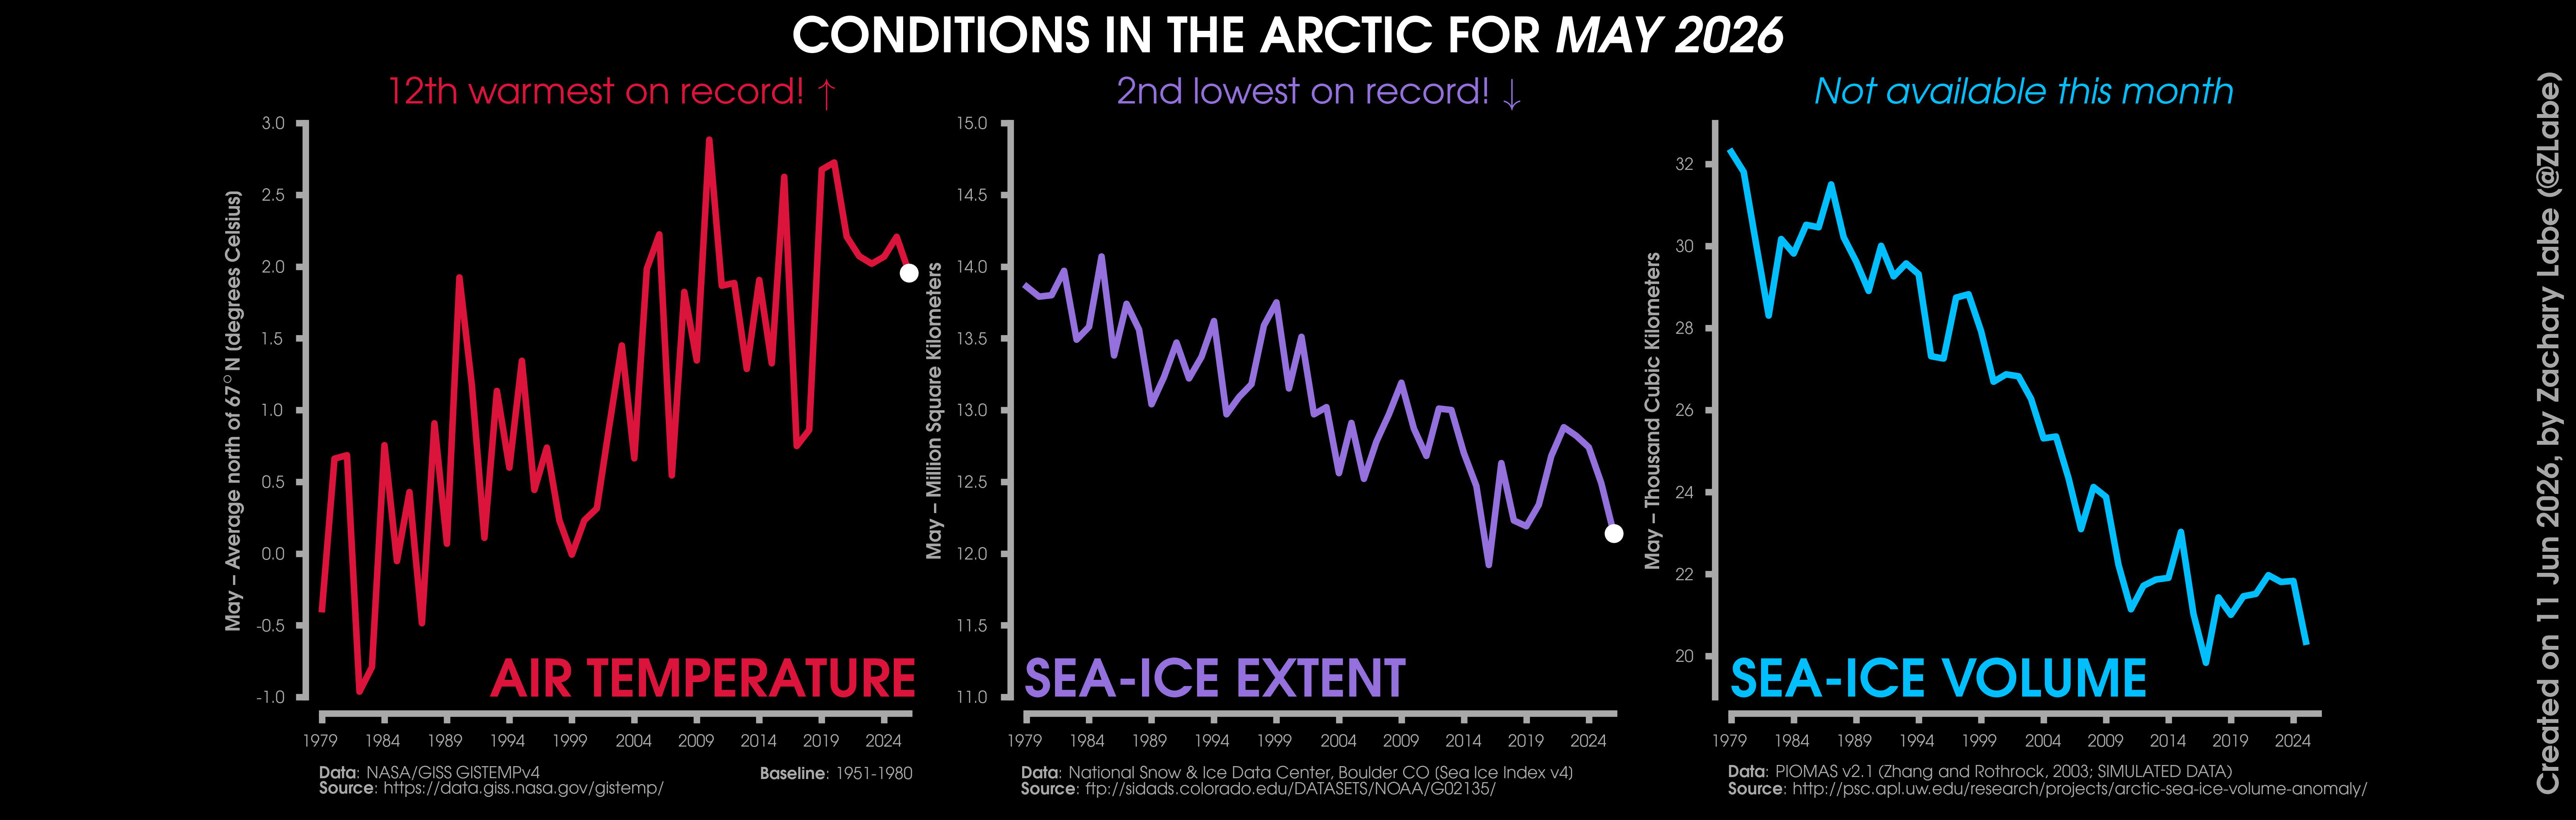
Changes in mean surface air temperature anomalies (GISTEMPv4; 1951-1980 baseline), mean Arctic sea ice extent (NSIDC; Sea Ice Index v4), and mean Arctic sea ice volume (PIOMAS v2.1; Zhang and Rothrock, 2003) over the satellite era. Updated 6/11/2026.
Other Blogs (Monthly):

Other Climate Data Statistics (Monthly):
My Visualizations:
My research related to data visualization:
[2] Witt, J.K., Z.M. Labe, A.C. Warden, and B.A. Clegg (2023). Visualizing uncertainty in hurricane forecasts with animated risk trajectories. Weather, Climate, and Society, DOI:10.1175/WCAS-D-21-0173.1
[HTML][BibTeX][Code]
[Blog][Plain Language Summary][CNN]
[1] Witt, J.K., Z.M. Labe, and B.A. Clegg (2022). Comparisons of perceptions of risk for visualizations using animated risk trajectories versus cones of uncertainty. Proceedings of the Human Factors and Ergonomics Society Annual Meeting, DOI:10.1177/1071181322661308
[HTML][BibTeX][Code]
[Plain Language Summary][CNN]
The views presented here only reflect my own. These figures may be freely distributed (with credit). Information about the data can be found on my references page and methods page.