December 2026
November 2026
October 2026
September 2026
August 2026
July 2026
June 2026
May 2026
April 2026
March 2026
February 2026
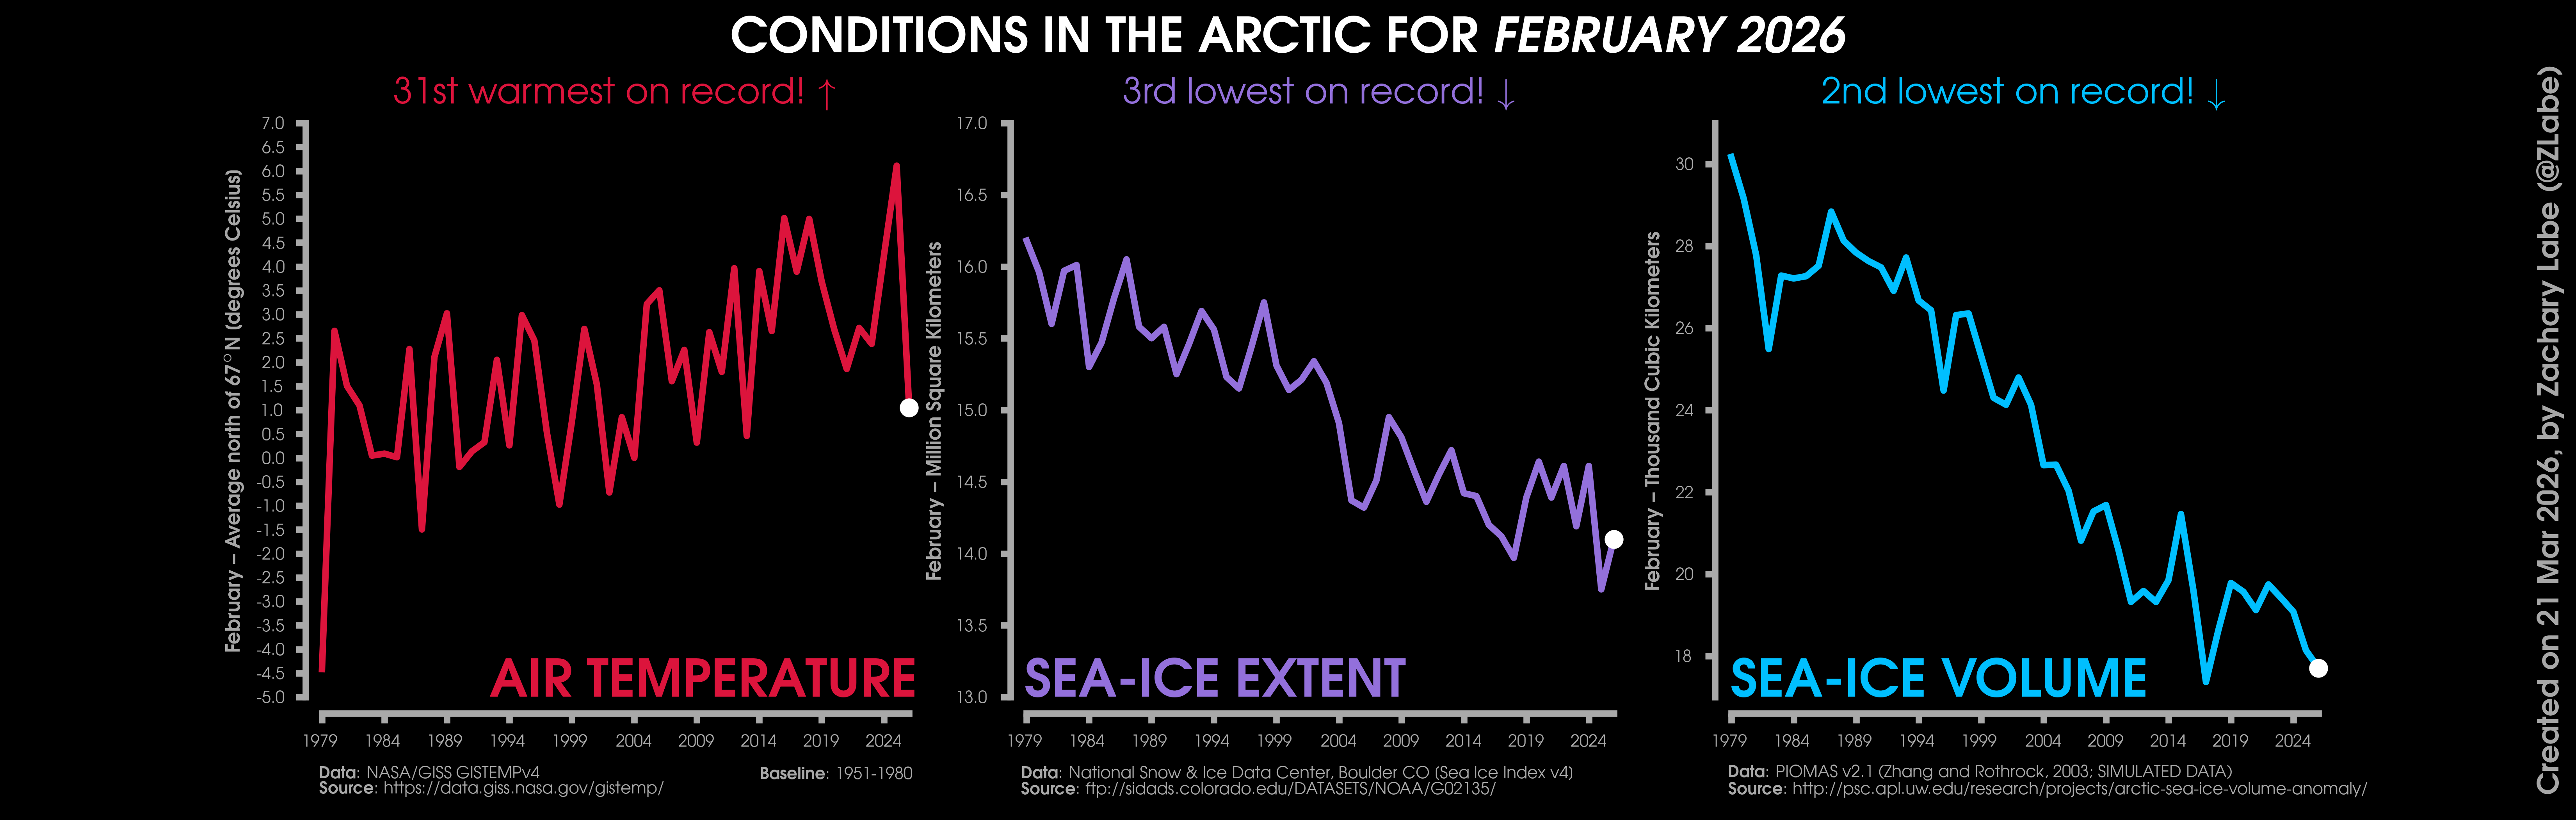
Changes in mean surface air temperature anomalies (GISTEMPv4; 1951-1980 baseline), mean Arctic sea ice extent (NSIDC; Sea Ice Index v4), and mean Arctic sea ice volume (PIOMAS v2.1; Zhang and Rothrock, 2003) over the satellite era. Updated 3/21/2026.
January 2026
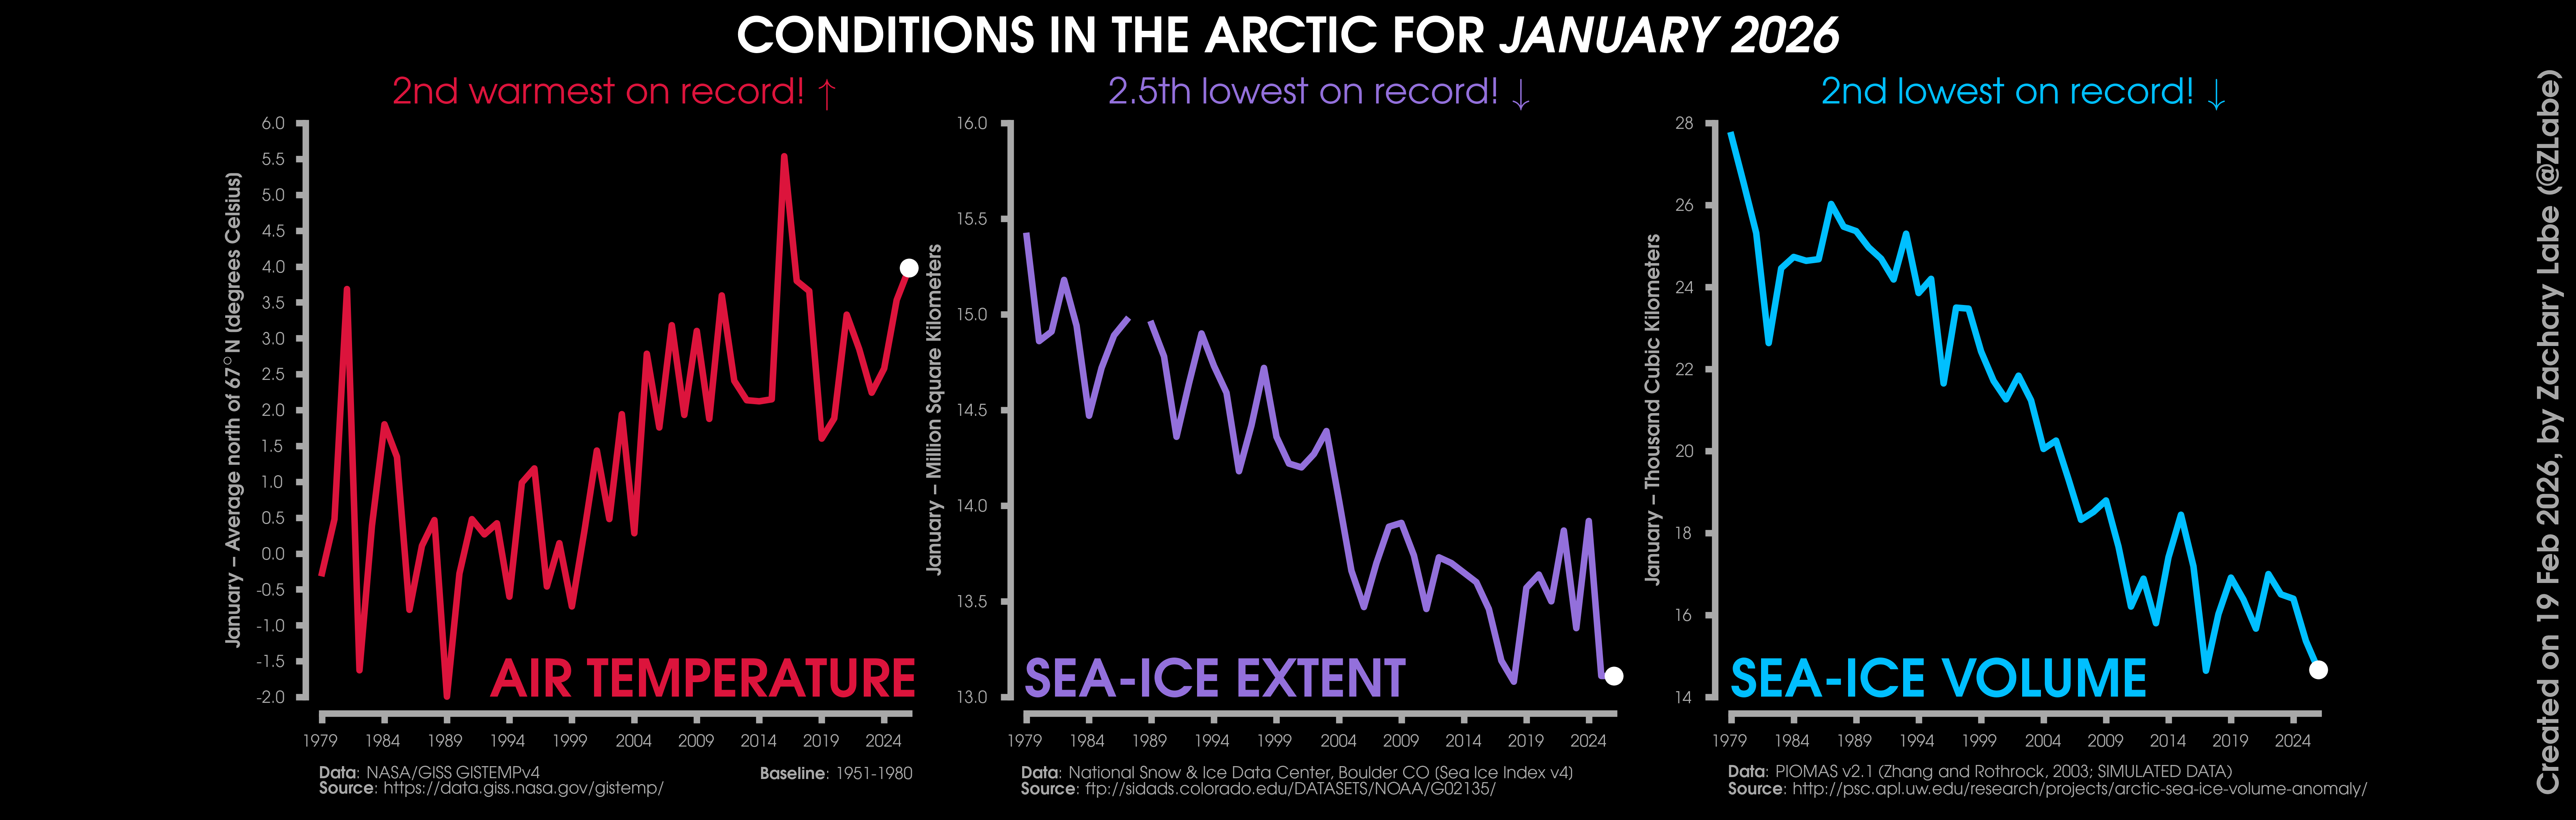
Changes in mean surface air temperature anomalies (GISTEMPv4; 1951-1980 baseline), mean Arctic sea ice extent (NSIDC; Sea Ice Index v4), and mean Arctic sea ice volume (PIOMAS v2.1; Zhang and Rothrock, 2003) over the satellite era. Updated 2/19/2026.
Other climate year statistics:
My visualizations:
The views presented here only reflect my own. These figures may be freely distributed (with credit). Information about the data can be found on my references page and methods page.