June 2026
Hi there! This month’s “climate viz of the month” blog will be a shorter one and takes a look at a pretty simple but often misunderstood concept: how regional warming influences the global average temperature record. For this analysis, I am using NASA’s GISTEMPv4 dataset and focusing on annual mean temperatures. The dataset extends from 1880 to present and is based on surface temperature observations from weather stations, buoys, and ships (gridded land and ocean regions). GISTEMP also uses a statistical spatial analysis approach to estimate temperature changes in areas with limited observations. For the analysis here, I am using their standard 1951–1980 climatological baseline (see their FAQ here for more details on why this period is used).
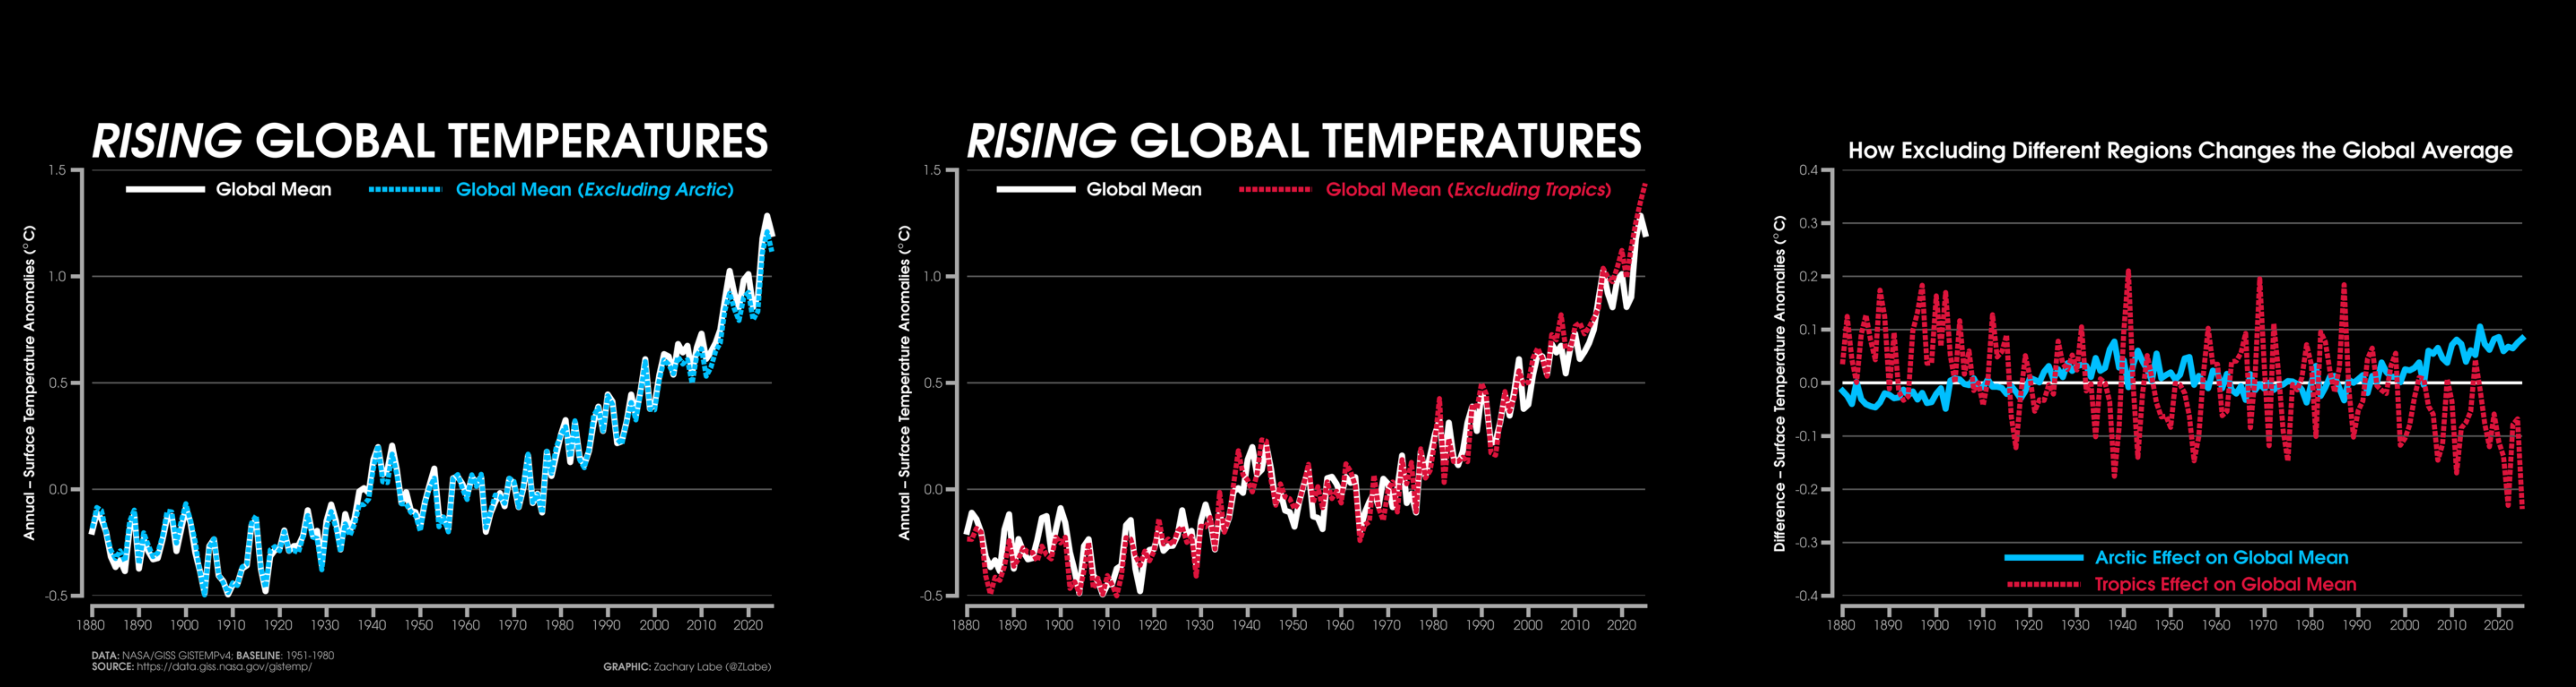
The purpose of this blog is to quantitatively examine a climate misconception that I sometimes see shared: that the rapid warming of the Arctic is the reason the global mean temperature time series is increasing. While Arctic amplification is one of the most prominent signals of human-caused climate change, the Arctic only covers about 4% of Earth’s surface area. To explore how much this region influences the global average, I first calculated the standard global mean surface temperature record and then recalculated it while excluding the Arctic (defined here as areas north of 66.5°N latitude). Note that I use cosine-weighted averages throughout the analysis to account for the fact that Earth is a sphere and grid cells in the dataset represent different surface areas at different latitudes. Here, we can see that even without including the rapidly warming Arctic, the global temperature record has a very similar structure in both its short- and long-term warming trends and year-to-year variability. The two lines remain nearly identical throughout most of the record, with a small divergence maybe beginning to emerge in recent decades as Arctic amplification strengthens. Since the Arctic is warming much faster than the global average, including it does slightly increase the calculated global temperature anomaly, but this effect is relatively small because of its limited area. Ultimately, the rise in global mean temperature is not a result of including the Arctic in the calculation. Instead, it reflects widespread warming across the planet, with the Arctic representing one of the strongest regional responses to that overall change in radiative forcing.
Now let’s look at the effect of another region on the global average temperature record: the Tropics, which represent the largest single latitude band on Earth and cover approximately 40% of the planet’s surface area. For this exercise, I am performing the same type of analysis. First, I calculate the standard global mean surface temperature record including all latitudes. Then, I calculate a second global mean temperature time series using only areas outside of the Tropics (23.5°S-23.5°N). Here, we can see that excluding the Tropics has a somewhat larger influence on the global temperature record than excluding the Arctic, particularly in terms of interannual variability and some short-term trends. This is expected because the Tropics contain a large fraction of Earth’s surface area and are strongly influenced by natural climate variability, including phenomena like El Niño and La Niña. However, the overall long-term warming signal remains very similar between both time series. The reason is that while tropical regions have warmed substantially, many tropical ocean areas have warmed more slowly than higher-latitude regions and Northern Hemisphere land areas.
Again, this highlights an important feature of the word “global” in global warming. The increase in Earth’s average temperature is the result of widespread warming across the planet, not changes confined to any single region.
Finally, I compare the effects of excluding these regions in terms of their differences from the full global mean surface temperature record (all latitudes) in the graph on the right. Here, we can see some really interesting features. First, it is clear that the effect of excluding the Tropics is larger than excluding the Arctic when calculating global temperature anomalies. This is not surprising given that the Tropics cover a much larger fraction of Earth’s surface area. Second, we can see that when Arctic warming is strongest, including the Arctic slightly increases the global temperature anomaly. This signal becomes especially apparent in recent decades as Arctic amplification strengthens, though similar features can also be seen during earlier periods of enhanced Arctic warming during the early 20th century. Third, for the Tropics, we see much larger year-to-year variations, as well as a long-term decrease in this difference calculation. While the Tropics have warmed substantially over the historical record, the rate of warming has been slower than in many extratropical regions, especially over land. This is related to physical processes such as the large ocean fraction of the Tropics, ocean heat uptake, evaporative cooling, lapse rate effects, cloud feedbacks, and atmospheric convective processes that all influence tropical surface temperatures. As a result, including the Tropics slightly lowers the calculated global temperature anomaly compared with a globe weighted toward faster-warming regions. Of course, this does not mean that warming in the tropical oceans is unimportant. Tropical regions play a critical role in the climate system, including in ocean heat storage, atmospheric circulation, teleconnections, and overall global climate variability.
There certainly are many more complex and technical ways to investigate how different regions contribute to changes in global mean temperature, including approaches that separate the effects of different climate forcings and feedbacks. However, I think this simple analysis is quite illuminating for understanding how our planet is warming across different regions. Global warming is exactly that: a change in the average temperature of the entire planet, shaped by warming patterns across all regions. Similar types of analysis have been done for looking at whether cities are biasing temperature records (short answer: no). Next, I’ll briefly summarize conditions across the Arctic over the last month, especially since we are already past the midway point of the sea ice melt season.
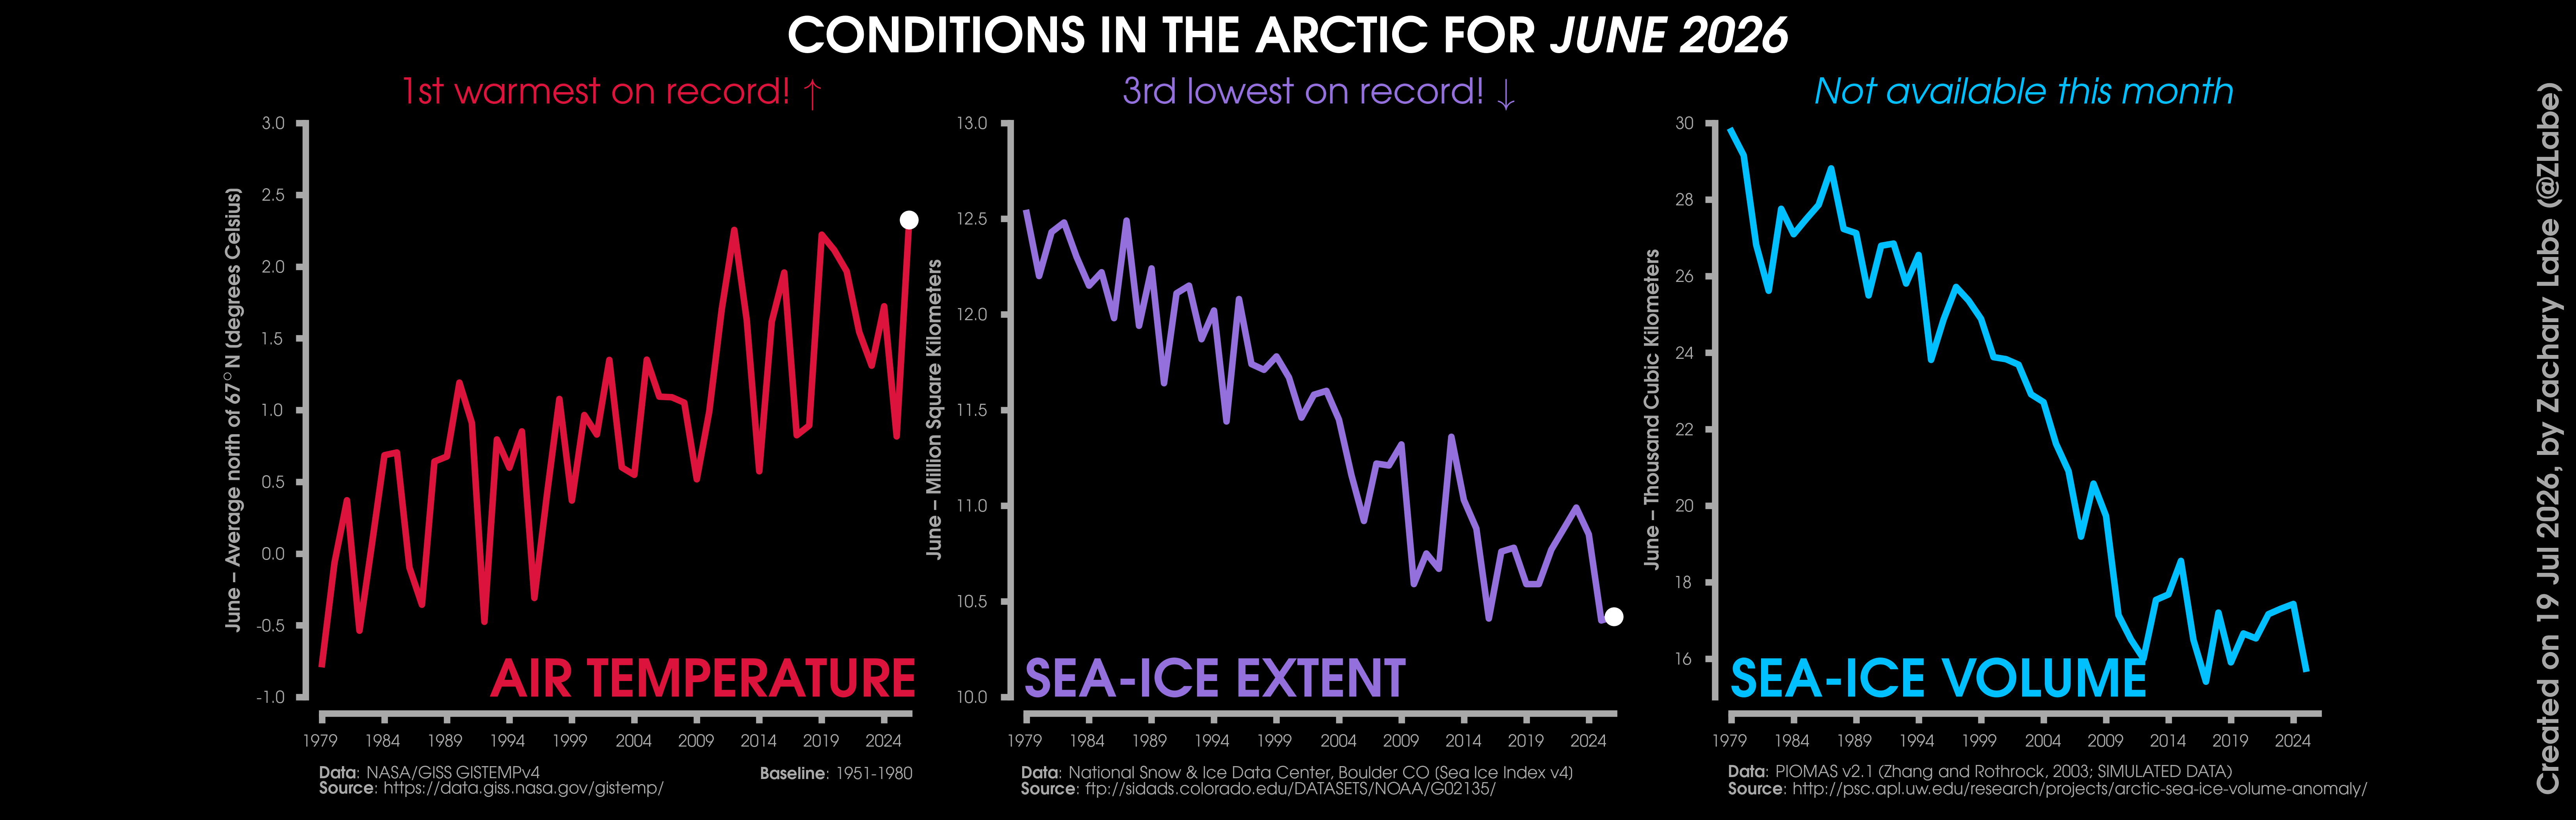
Changes in mean surface air temperature anomalies (GISTEMPv4; 1951-1980 baseline), mean Arctic sea ice extent (NSIDC; Sea Ice Index v4), and mean Arctic sea ice volume (PIOMAS v2.1; Zhang and Rothrock, 2003) over the satellite era. Updated 7/19/2026.
For lack of a better word, it’s been a really weird couple of months in the Arctic. There has been an unusually sharp contrast in both sea-ice conditions and surface air temperatures across the Arctic Circle. On one hand, temperatures have been much colder than average in the northernmost parts of the region, especially north of 75°N latitude. These colder conditions have helped maintain higher sea-ice concentrations across parts of the Beaufort Sea and northern Canadian Arctic Archipelago. The spatial pattern of sea-ice departures is quite similar. Following the earliest melt-out on record across the Barents Sea (see my earlier blog), sea ice remains exceptionally low on the Atlantic side of the Arctic. In contrast, sea-ice extent in the Beaufort and Chukchi Seas is among the highest observed for this time of year in the satellite record. Sea surface temperatures are also cooler than average in areas where sea ice has already retreated across these two basins. Altogether, this has created a very strong regional divide across the Arctic Circle. Despite these colder air temperature anomalies in parts of the Arctic during June, some datasets, including GISTEMPv4 and NOAAGlobalTempv6.1, showed that the Arctic as a whole experienced its warmest June on record. This warmth was especially pronounced (record heat) across western Siberia and the central Canadian Arctic Archipelago.
As always, the Arctic climate story is a complex one, and regional variability is critical for understanding the rapid changes occurring across the region. Given the unusually large amount of sea ice remaining on the Pacific side of the Arctic this summer, a new record low for the September annual minimum is highly unlikely at this point. So yet again, the September record low from 2012 looks likely to stand. As a quick side note, I’ve been receiving many questions about the unusual record cold appearing in the DMI 80°N+ temperature graph(s). There are some indications that this may be related to differences or a potential bias issue in the ECMWF IFS operational model output used for that product compared with ERA5. Unfortunately, I have not had the free time needed to investigate this further. I also have not heard any updates on PIOMAS data for sea-ice thickness and volume, but if any readers have, please let me know. Overall, it is another unusual summer in the Arctic, with strong regional contrasts and plenty of extremes occurring across the region.
May 2026
Hi! And thanks for visiting! My next ‘climate viz of the month’ blog highlights a region of the Arctic that is no stranger to extreme events or climate change: the Barents Sea. In fact, this is one of the fastest-warming regions on Earth. During boreal fall, when Arctic amplification is near its seasonal peak, temperatures in parts of the Barents Sea region have warmed at rates approaching ten times the global average (see my blog here). For those not familiar with Arctic geography, the Arctic Ocean is divided into several marginal seas, and the Barents Sea lies between northern Norway and Russia. Specifically, it is located north of Scandinavia and is bordered by Novaya Zemlya to the east, Franz Josef Land to the northeast, and Svalbard to the northwest.
The Barents Sea’s location at the boundary between the Arctic and Atlantic Oceans makes it a particularly important oceanographic region where changes in ocean circulation, stratification, and sea ice all interact. It is one of the two primary gateways through which relatively warm ocean water enters the Arctic Ocean, with the other being through the Pacific via the Bering Strait. The Barents Sea is relatively shallow, with depths generally less than 300 meters, and a large volume of warm and salty Atlantic water enters through the Barents Sea Opening between northern Norway and Bear Island as an extension of the North Atlantic Current. Atlantic water also flows northward along the western coast of Svalbard through the Fram Strait. As these waters move northward, they lose heat to the atmosphere (e.g., through turbulent heat fluxes) and become transformed (density/salinity) before continuing into the Arctic Ocean (check out this overview).
One of the key drivers of the rapid warming in the Barents Sea has been increasing ocean heat transport from the Atlantic. This process, often referred to as Atlantification, broadly describes the increasing influence of warm and salty Atlantic water on Arctic Ocean properties, leading to weakened upper-ocean stratification and declining sea ice. Both changes in oceanic conditions and large-scale atmospheric circulation influence the strength of Atlantification. In fact, recent studies have demonstrated that these processes are closely coupled and contain important (multi-)decadal variability. For example, atmospheric circulation patterns such as the Arctic Oscillation and Arctic Dipole can influence the transport and distribution of Atlantic water entering the Arctic. This complexity may help explain why the long-term decline in September Arctic sea-ice extent has slowed in recent years, although this remains a very active area of research. Polyakov et al. (2023), for example, suggest that temporarily reduced ocean heat fluxes into the Arctic may have contributed to this temporary hiatus.
Along with warming of the upper ocean, additional climate feedbacks are amplifying climate change in the Barents Sea. These include the ice-albedo feedback, increased poleward transport of heat and moisture through the atmosphere, and other processes that reinforce Arctic warming. During boreal winter, the Barents Sea has experienced some of the largest declines in sea-ice extent anywhere in the Arctic, making it one of the most rapidly changing parts of the polar climate system.
The Barents Sea also contains a large fraction of the Arctic’s marginal ice zone, which marks the transition between open ocean and the pack ice farther north. The ice edge here can be highly variable throughout the year and often consists of lower sea-ice concentration. Given its relatively southern location and easier accessibility, accurately predicting sea ice conditions in this region is especially important for shipping, fisheries, and other marine activities. Conditions within the marginal ice zone can change substantially over the course of just a day as extratropical storms break apart the ice or steering flow winds push it farther north or south.
Since complicated oceanic and atmospheric factors both influence Barents Sea ice conditions, it can be difficult to attribute the primary driver of any individual sea-ice anomaly in real time. However, while this is certainly an oversimplification, I tend to think of processes like Atlantification as setting the longer-term background trend (or decadal variability), while daily/monthly atmospheric patterns often determine whether a particular season ends up with exceptionally low or relatively higher ice conditions. As I’ll discuss more below, this year’s record low sea ice in the Barents Sea has also coincided with record warm temperatures across the region during several months of 2026, adding to the long-term decline driven by human-caused climate change. Even with detailed attribution studies, though, it is nearly impossible to point to a single process responsible for a particular year’s sea-ice conditions. Now finally onto this month’s graphic…
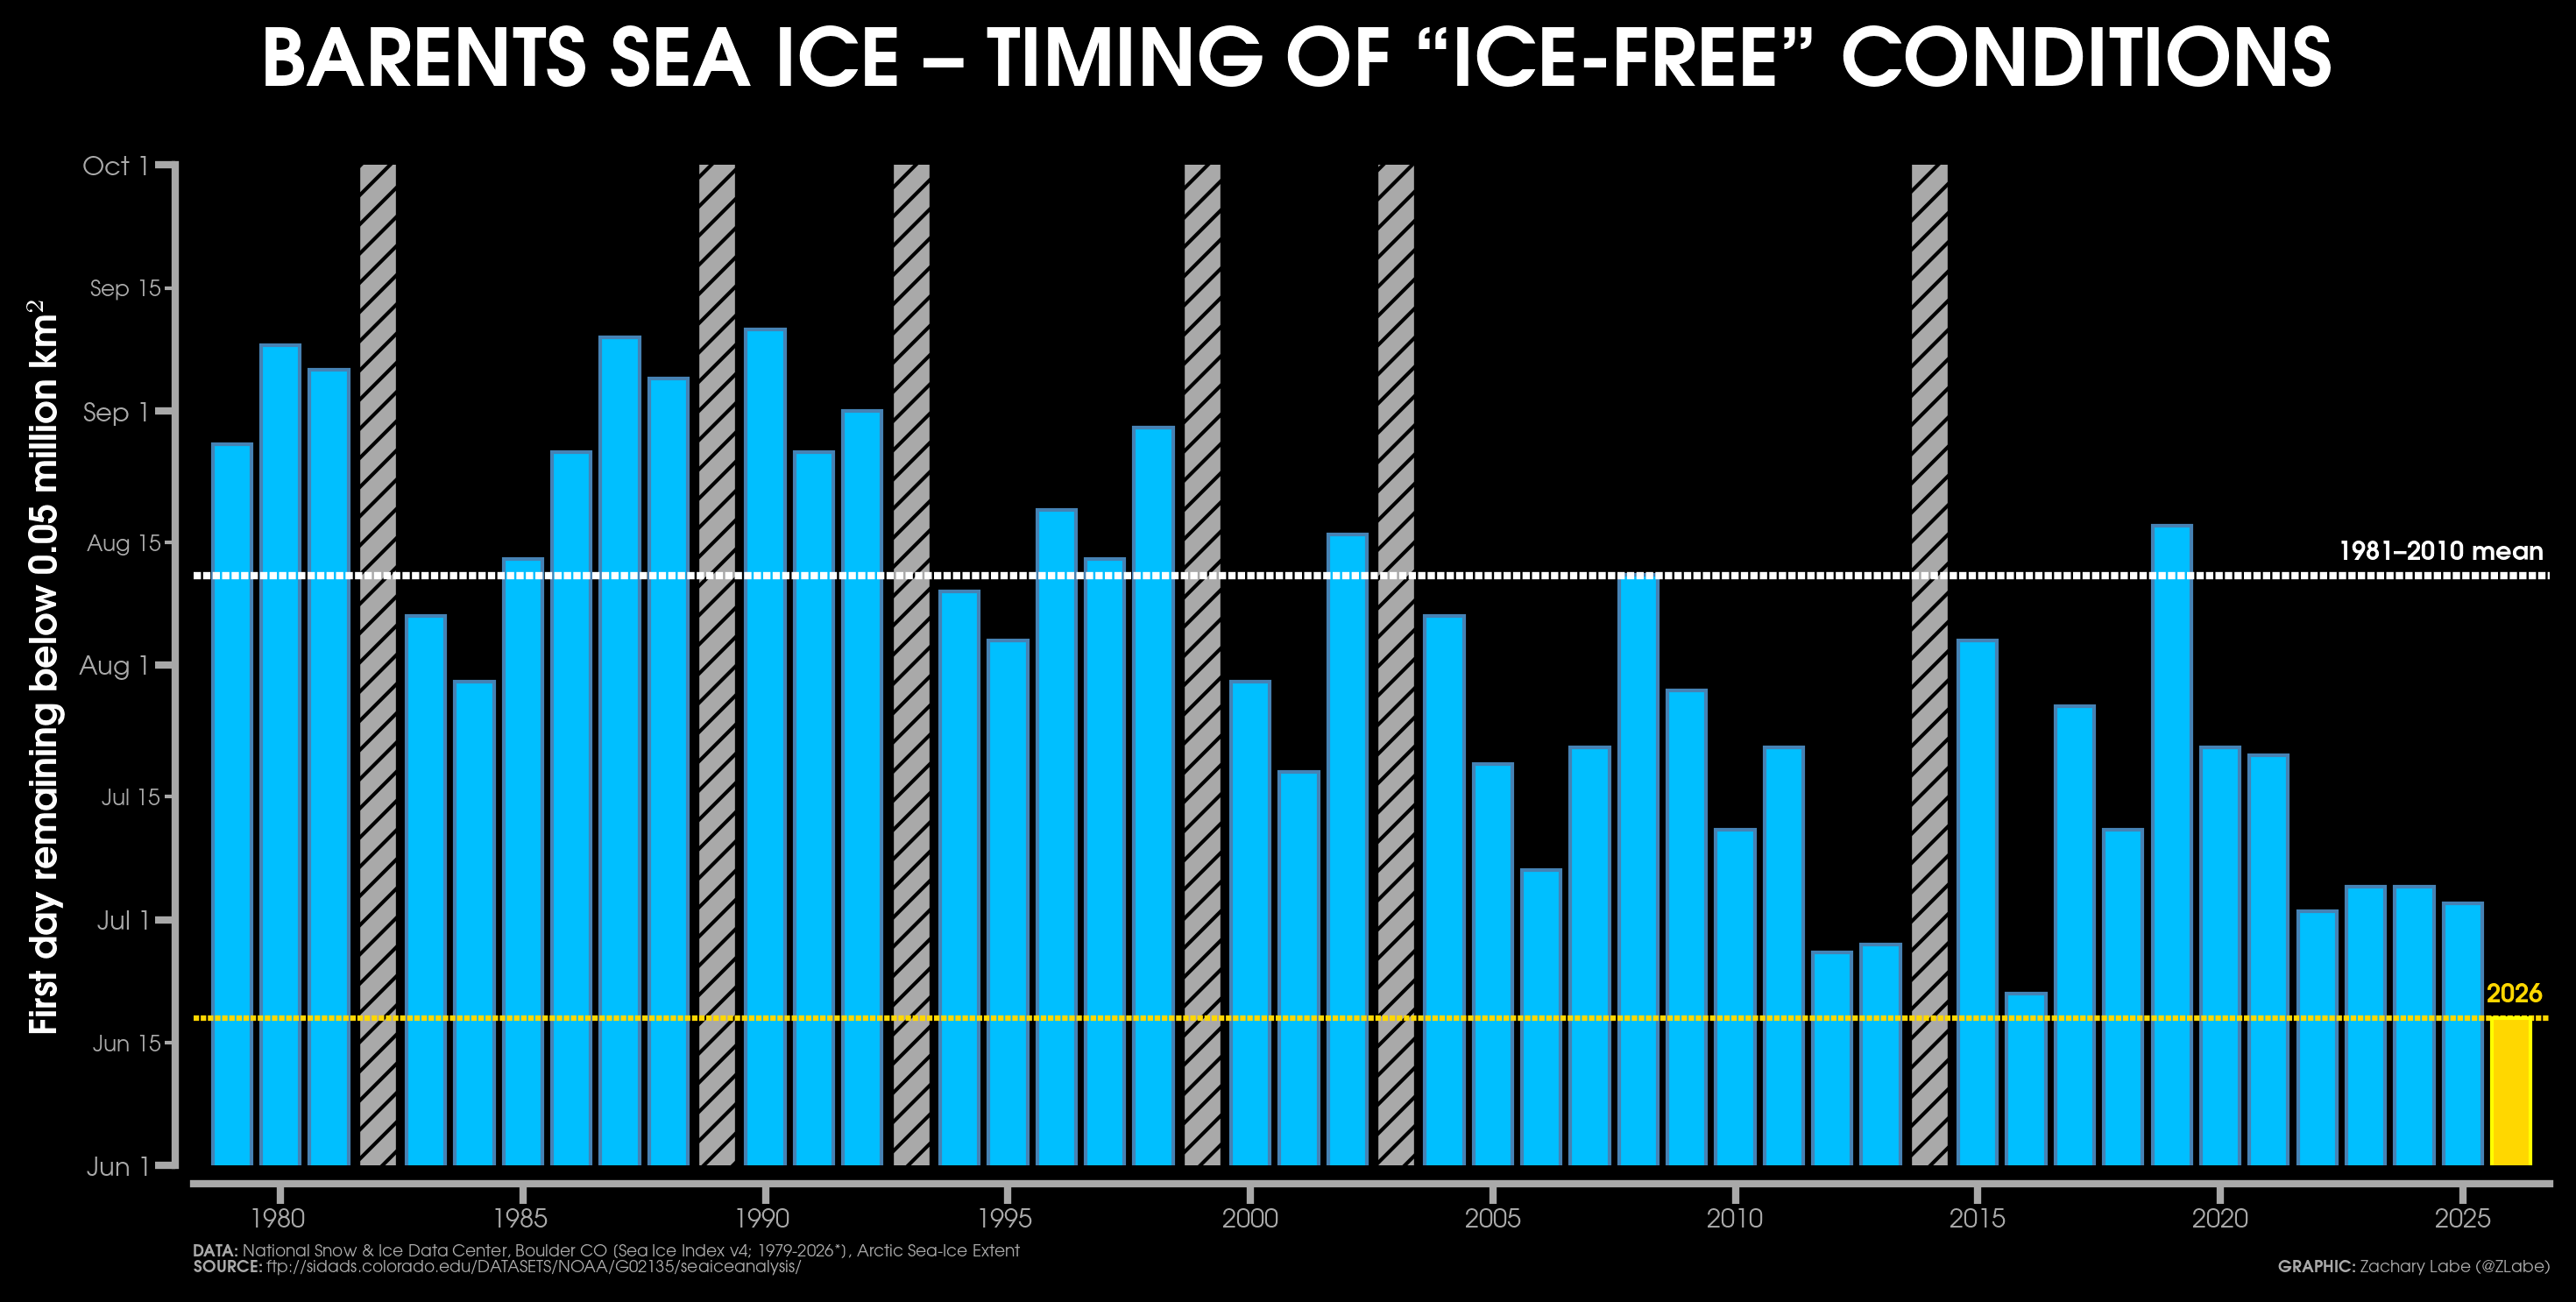
Using satellite-derived data from the National Snow and Ice Data Center (NSIDC) Sea Ice Index version 4, I computed a bar graph showing the timing of the onset of “ice-free” conditions in the Barents Sea. Here, ice-free is defined as the first date when sea-ice extent falls below 50,000 square kilometers during the melt season (boreal summer) and stays below this threshold for at least the next 7 consecutive days. For comparison, the annual maximum in recent years has averaged around 600,000 square kilometers, though it commonly exceeded 1,000,000 square kilometers back in the 1980s. There have been some years that never dropped to such a low sea-ice extent in the basin, and those are denoted by gray bars with black hatching. Looking at the 1981-2010 climatological average, this threshold has typically been reached around August 11. For reference, sea ice in the Barents Sea usually reaches its annual minimum in early to mid-September before rapidly beginning its seasonal expansion southward again by mid-October.
As you probably noticed, there is a dramatic long-term trend toward an earlier onset of these ice-free conditions. Across all years, the trend is statistically significant at about 13 days earlier per decade. Two years in particular stand out: 2016 and 2026, with this year reaching the threshold for the earliest on record (June 18). In fact, daily sea-ice extent in the Barents Sea has been at record-low levels for much of June. Note that the second-earliest year, 2016, was also the warmest year on record for air temperatures in the Barents Sea, while 2024 had the warmest average late-summer sea surface temperatures (see our annual review in the Arctic Report Card). I’ve also included an animation of daily sea-ice concentration in the region since early April, where you can see the unusually early retreat of sea ice north of Svalbard, along with the large day-to-day variability caused by changing weather conditions.
I also want to point out that this is a continuation of the extreme sea-ice conditions observed in the Barents Sea since last year. In fact, August, September, October, November, and December of 2025 all set new monthly record lows for sea-ice extent and were associated with the latest seasonal freeze-up on record. Sea ice did not begin forming across portions of the region until early December, which is truly alarming.
In summary, this month’s blog was intended to highlight another historic climate extreme emerging from the Barents Sea, which is already one of the fastest-changing regions on Earth due to human-caused climate change.
I will be closely monitoring conditions over the next few months as the region experiences an unusually extensive area of open water. As a quick side note, be sure to check out our new study from earlier in 2026, which showed that loss of sea ice in the Greenland and Barents Seas can also influence the atmospheric circulation by strengthening planetary-scale waves and shifting the jet stream. These changes can then contribute to summertime temperature anomalies in the Gulf Stream and Kuroshio-Oyashio Extension regions. Everything is connected in the Earth system!
Now for a quick summary of climate conditions elsewhere across the Arctic during the month of May…
Overall Arctic sea-ice extent averaged the 2nd lowest on record for the month of May, which was unsurprisingly mainly due to the Barents Sea anomaly, though conditions along the entire Arctic ice edge were pretty low too. For instance, current sea-ice extent in the Baffin Bay is a record low for late June. However, similar to recent years, very slow ice melt-out across the Canadian Arctic and Beaufort/Chukchi Seas has continued into June, and my guess is that this will likely yet again prevent another record low for September. As for other sea ice metrics, we sadly still don’t have any PIOMAS/GIOMAS data on ice thickness and volume (see my prior blog for more details). May 2026 temperatures were fairly unremarkable across the Arctic, with colder-than-average temperatures across the Pacific side of the Arctic, especially over the Beaufort Sea. In fact, this was the first month in a while with a slightly negative temperature anomaly near the North Pole (1981-2010 baseline), and this pattern has continued into June. In contrast, the largest warm temperature anomalies were in northwestern Siberia and well exceed 5°C above the 1981-2010 average. Otherwise, I know there are a lot of questions about what this upcoming and potentially very strong El Niño means for sea ice in the Arctic, but I will save this for another day (TLDR, it’s tricky!). Thank you for reading! My other monthly blogs since 2022 are linked below. If you’d like to support the effort behind maintaining and updating these website graphics, you can do so here: https://buymeacoffee.com/zacklabe.
April 2026
Hi! I am especially excited to share this month’s “climate viz of the month” blog, which features a graphic that has long been requested by many of my followers. For years, I’ve posted monthly and seasonal zonal mean temperature anomaly graphics as a way to visualize how temperature departures vary across latitude over time. Although these monthly versions reflect more year-to-year variability because of their shorter timescale, they still clearly reveal longer-term climate change signals, including stronger warming across the Northern Hemisphere due in part to its greater land coverage and the continued influence of Arctic amplification. While I realize these visualizations are a bit more technical, especially given the phrase “zonal mean temperature anomalies,” I think they often resonate with people because they provide a different perspective on regional climate change. I also share several other zonal-mean style graphics on my climate change indicators page that emphasize longer-term trends, but many of you have specifically asked what an animated version might look like over time.
On this rainy and cold Memorial Day weekend, I finally decided to take the time to produce this animation. This one shows zonal mean temperature anomalies for every month from January 1950 through December 2025. There are more than 900 frames, so I apologize for the fast pacing, though you can slow the playback using the video controls above. As a reminder, “zonal mean” means that temperature anomalies are averaged across all lines of longitude for each latitude band. For this visualization, I use the NASA/GISS GISTEMPv4 dataset, which is based primarily on surface temperature observations (e.g., weather stations, buoys), and I retain their standard 1951-1980 climatological baseline for calculating anomalies (x-axis). Red bars indicate warmer-than-average conditions for a given latitude band, while blue bars indicate colder-than-average. As an additional visual cue, I include a yellow line and marker highlighting the latitude band with the largest warm anomaly each month. Note that for simplicity and readability, the y-axis is shown with equal spacing by latitude rather than by true Earth surface area, which visually overemphasizes the polar regions because high-latitude bands occupy much less physical area on the globe than regions closer to the equator and tropics.
What patterns and trends do you notice? For me, there are several fascinating climate signals that immediately stand out. One obvious example is the strong tropical warming associated with the 1997-1998 El Niño event, which appears very clearly in the animation. Another striking feature is that after roughly the 2010s, there are effectively very few months where large portions of the tropical and Northern Hemisphere midlatitude bands fall below the long-term average. Arctic amplification is also incredibly apparent, with some monthly temperature anomalies extending beyond the +10°C axis limit in the figure. Other climate characteristics emerge as well, including the much greater month-to-month variability outside of the tropics and the comparatively weak long-term signal over Antarctica (at least from the perspective of this visualization). In my view, this animation is an awesome illustration of climate variability versus long-term human-caused climate change, which is one reason why I have always appreciated this latitudinal perspective for understanding the global climate system. Side note: zonal means are also widely used in atmospheric dynamics and climate model evaluation because latitude is one of the most fundamental organizing coordinates of Earth’s energy balance.
Now moving to the Arctic… The Arctic has been relatively quiet over the past month in a broad sense, but that overall signal hides substantial regional variability. April 2026 averaged among the top 10 warmest Aprils on record for the Arctic Circle region, yet this mean masks a strong spatial contrast. This included colder-than-average conditions over the Canadian Arctic Archipelago alongside much warmer-than-average anomalies across the Siberian and Atlantic sectors, in places exceeding +5°C relative to the 1981-2010 baseline. The largest warm anomalies were centered over the Barents Sea just east of Svalbard and extending into the southern Greenland Sea. In my regional Atlantic Arctic domain, April 2026 was actually the warmest April on record, continuing a sequence that follows March, which also set a record high for that region. On a related note, the freezing degree day season, which I track here as a cumulative measure of cold exposure north of 80°N latitude (defined from July 1 to June 30 and used as a simple proxy for sea ice growth conditions and atmospheric cold accumulation), is now approaching its annual reset in a few weeks. The 2025 to 2026 season currently ranks as the 2nd most anomalous on record in terms of freezing degree day deficits. In other words, it represents the second largest reduction in accumulated cold conditions compared to the historical baseline near the North Pole.
As for sea ice, we sadly still don’t have any new data on ice thickness and volume. I have not yet identified a workaround while we await further updates to the PIOMAS/GIOMAS models (see my prior blog for more details). Total Arctic sea-ice extent was quite low in April, ranking as the 2nd smallest in the satellite era for that month. Sea-ice concentration remained slightly higher than average in the eastern Bering Sea around Alaska, while conditions were much reduced along the Russian coastline. Large swaths of missing ice also persisted across the Barents Sea and Greenland Sea, as well as the Sea of Okhotsk, which has had a historically low-ice year.
The melt season is now well underway, though it is still too early to make any predictions for this year’s September minimum. This reflects the strong sensitivity of Arctic sea-ice evolution to local weather conditions. In recent years, relatively cool and cloudy summers have helped prevent the emergence of new record minimum. As I have discussed in prior blogs, this may reflect a combination of internal decadal climate variability and/or longer-term feedback processes.
March 2026
Happy spring in the Northern Hemisphere! There has been a lot to talk about lately climate-wise, from new sea-ice records to global ocean sea surface temperatures surging again to record highs, to summer-like heat across the southwestern United States, and of course, increasingly confident forecasts for a sizable El Niño later in 2026. If you are not up to date on some of these topics, I recommend scrolling back through my social media feeds… it has been a very alarming period. Anyways, this month’s ‘Climate Viz of the Month’ is a bit shorter as I catch up on some rest from last month. Here, I just wanted to quickly highlight a new visualization showing a different way the Arctic has warmed in recent years relative to a historical baseline, along with revealing the types of uncertainties present in station-based surface temperature observational datasets.
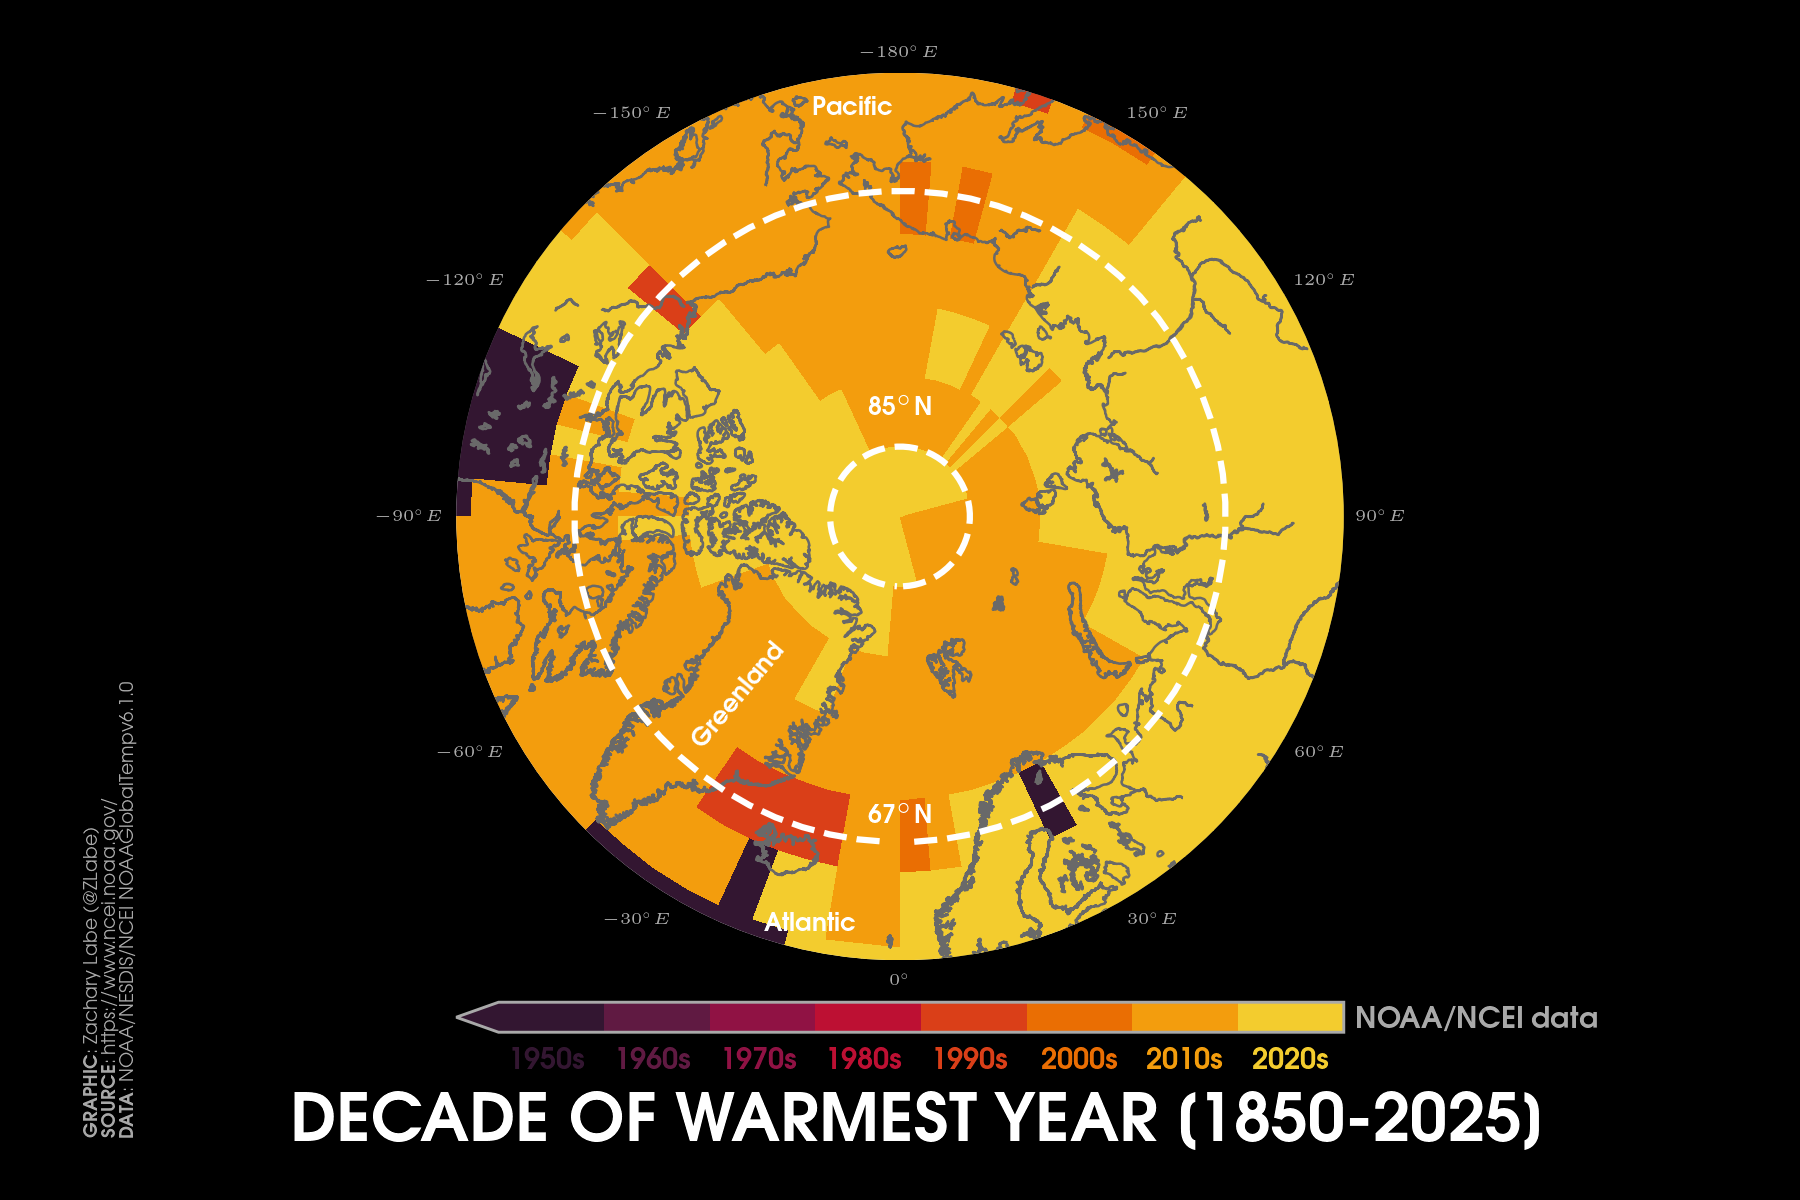
Using NOAA’s NOAAGlobalTempv6.1.0 and NASA’s GISTEMPv4 datasets, I have separately plotted the decade of the warmest annual mean temperature for every grid point on the polar stereographic map. Note that these datasets are provided on relatively coarse spatial grids, which is why the “boxes” are quite visible in the plot rather than showing smoother contours with finer spatial features. To produce this map, I considered all available years in each dataset (beginning in either 1850 or 1880), calculated annual means, and then ranked these values independently at each latitude and longitude point. Rather than go into all of the technical differences between these two observational datasets (see the Climate Data Guide for summaries: NASA vs. NOAA), it is important to note that they use different approaches for spatial interpolation and infilling, which becomes especially relevant in the polar regions where in situ observations from weather stations and buoys are sparse. I should also point out that NOAA’s product was recently updated from v6 to v6.1 this year, and not that long ago it did not even provide temperature coverage across large portions of the polar regions.
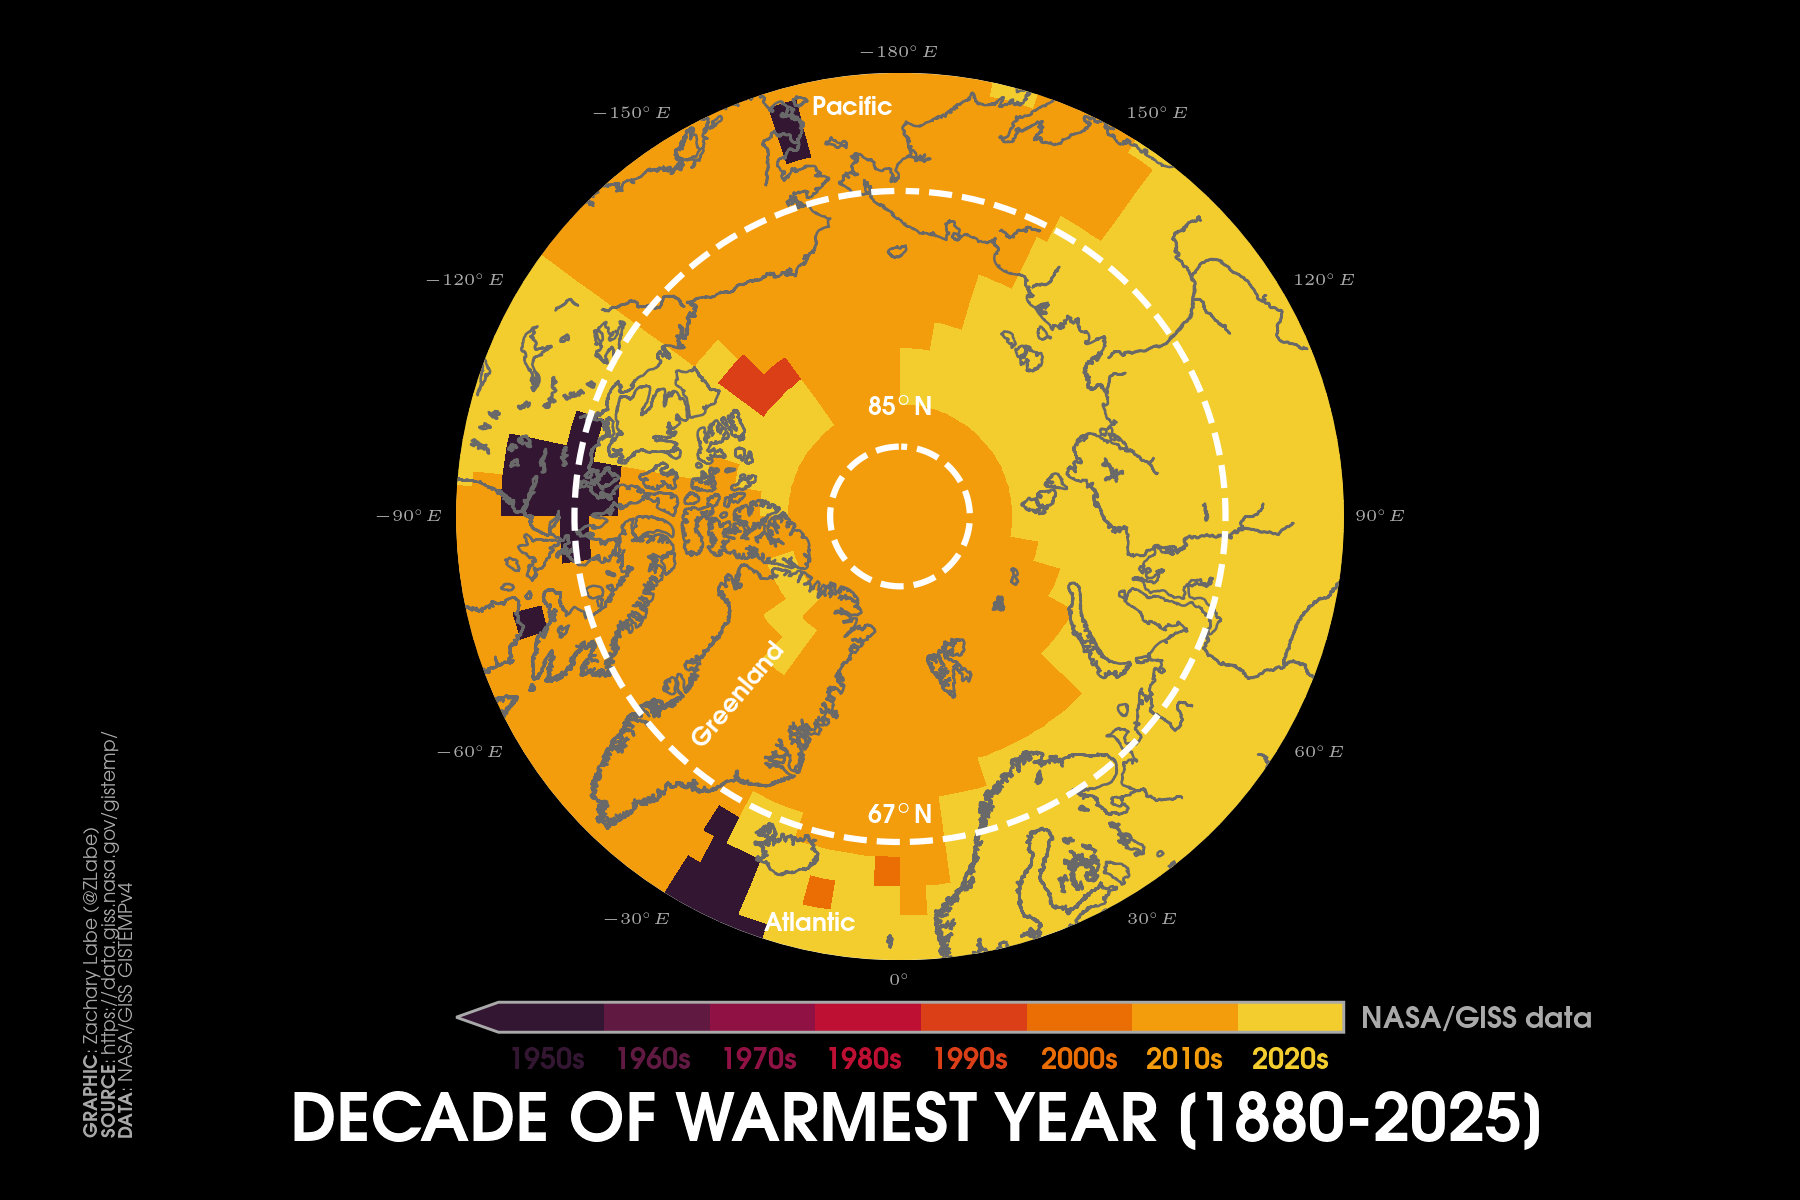
Comparing these two visualizations reveals some striking (though largely unsurprising) similarities, particularly in the broad-scale patterns of where the warmest decades have occurred. Across much of the Arctic Ocean, the warmest conditions are most often found in the 2010s, while over parts of Siberia they more frequently occur in the 2020s. There are some small differences between the datasets at individual grid points, especially near the edge of the Arctic Circle (white dashed line), reflecting differences in data input coverage and interpolation. However, the overall climate signal is clear: for nearly all locations, the warmest years on record have occurred within the past two decades, even when considering the full historical record back to the mid/late 19th century. Another key takeaway is that uncertainties in Arctic temperature estimates can be substantial, particularly in data-sparse regions, which reinforces the importance of comparing multiple datasets rather than relying on any single product (including for using atmospheric reanalysis). Continued research and sustained support are critical for maintaining and improving these observational records, especially as the Arctic continues to change rapidly. Now onto my summary of the region from last month…
March was a historic month for temperatures across the Northern Hemisphere, especially over the United States. Farther north, the pattern was also striking, with unusually sharp contrasts: record-breaking warmth over the contiguous U.S., anomalous cold over Canada and Alaska, and more anomalous warmth across the northernmost Arctic. While March 2026 certainly did not rank among the warmest Arctic-wide monthly means, there were notable regional extremes. In fact, temperatures were statistically tied for the warmest on record near the North Pole, as well as across the Barents Sea region and near Svalbard. In these areas, anomalies exceeded 5°C above the 1981-2010 average, extending from the Greenland Sea across the Arctic and into eastern Siberia. Meanwhile, temperatures were more than 5°C below average over the Kara Sea and western Siberia, along with northern land areas of North America, where monthly mean near-surface air temperatures in some locations remained below -30°C.
Arctic sea-ice extent remained unusually low and was statistically tied for the lowest on record for March. This follows the new record low for the annual maximum set earlier this year, breaking the previous record from 2025, which I discussed in last month’s blog.
Two technical notes for this month’s Arctic recap, both tied to the decommissioning of the NCEP/NCAR R1 reanalysis. One of my earliest visualizations I created (I think from back when I was in grad school) showed a ranking plot using 925 hPa temperatures from NCEP/NCAR R1 to track how warm or cold each Arctic month has been since 1979. I chose 925 hPa in part because R1 has known limitations in representing Arctic boundary layer temperatures, and because surface values can be influenced by heat flux exchanges, especially near sea-ice anomalies and around the marginal ice zone. With R1 now retired, I have transitioned this visualization to ECMWF’s ERA5 and will continue updating it in near-real time on my Arctic Temperature page. The original R1 version remains available on my website for archival purposes though. You may notice some differences in exact rankings between ERA5 and R1, which is expected given improvements in data assimilation and reanalysis-model physics, along with persistent observational gaps in the Arctic, such as the limited radiosonde coverage. Despite this, the agreement is better than I expected, and the long-term warming patterns are very similar.
Finally, we are still missing an update from PIOMAS this month for Arctic sea-ice thickness and volume (and GIOMAS for the Antarctic). I have not yet identified a workaround while we await further updates to the model (see last month’s blog for more details). In addition, the merged satellite-derived product from CryoSat-2/Sentinel-3/SMOS has issued its final thickness update for the season and will resume in the fall. Even so, all available evidence suggests that mean Arctic sea-ice thickness remains near historic lows.
February 2026
It’s time for my next “climate viz of the month” blog, but first some unfortunate news. The widely used Pan-Arctic Ice-Ocean Modeling and Assimilation System (PIOMAS; Zhang and Rothrock, 2003) will be pausing in the short term. The reason is that NOAA NWS/NCEP has terminated production of the NCEP/NCAR Reanalysis 1 (R1) as of 18 March 2026 (see notice), which is a key input for PIOMAS.
So why is this important? PIOMAS is an ice-ocean model, meaning it does not include an atmosphere. Instead, it reads in atmospheric information such as surface winds, air temperature, and cloud cover fraction, along with sea surface temperatures, from R1. While it is true that R1 is quite old and will be replaced by newer reanalysis products like CORe, PIOMAS was specifically tuned and calibrated using R1. That matters, as changing the atmospheric forcing is not a simple swap and can influence simulated sea-ice thickness and volume trends (see this study). This means there will be a significant amount of work required to re-calibrate PIOMAS for a different reanalysis product.
And why does this matter? PIOMAS is the only dataset that provides a temporally and spatially complete record of Arctic sea-ice thickness and volume since January 1979 (to my knowledge). There are other modeled products, including those from the Danish Meteorological Institute, as well as satellite observations, but they do not provide a long enough or consistent record to fully capture climate change trends (check out this comparison together we put together). Satellite altimetry products are also more limited in summer because melt ponds interfere with thickness retrievals (though this might be changing). PIOMAS has been widely evaluated, including in my own research, and is one of the go-to datasets in polar climate science. Even a temporary pause is a big loss.
This all creates a gap in one of the most physically meaningful indicators of Arctic climate change: sea-ice volume. It also comes at a time when Arctic sea-ice volume has been near record lows, with especially thin ice in parts of the central Arctic and near the North Pole. I also expect that GIOMAS may be affected given its reliance on similar atmospheric forcing, though I have not yet seen any official notice (I sent an email to follow-up). This will also affect my Antarctic/Global sea-ice volume graphics. It is a frustrating situation. At a time when we should be expanding and refining long-term climate data records, we are instead facing more challenges, especially due to limited funding and institutional support. Hopefully there is a clear path forward soon. I will also do my best to explore alternative sources and develop new graphics for continued real-time monitoring of sea-ice thickness and volume on my website, though this will take some time to fully assess their strengths and limitations. Stay tuned.
Now that I have shared that we are losing a key dataset for Arctic sea ice, I also want to highlight where things currently stand. The annual maximum Arctic sea-ice extent reached another record low this year, effectively tied with the previous record set just last year. The maximum occurred on 15 March 2026 at 14.29 million square kilometers (5.52 million square miles) (NSIDC Sea Ice Index v4 data). 2025 was at 14.31 million square kilometers (5.53 million square miles). This is about 1.3 million square kilometers (500,000 square miles) below the 1981 to 2010 climatological average. The timing was close to normal. The average date of the maximum over 1981 to 2010 is March 12.
It is also important to remember that these records begin in 1979, with the start of the temporally- and spatially-consistent passive microwave satellite observations. Within that record, the past two winters now stand out for the lowest annual maximum extents.
My special visualization for this month shows changes in daily Arctic sea-ice concentration from 1 January 2026 through late March, using the high-resolution (about 3 km) AMSR2 satellite product. You may notice some artifacts along coastlines, where the satellite can falsely detect sea ice. These are common and can mostly be ignored. The fast pace of my animation is intentional. It highlights the day-to-day growth and variability that define an Arctic winter. I have also included a second animation showing the long-term changes in the annual maximum extent from 1979 to 2026. The downward trend is obvious.
Overall, this winter has been particularly concerning across the Arctic. Sea ice remained unusually low for much of the season, and in many periods tracked at or near daily record lows for the time of year.
While the final maximum is now in, the broader winter context still stands out. Conditions were especially poor across several regions, including the Sea of Okhotsk, Baffin Bay, Labrador Sea, Barents Sea, and Kara Sea, where sea-ice extent remained persistently below average. The Sea of Okhotsk in particular saw one of the smallest maximum extents on record for that region and stands out as a major outlier compared to any other year in the satellite record as of late March. One of the few exceptions was the eastern Bering Sea near Alaska, which saw higher ice coverage compared to average, particularly over the past month when ice extent reached its farthest southward position in several years.
The thickness and volume story has been just as concerning. Based on PIOMAS, sea ice north of Greenland has been more than 2 meters thinner than average in places. Ice near the North Pole has also been at or near record-low thickness now for several months. In February, total Arctic sea-ice volume ranked as the second lowest on record.
Taken together, the Arctic is entering late winter in one of its weakest states in the satellite era. As I say every year at this point, it is still too early to say what this will mean for the summer melt season, since regional weather patterns can shift quickly. But winter 2025 to 2026 is another clear signal of how rapidly the Arctic is changing. Human-caused climate change is continuing to reshape the polar environment, with growing impacts near and far. While it seems like natural climate variability has temporarily offset some of the long-term trend for September Arctic sea ice (around the annual minimum), recent winter conditions show a more steady decline. Given that the Arctic Ocean is ice-covered in winter (and will continue to be well into the future), the declines are happening around the outer margins of the region.
This winter also featured notable temperature variability and extremes. Greenland experienced record warmth in January, followed by a sharp shift to much colder than average conditions in February across the area and parts of northern Canada. Across the Arctic, lower tropospheric temperatures (925 hPa) ranked as the 2nd warmest on record in January but dropped to around the 30th warmest in February. Near-surface air temperatures told a similar story, with February ranking 31st warmest. So while February seemed relatively cold compared to recent years, it does not offset the broader warmth. Looking more closely at cumulative cold, total freezing degree day anomalies across the high Arctic (north of 80°N) show one of the largest negative deviations on record within my tracking period (which began in July 2025 and uses a July to June year). This highlights the overall lack of sustained cold recently across the northernmost parts of the planet, even with short-term variability like in February.
That’s all for now – thanks for reading! You can find archives of my past blogs listed below. If you would like to support this website, you can also find a Buy Me a Coffee page: https://buymeacoffee.com/zacklabe.
January 2026
Hi all! Sorry for the delay in posting my first blog of the year. I’ve been spending a lot of time updating my visualizations with data through 2025 (and in some cases 2026). This means downloading and processing each dataset again and then manually updating the code and fine-tuning the figures. Maybe one of these years I’ll find a quicker way to roll everything into a new year… At this point, almost everything on my website should be up-to-date, aside from one or two remaining datasets needed for my reanalysis comparisons. If you notice any issues or typos, please let me know. I’m also in the process of adding alt text to my long-term visualizations (those updated monthly or yearly), which should help improve accessibility on these pages – thanks for your patience while I work through them.
With that said, here is a quick entry for January. As a reminder, these posts are always a bit lagged since I also summarize recent monthly conditions in the Arctic. I’m aiming to have the “February” post up by the end of this month.
My current entry features an animation showing monthly mean snow depth from the ERA5‑Land reanalysis during 2025 (January through December). This dataset is closely related to the standard ERA5 reanalysis produced by ECMWF, but it focuses specifically on land surface conditions at a higher spatial resolution of 0.1° by 0.1° (latitude by longitude) (~9 km). That finer grid helps better resolve coastlines, topography, and other important land surface characteristics. I’m using a sequential color scheme here (“bone” from matplotlib), with the scale saturating at 0.5 meters to emphasize variability at lower latitudes where snow depths are generally much smaller compared with places like the Greenland Ice Sheet and the Antarctic Ice Sheet. I also intentionally reduced the contrast for continents and coastlines, so the focus stays on the seasonal cycle of snowpack, particularly the differences between the Northern and Southern Hemispheres. There are also some interesting regions where snow persists year-round outside of the major ice sheets, though you can still see summer melt even across parts of western Greenland. Keep in mind that this shows monthly means, so it does not capture short-lived synoptic events where snowfall may have occurred for only a day or two.
I always enjoy visualizations that highlight the seasonality of meteorological and climatological variables, since so much can be explained by Earth’s axial tilt and the distribution of land versus ocean between the hemispheres. Snow cover plays an important role in the climate system because of its high albedo (reflectivity), meaning it reflects a large fraction of incoming sunlight back to space. Snow also strongly influences local weather and climate conditions, including boundary layer temperatures like through cold air damming events or nighttime radiational cooling. The amount of water stored in the snowpack (often measured as snow water equivalent) is critical for millions of people because it acts as a natural freshwater reservoir that feeds rivers used for drinking water and irrigation. It also supports ecosystems by influencing soil moisture, vegetation health, and the timing of plant growth.
However, human-caused climate change is reducing snow cover in many regions of the world. The largest declines occur during Northern Hemisphere spring, with substantial losses across Eurasia and North America by June as warmer temperatures lead to earlier melt. This reduction contributes to further Arctic amplification through the snow‑ice‑albedo feedback, where the loss of bright snow exposes darker land surfaces that absorb more sunlight. In mountainous regions, declining snowpack at higher elevations also reduces water availability later in the year and can leave landscapes drier and more susceptible to wildfire. Recent examples include the extreme warmth and early snowmelt that contributed to widespread wildfires across Siberia in 2020 and in Canada in 2023. Overall, understanding the seasonality, variability, and long-term trends in snow is an important part of monitoring changes across the climate system.
For January 2025, conditions across the Arctic featured unusually warm temperatures and very low sea ice, including low values for total extent, thickness, and volume. Some of the largest temperature anomalies occurred across eastern Siberia, the Canadian Arctic Archipelago, and the Barents Sea region. In fact, temperatures reached record-high levels across large portions of Greenland, especially along the western coast, with departures exceeding 5 °C above the 1981–2010 average. These conditions were partly linked to the large-scale atmospheric circulation, including a persistent blocking pattern and the associated phase of the N(AO). At the same time, temperatures were much colder than average across parts of western Alaska, western Siberia, and over Scandinavia. Sea ice has remained very low this winter, with numerous new daily record lows during the freeze season. The average sea-ice thickness near the North Pole also continues to reach record-low levels according to PIOMAS. The annual maximum sea-ice extent will likely occur soon, although it is still a bit early to predict its final ranking. That said, it will probably end up within the ten lowest maximum extents in the observational record.
Other Blogs (Monthly):
My visualizations:
The views presented here only reflect my own. These figures may be freely distributed (with credit). Information about the data can be found on my references page and methods page.