June 2026
Hi there! This month’s “climate viz of the month” blog will be a shorter one and takes a look at a pretty simple but often misunderstood concept: how regional warming influences the global average temperature record. For this analysis, I am using NASA’s GISTEMPv4 dataset and focusing on annual mean temperatures. The dataset extends from 1880 to present and is based on surface temperature observations from weather stations, buoys, and ships (gridded land and ocean regions). GISTEMP also uses a statistical spatial analysis approach to estimate temperature changes in areas with limited observations. For the analysis here, I am using their standard 1951–1980 climatological baseline (see their FAQ here for more details on why this period is used).
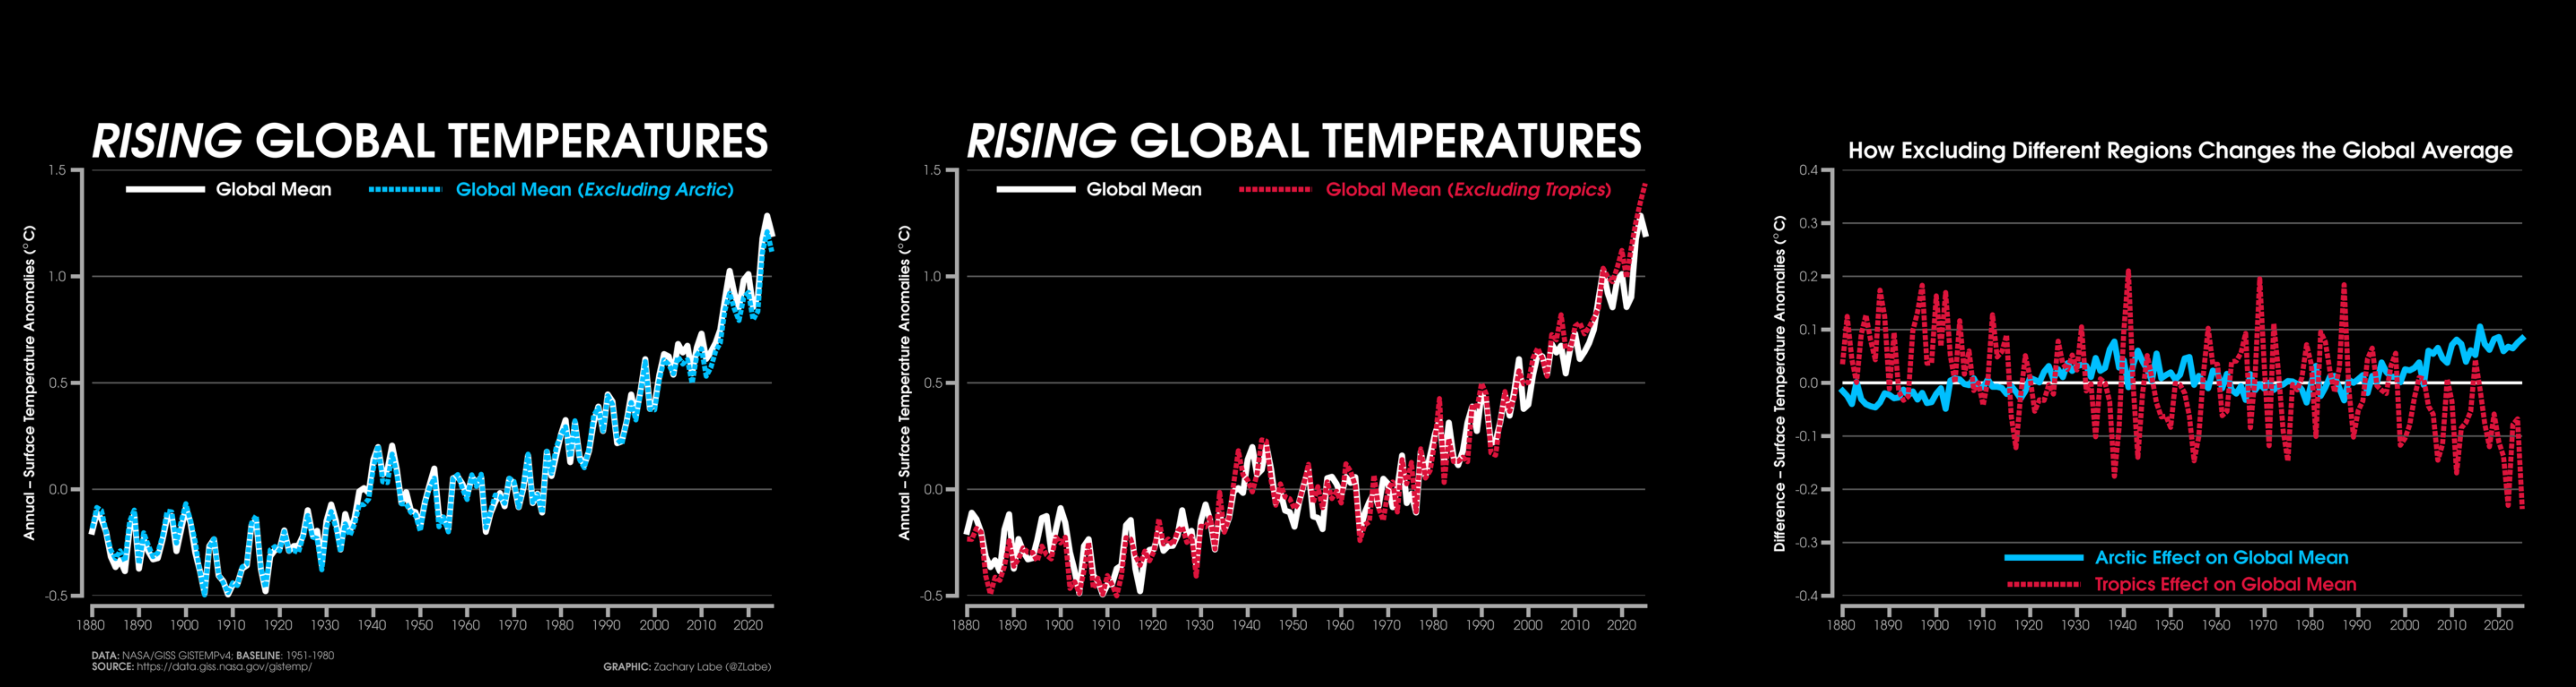
The purpose of this blog is to quantitatively examine a climate misconception that I sometimes see shared: that the rapid warming of the Arctic is the reason the global mean temperature time series is increasing. While Arctic amplification is one of the most prominent signals of human-caused climate change, the Arctic only covers about 4% of Earth’s surface area. To explore how much this region influences the global average, I first calculated the standard global mean surface temperature record and then recalculated it while excluding the Arctic (defined here as areas north of 66.5°N latitude). Note that I use cosine-weighted averages throughout the analysis to account for the fact that Earth is a sphere and grid cells in the dataset represent different surface areas at different latitudes. Here, we can see that even without including the rapidly warming Arctic, the global temperature record has a very similar structure in both its short- and long-term warming trends and year-to-year variability. The two lines remain nearly identical throughout most of the record, with a small divergence maybe beginning to emerge in recent decades as Arctic amplification strengthens. Since the Arctic is warming much faster than the global average, including it does slightly increase the calculated global temperature anomaly, but this effect is relatively small because of its limited area. Ultimately, the rise in global mean temperature is not a result of including the Arctic in the calculation. Instead, it reflects widespread warming across the planet, with the Arctic representing one of the strongest regional responses to that overall change in radiative forcing.
Now let’s look at the effect of another region on the global average temperature record: the Tropics, which represent the largest single latitude band on Earth and cover approximately 40% of the planet’s surface area. For this exercise, I am performing the same type of analysis. First, I calculate the standard global mean surface temperature record including all latitudes. Then, I calculate a second global mean temperature time series using only areas outside of the Tropics (23.5°S-23.5°N). Here, we can see that excluding the Tropics has a somewhat larger influence on the global temperature record than excluding the Arctic, particularly in terms of interannual variability and some short-term trends. This is expected because the Tropics contain a large fraction of Earth’s surface area and are strongly influenced by natural climate variability, including phenomena like El Niño and La Niña. However, the overall long-term warming signal remains very similar between both time series. The reason is that while tropical regions have warmed substantially, many tropical ocean areas have warmed more slowly than higher-latitude regions and Northern Hemisphere land areas.
Again, this highlights an important feature of the word “global” in global warming. The increase in Earth’s average temperature is the result of widespread warming across the planet, not changes confined to any single region.
Finally, I compare the effects of excluding these regions in terms of their differences from the full global mean surface temperature record (all latitudes) in the graph on the right. Here, we can see some really interesting features. First, it is clear that the effect of excluding the Tropics is larger than excluding the Arctic when calculating global temperature anomalies. This is not surprising given that the Tropics cover a much larger fraction of Earth’s surface area. Second, we can see that when Arctic warming is strongest, including the Arctic slightly increases the global temperature anomaly. This signal becomes especially apparent in recent decades as Arctic amplification strengthens, though similar features can also be seen during earlier periods of enhanced Arctic warming during the early 20th century. Third, for the Tropics, we see much larger year-to-year variations, as well as a long-term decrease in this difference calculation. While the Tropics have warmed substantially over the historical record, the rate of warming has been slower than in many extratropical regions, especially over land. This is related to physical processes such as the large ocean fraction of the Tropics, ocean heat uptake, evaporative cooling, lapse rate effects, cloud feedbacks, and atmospheric convective processes that all influence tropical surface temperatures. As a result, including the Tropics slightly lowers the calculated global temperature anomaly compared with a globe weighted toward faster-warming regions. Of course, this does not mean that warming in the tropical oceans is unimportant. Tropical regions play a critical role in the climate system, including in ocean heat storage, atmospheric circulation, teleconnections, and overall global climate variability.
There certainly are many more complex and technical ways to investigate how different regions contribute to changes in global mean temperature, including approaches that separate the effects of different climate forcings and feedbacks. However, I think this simple analysis is quite illuminating for understanding how our planet is warming across different regions. Global warming is exactly that: a change in the average temperature of the entire planet, shaped by warming patterns across all regions. Similar types of analysis have been done for looking at whether cities are biasing temperature records (short answer: no). Next, I’ll briefly summarize conditions across the Arctic over the last month, especially since we are already past the midway point of the sea ice melt season.
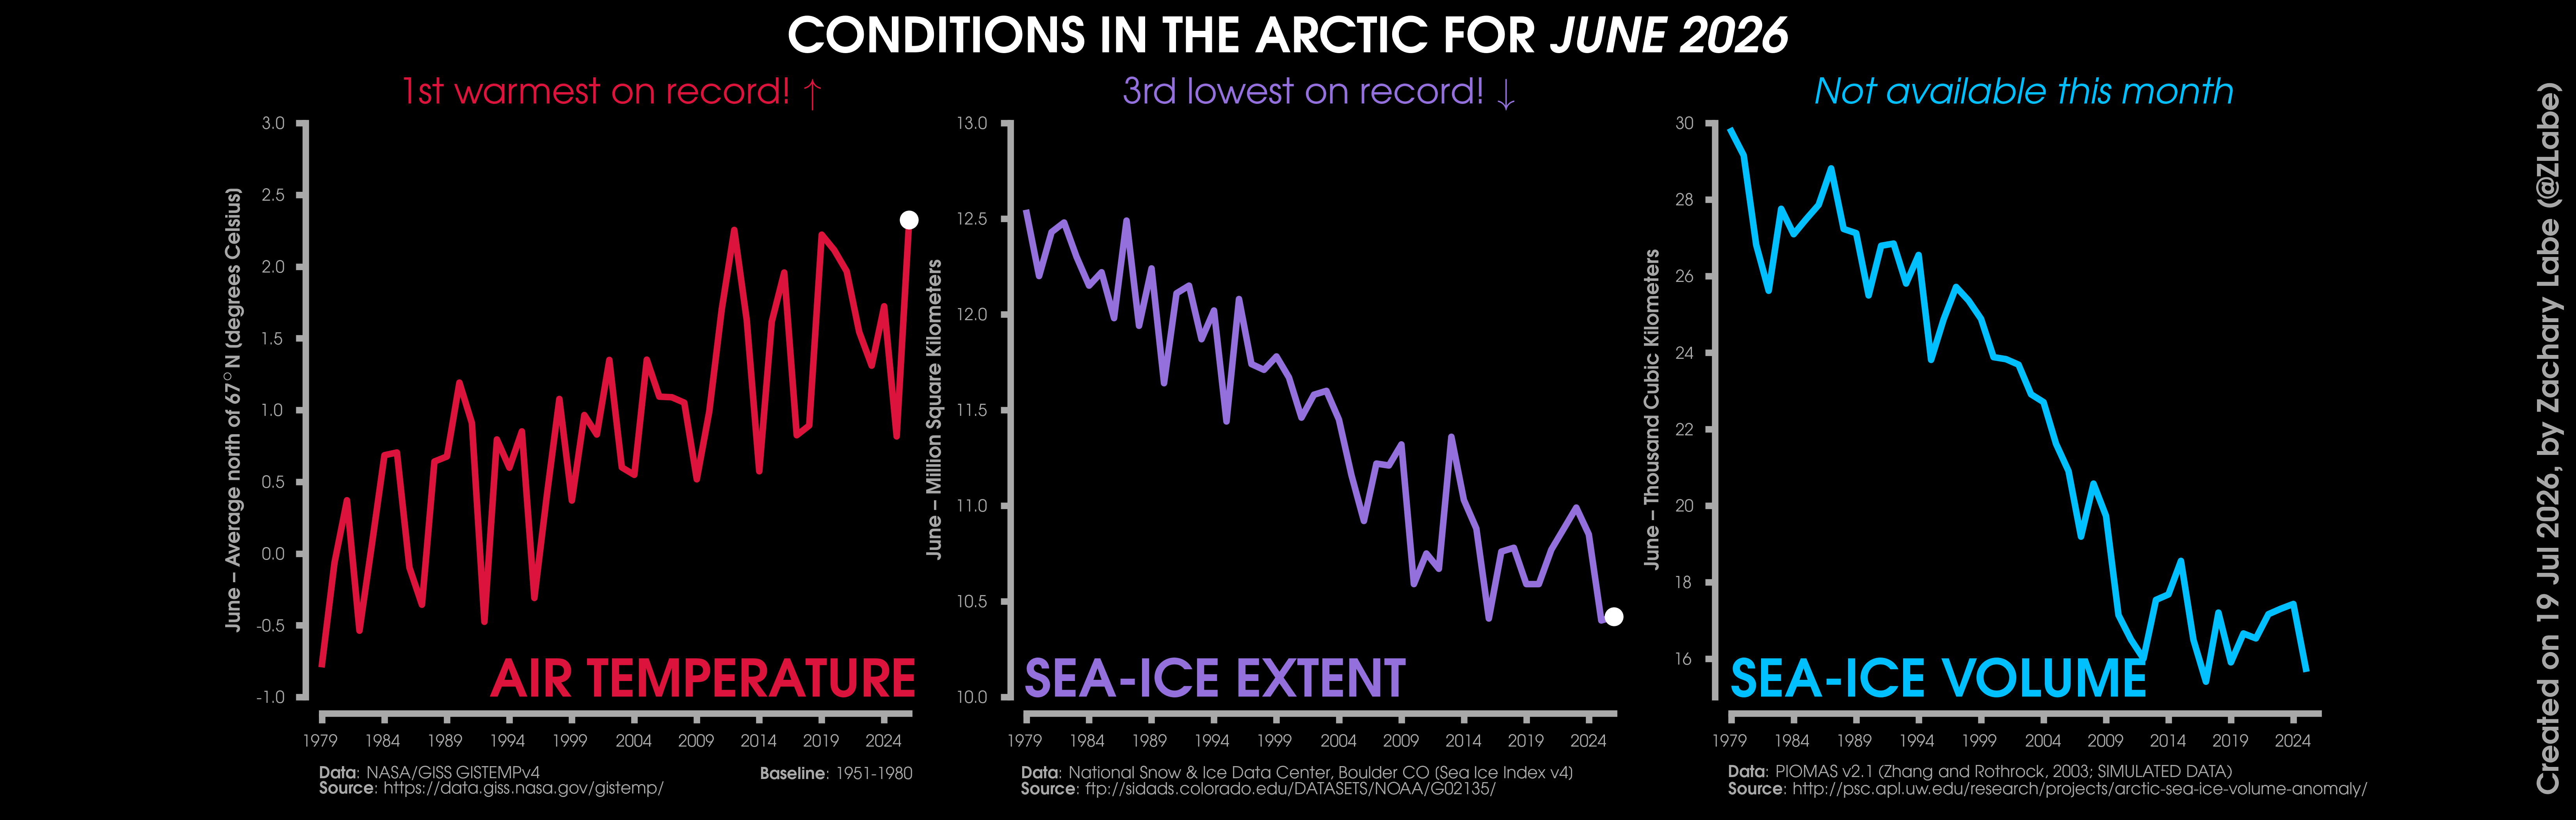
Changes in mean surface air temperature anomalies (GISTEMPv4; 1951-1980 baseline), mean Arctic sea ice extent (NSIDC; Sea Ice Index v4), and mean Arctic sea ice volume (PIOMAS v2.1; Zhang and Rothrock, 2003) over the satellite era. Updated 7/19/2026.
For lack of a better word, it’s been a really weird couple of months in the Arctic. There has been an unusually sharp contrast in both sea-ice conditions and surface air temperatures across the Arctic Circle. On one hand, temperatures have been much colder than average in the northernmost parts of the region, especially north of 75°N latitude. These colder conditions have helped maintain higher sea-ice concentrations across parts of the Beaufort Sea and northern Canadian Arctic Archipelago. The spatial pattern of sea-ice departures is quite similar. Following the earliest melt-out on record across the Barents Sea (see my earlier blog), sea ice remains exceptionally low on the Atlantic side of the Arctic. In contrast, sea-ice extent in the Beaufort and Chukchi Seas is among the highest observed for this time of year in the satellite record. Sea surface temperatures are also cooler than average in areas where sea ice has already retreated across these two basins. Altogether, this has created a very strong regional divide across the Arctic Circle. Despite these colder air temperature anomalies in parts of the Arctic during June, some datasets, including GISTEMPv4 and NOAAGlobalTempv6.1, showed that the Arctic as a whole experienced its warmest June on record. This warmth was especially pronounced (record heat) across western Siberia and the central Canadian Arctic Archipelago.
As always, the Arctic climate story is a complex one, and regional variability is critical for understanding the rapid changes occurring across the region. Given the unusually large amount of sea ice remaining on the Pacific side of the Arctic this summer, a new record low for the September annual minimum is highly unlikely at this point. So yet again, the September record low from 2012 looks likely to stand. As a quick side note, I’ve been receiving many questions about the unusual record cold appearing in the DMI 80°N+ temperature graph(s). There are some indications that this may be related to differences or a potential bias issue in the ECMWF IFS operational model output used for that product compared with ERA5. Unfortunately, I have not had the free time needed to investigate this further. I also have not heard any updates on PIOMAS data for sea-ice thickness and volume, but if any readers have, please let me know. Overall, it is another unusual summer in the Arctic, with strong regional contrasts and plenty of extremes occurring across the region.
Other Blogs (Monthly):

Other Climate Data Statistics (Monthly):
My Visualizations:
My research related to data visualization:
[2] Witt, J.K., Z.M. Labe, A.C. Warden, and B.A. Clegg (2023). Visualizing uncertainty in hurricane forecasts with animated risk trajectories. Weather, Climate, and Society, DOI:10.1175/WCAS-D-21-0173.1
[HTML][BibTeX][Code]
[Blog][Plain Language Summary][CNN]
[1] Witt, J.K., Z.M. Labe, and B.A. Clegg (2022). Comparisons of perceptions of risk for visualizations using animated risk trajectories versus cones of uncertainty. Proceedings of the Human Factors and Ergonomics Society Annual Meeting, DOI:10.1177/1071181322661308
[HTML][BibTeX][Code]
[Plain Language Summary][CNN]
The views presented here only reflect my own. These figures may be freely distributed (with credit). Information about the data can be found on my references page and methods page.