By applying nonlinear neural networks and explainable machine learning methods (e.g., layer-wise relevance propagation or integrated gradients), we aim to disentangle forced climate patterns from internal variability in observations and climate model large ensembles. In particular, we are interested in using these methods to detect biases/differences in their simulation of compound extreme events, internal variability, and forced trends in fully-coupled climate models. Explainable AI (XAI) methods can be used as a tool to understand physical mechanisms in the climate system and increase user trust in the machine learning predictions.
Applications of neural networks for identifying the forced response…
Detection of future climate scenarios
A key question for regional climate services is related to which climate change scenario is most likely to evolve over the 21st century, especially when comparing climate model projections to real-world observations. Although this can already be tracked in near real-time through indices like global mean surface temperature or greenhouse gas concentrations, it remains unclear how to attribute regional patterns of climate change to different climate scenarios or to policy-relevant thresholds like 1.5°C/2.0°C of global warming.
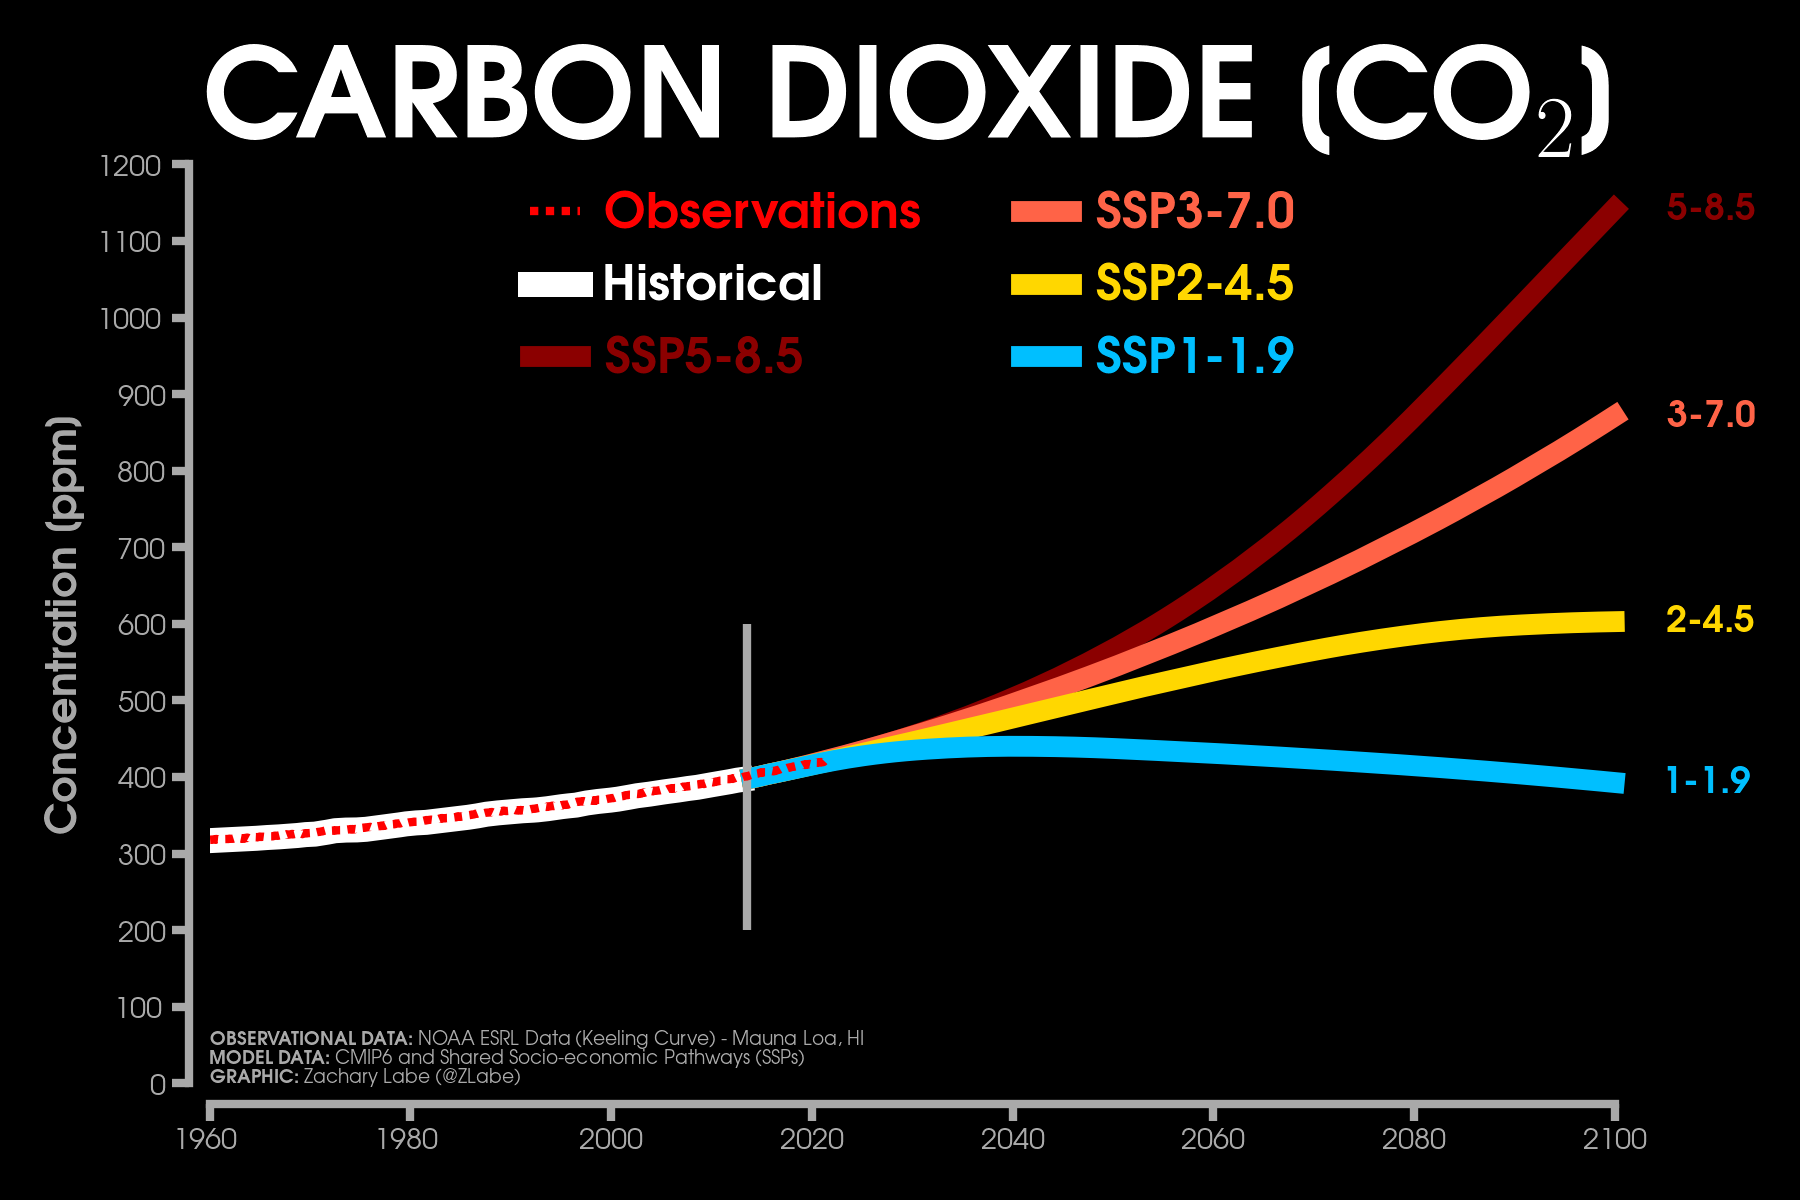
To explore this detection and attribution topic, our new study (Labe et al. 2024, JGR-MLC) evaluates a collection of simulations conducted with the NOAA/GFDL SPEAR climate model that include different climate scenarios (natural forcing, historical forcing, SSP1-1.9, SSP2-4.5, SSP5-8.5) through the year 2100. Using this data, we then introduce a new classification method to link maps of climate variables to individual climate scenarios through a machine learning technique (i.e., artificial neural networks).
As a proof of concept, we then explore possible realizations of the future under two rapid climate mitigation pathways (also referred to as overshoot scenarios (e.g., SSP5-3.4OS)). We apply explainable artificial intelligence (XAI) methods to reveal important regions of change associated with identifying the different responses to the climate mitigation efforts. For example, we find that the North Atlantic and Central Africa are important regional indicators for the neural network to learn to distinguish between different future climate scenarios when given maps of temperature or precipitation. Our results also show that starting aggressive mitigation actions a decade earlier can lead to the lowest greenhouse gas emission scenario (SSP1-1.9) (i.e. reduced climate change impacts) being predicted by the neural network model at the end of the century.
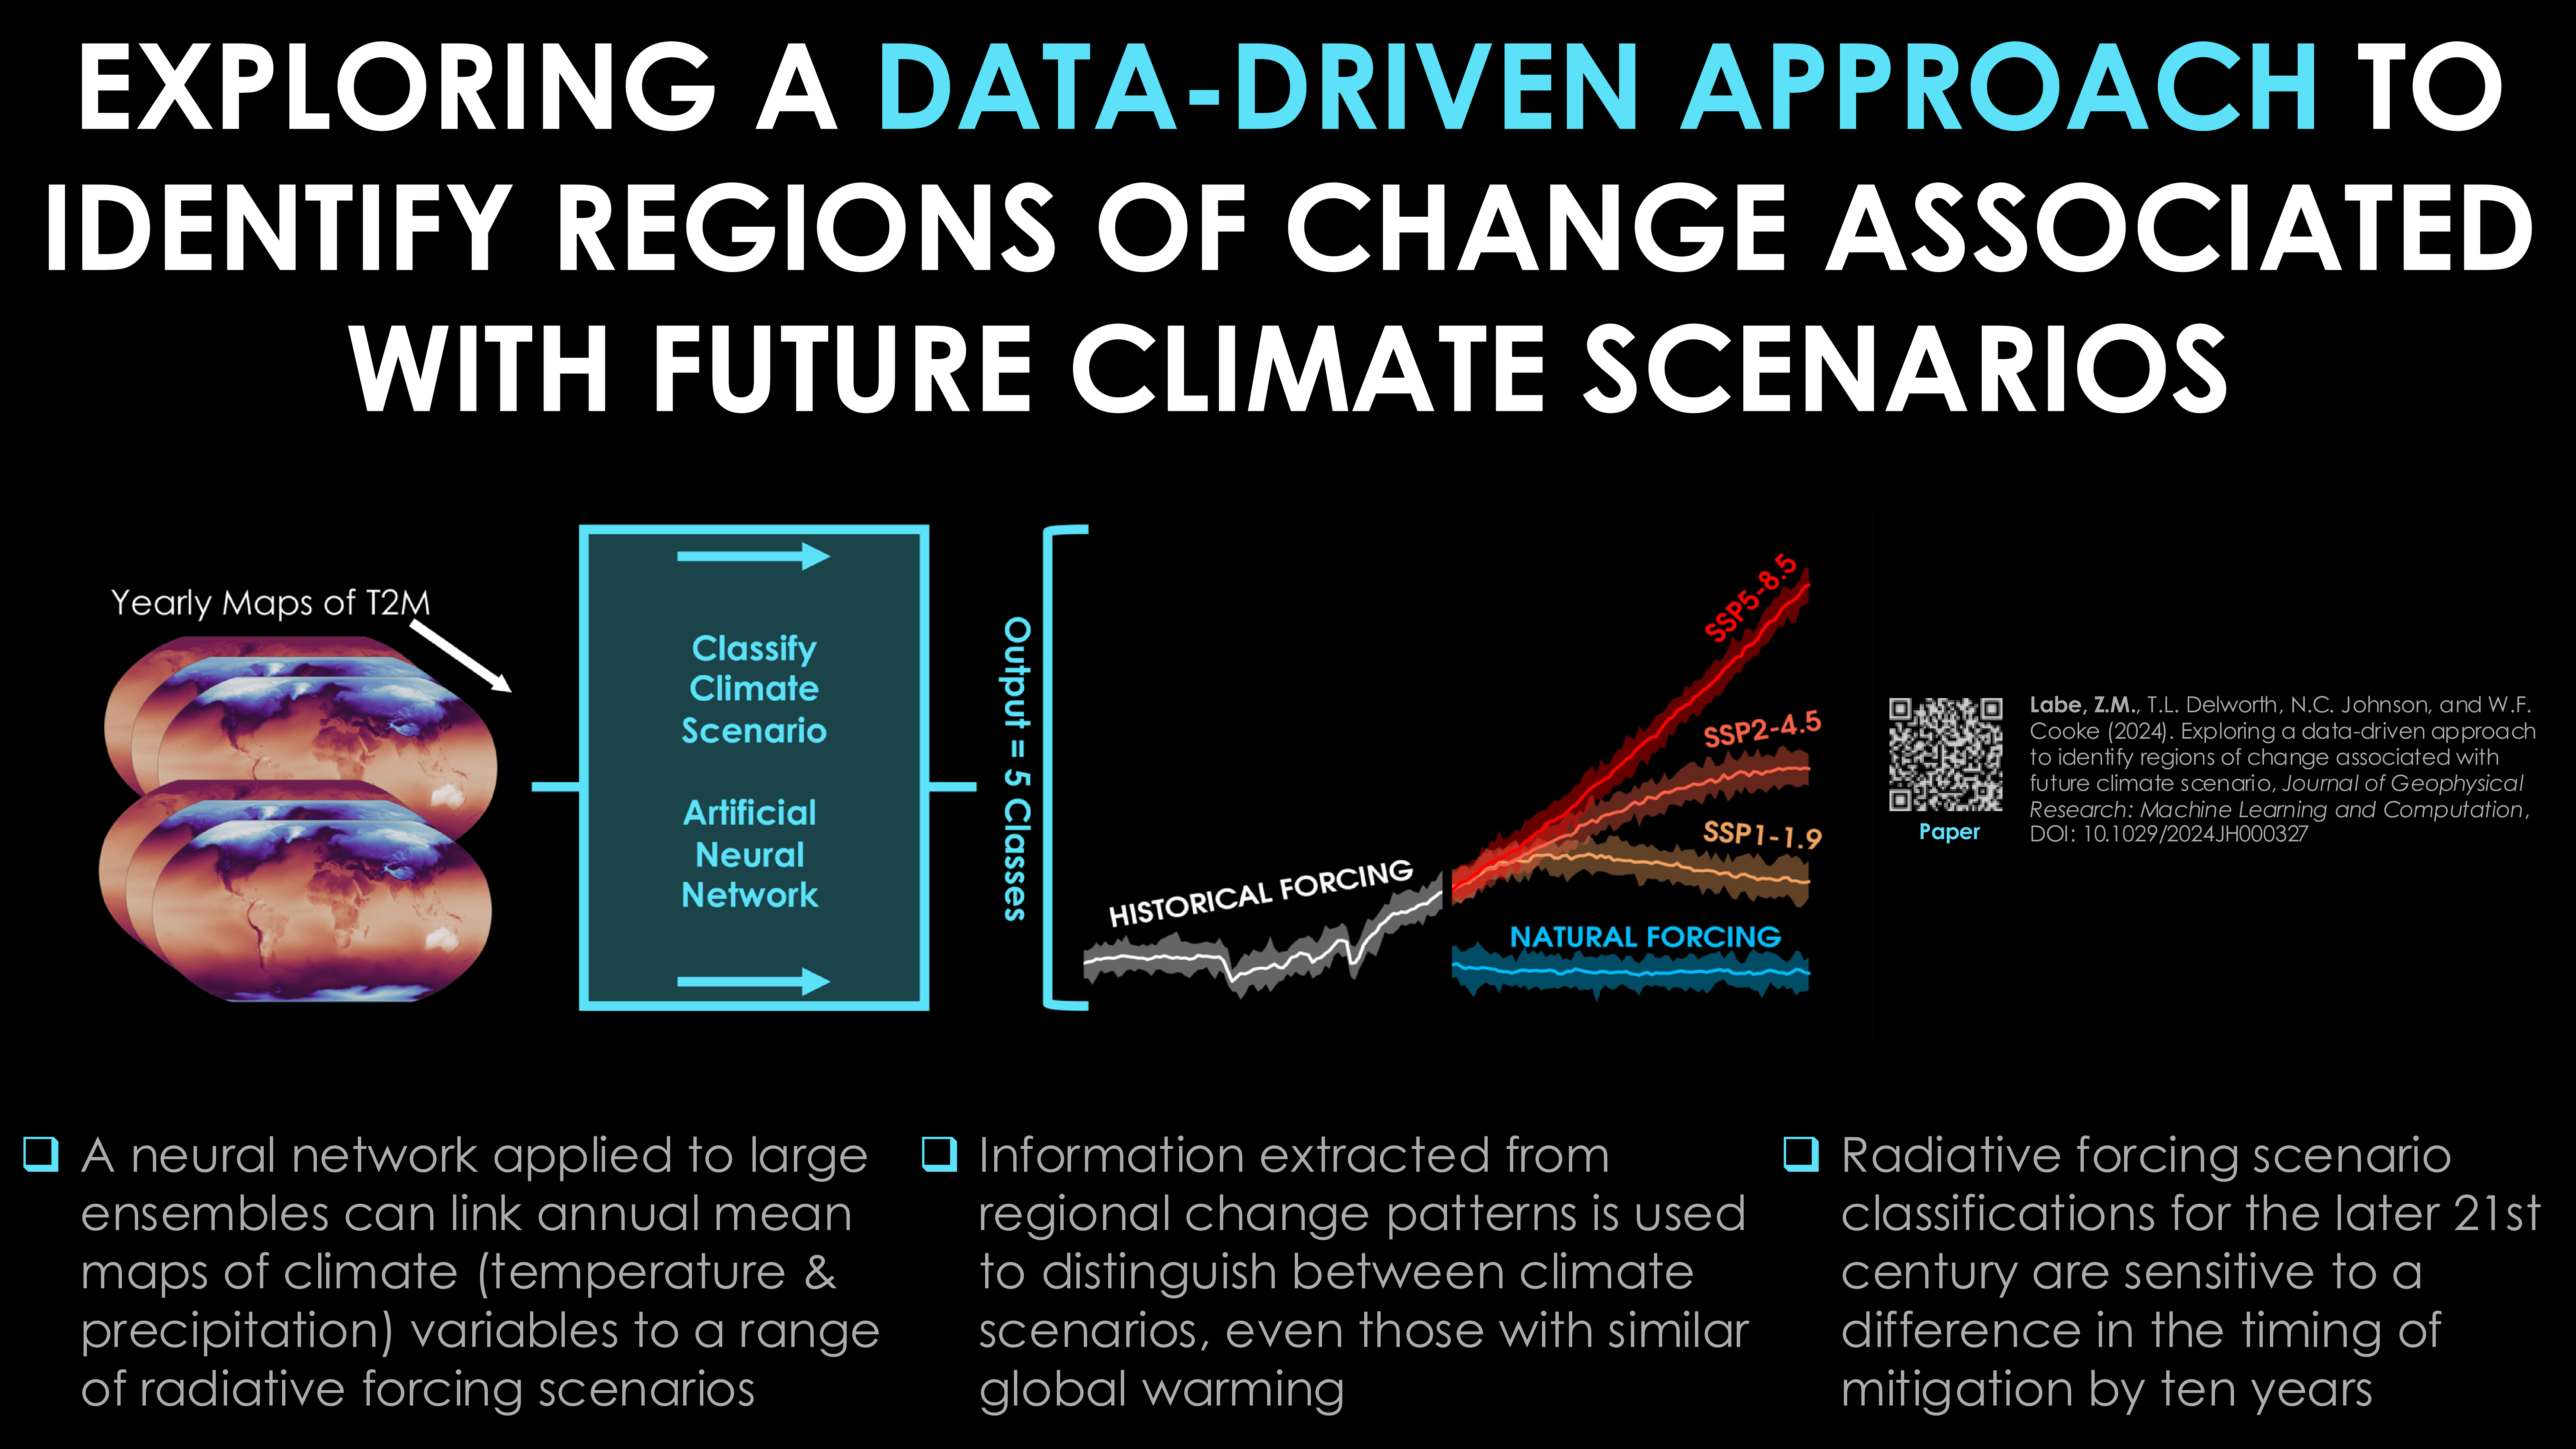
This new machine learning framework demonstrates that neural networks can learn fingerprints of regional climate change that are distinguishable across different future climate scenarios. This also suggests that a promising area of follow-up work is to consider using this data-driven methodology for monitoring observations in real-time to identify which climate change pathway the real world is actually following. Finally, the classification framework could also be used to reveal whether the impacts of climate mitigation efforts are being felt at the regional and local level for different meteorological variables. In upcoming work, we will further highlight the importance of understanding the consequences of these future overshoot scenarios for their effects on climate extremes, like heatwaves and heavy rainfall, and on the likelihood of global climate change reversibility/hysteresis.
Timing of Emergence of U.S. Summer Temperatures
While temperatures on average continue to warm due to human-caused climate change, some areas have observed greater variability than others. Understanding differences in the rate of warming is important for considering regional future projections, especially for extreme events. The aim of our new study (Labe et al. 2024) is to evaluate whether temperature signals associated with human-caused climate change have emerged across the contiguous United States.

To address this point, we turn to a new machine learning approach that uses neural networks to leverage spatial patterns of temperature for identifying the timing of emergence of mean summer minimum, maximum, and average temperatures. This is particularly of interest given the well-known ‘warming hole’ across the southeastern to central United States. In other words, this is a region that has observed little to no long-term warming trend during the summer season; you can read more about the causes of this pattern of temperature anomalies in our study from just last year (Eischeid et al. 2023).

For some background context, the ‘timing of emergence’ is a useful metric for societal and environmental planning, as it quantifies when changes in weather and climate have exceeded the historical range of natural variability for different regions of our planet. This can be informative for infrastructure, adaptation, and mitigation planning. The machine learning method leveraged here is a unique way of quantifying the timing of emergence since it can identify nonlinear temperature patterns across the data.
Importunately, our results show the clearest signal in the average United States minimum temperature, which has already emerged beyond the known range of natural variability in observational records. We also find that the neural network can identify temperature signals during a climate model’s historical simulation of the 20th century. This is surprising given the greater influence of natural climate variability during this period that continues until around 1980 when the human-caused climate change signal begins to emerge more clearly. Here, we consider a number of different climate model large ensembles, but primarily focus on GFDL’s newest state-of-the-art prediction and projection system called SPEAR. Large ensembles are a type of climate model experiment that are designed to separate internal climate variability from anthropogenic signals like greenhouse gas warming. In addition to quantifying the timing of emergence, another important finding of our study is that by using higher resolution climate model data (e.g., the 0.5° configuration vs. 1° of SPEAR), we find better accuracy in the skill of the neural network predictions. Our results suggest that future work which apply machine learning algorithms to climate data should carefully consider the size of their input (training) data.
Indicator patterns in a climate intervention experiment
Earth’s global mean surface temperature has risen to approximately 1.1 to 1.2°C above pre-industrial levels during the last few years (track this in near real-time). Although I am referring to a baseline of 1850 to 1900 here, which follows guidance from the Intergovernmental Panel on Climate Change (IPCC) Special Report on Global Warming of 1.5°C, I acknowledge that there is some warming contribution from fossil fuel activities prior to 1850. But as some of you know, I like consistency in communicating climate change. Anyways, as concluded by the recent IPCC AR6 Synthesis Report, it’s likely that we will rise above 1.5°C based on greenhouse gas emissions as implied by nationally determined contributions through year 2030.

Related to this point, there has been growing discussion on research related to climate intervention. This type of climate intervention means acting to deliberately modify the climate system to slow or reverse the warming trend in Earth’s global mean surface temperature and with the aim to also reduce potentially many of the far-reaching impacts of greenhouse gas warming. To address this topic, a recent National Academies of Science, Engineering and Medicine (NASEM) panel report recommended that a targeted research program was needed to understand the impacts and consequences of climate intervention, such as on its impacts to regional weather and climate patterns. I suggest checking out the NASEM report and the new policy statement on climate intervention by the American Meteorological Society (AMS) for more information: https://www.ametsoc.org/index.cfm/ams/about-ams/ams-statements/statements-of-the-ams-in-force/climate-intervention/ or from the American Geophysical Union (AGU): https://www.agu.org/Share-and-Advocate/Share/Policymakers/Position-Statements/Climate-Intervention-Requirements.
One commonly discussed form of climate intervention is through solar radiation modification, such as by using a technique called stratospheric aerosol injection (SAI). This is analogous to an explosive volcano releasing dust and other gases into the upper atmosphere (i.e., stratosphere), which act to temporally cool global temperatures.
However, along with all the possible unforeseen Earth system impacts in response to climate intervention, there are major ethical, economic, political, and inequality concerns. Note that this study does not suggest a realistic application of climate intervention at all, nor does it make any endorsements. Instead, the purpose of this work is to investigate whether machine learning could provide a detection method for identifying when the effects of climate intervention would be distinguishable from climate change warming in an idealized climate model experiment. The results of this work for using machine learning to find climate patterns are actually applicable to many different types of climate change future scenarios.

Specifically, in this new study (Labe et al., 2023), we design two machine learning methods (called logistic regression models and artificial neural networks) to consider the question of when climate intervention would be detectable at regional spatial scales for yearly patterns of temperature and precipitation. We focus on a new set of climate model simulations, called ARISE-SAI-1.5 (Richter et al. 2022), which are available at https://www.cesm.ucar.edu/community-projects/arise-sai. In one future ‘world’ of ARISE-SAI-1.5, climate change follows a trajectory of moderate greenhouse gas emissions (SSP2-4.5) from 2015 to 2069. However, in another future simulation of ARISE-SAI-1.5, it instead simulates the deployment of stratospheric aerosols to limit the global mean surface air temperature from rising more than 1.5°C higher than the pre-industrial value (we denote this experiment as SAI-1.5). The release of stratospheric aerosols begins in the year 2035 in the climate model. Again, the purpose of this study is to leverage explainable data-driven statistical methods for determining when climate intervention would be distinguishable on regional scales relative to climate change under SSP2-4.5.
Overall, we find that it takes up to one decade after the hypothetical aerosol injection (~2040-2045) for the accurate detection of climate intervention in most locations. We then use an artificial neural network to address whether we could identify how many years it has been since the injection started. While this is a much more difficult task due to the noise of internal climate variability, especially for precipitation, we find skillful results for some regions. Importantly, in both problems, the machine learning models spatially leverage climate signals, which we identify using methods from explainable artificial intelligence. This is consistent with our recent work (see below) on showing the utility of explainable machine learning for disentangling climate change patterns from natural climate variability.
Comparing climate models and observations in the Arctic
The Arctic is warming 3-4x faster than the globally averaged mean temperature trend. In addition to sea-ice loss, numerous other feedbacks in the climate system contribute to this rapid warming (Druckenmiller et al. 2021). In fact, some studies have pointed out that the Arctic is transitioning to an entirely new state (Landrum and Holland, 2020). To understand the consequences of this rapid warming, it especially important to evaluate the validity of current and future projections from climate models.
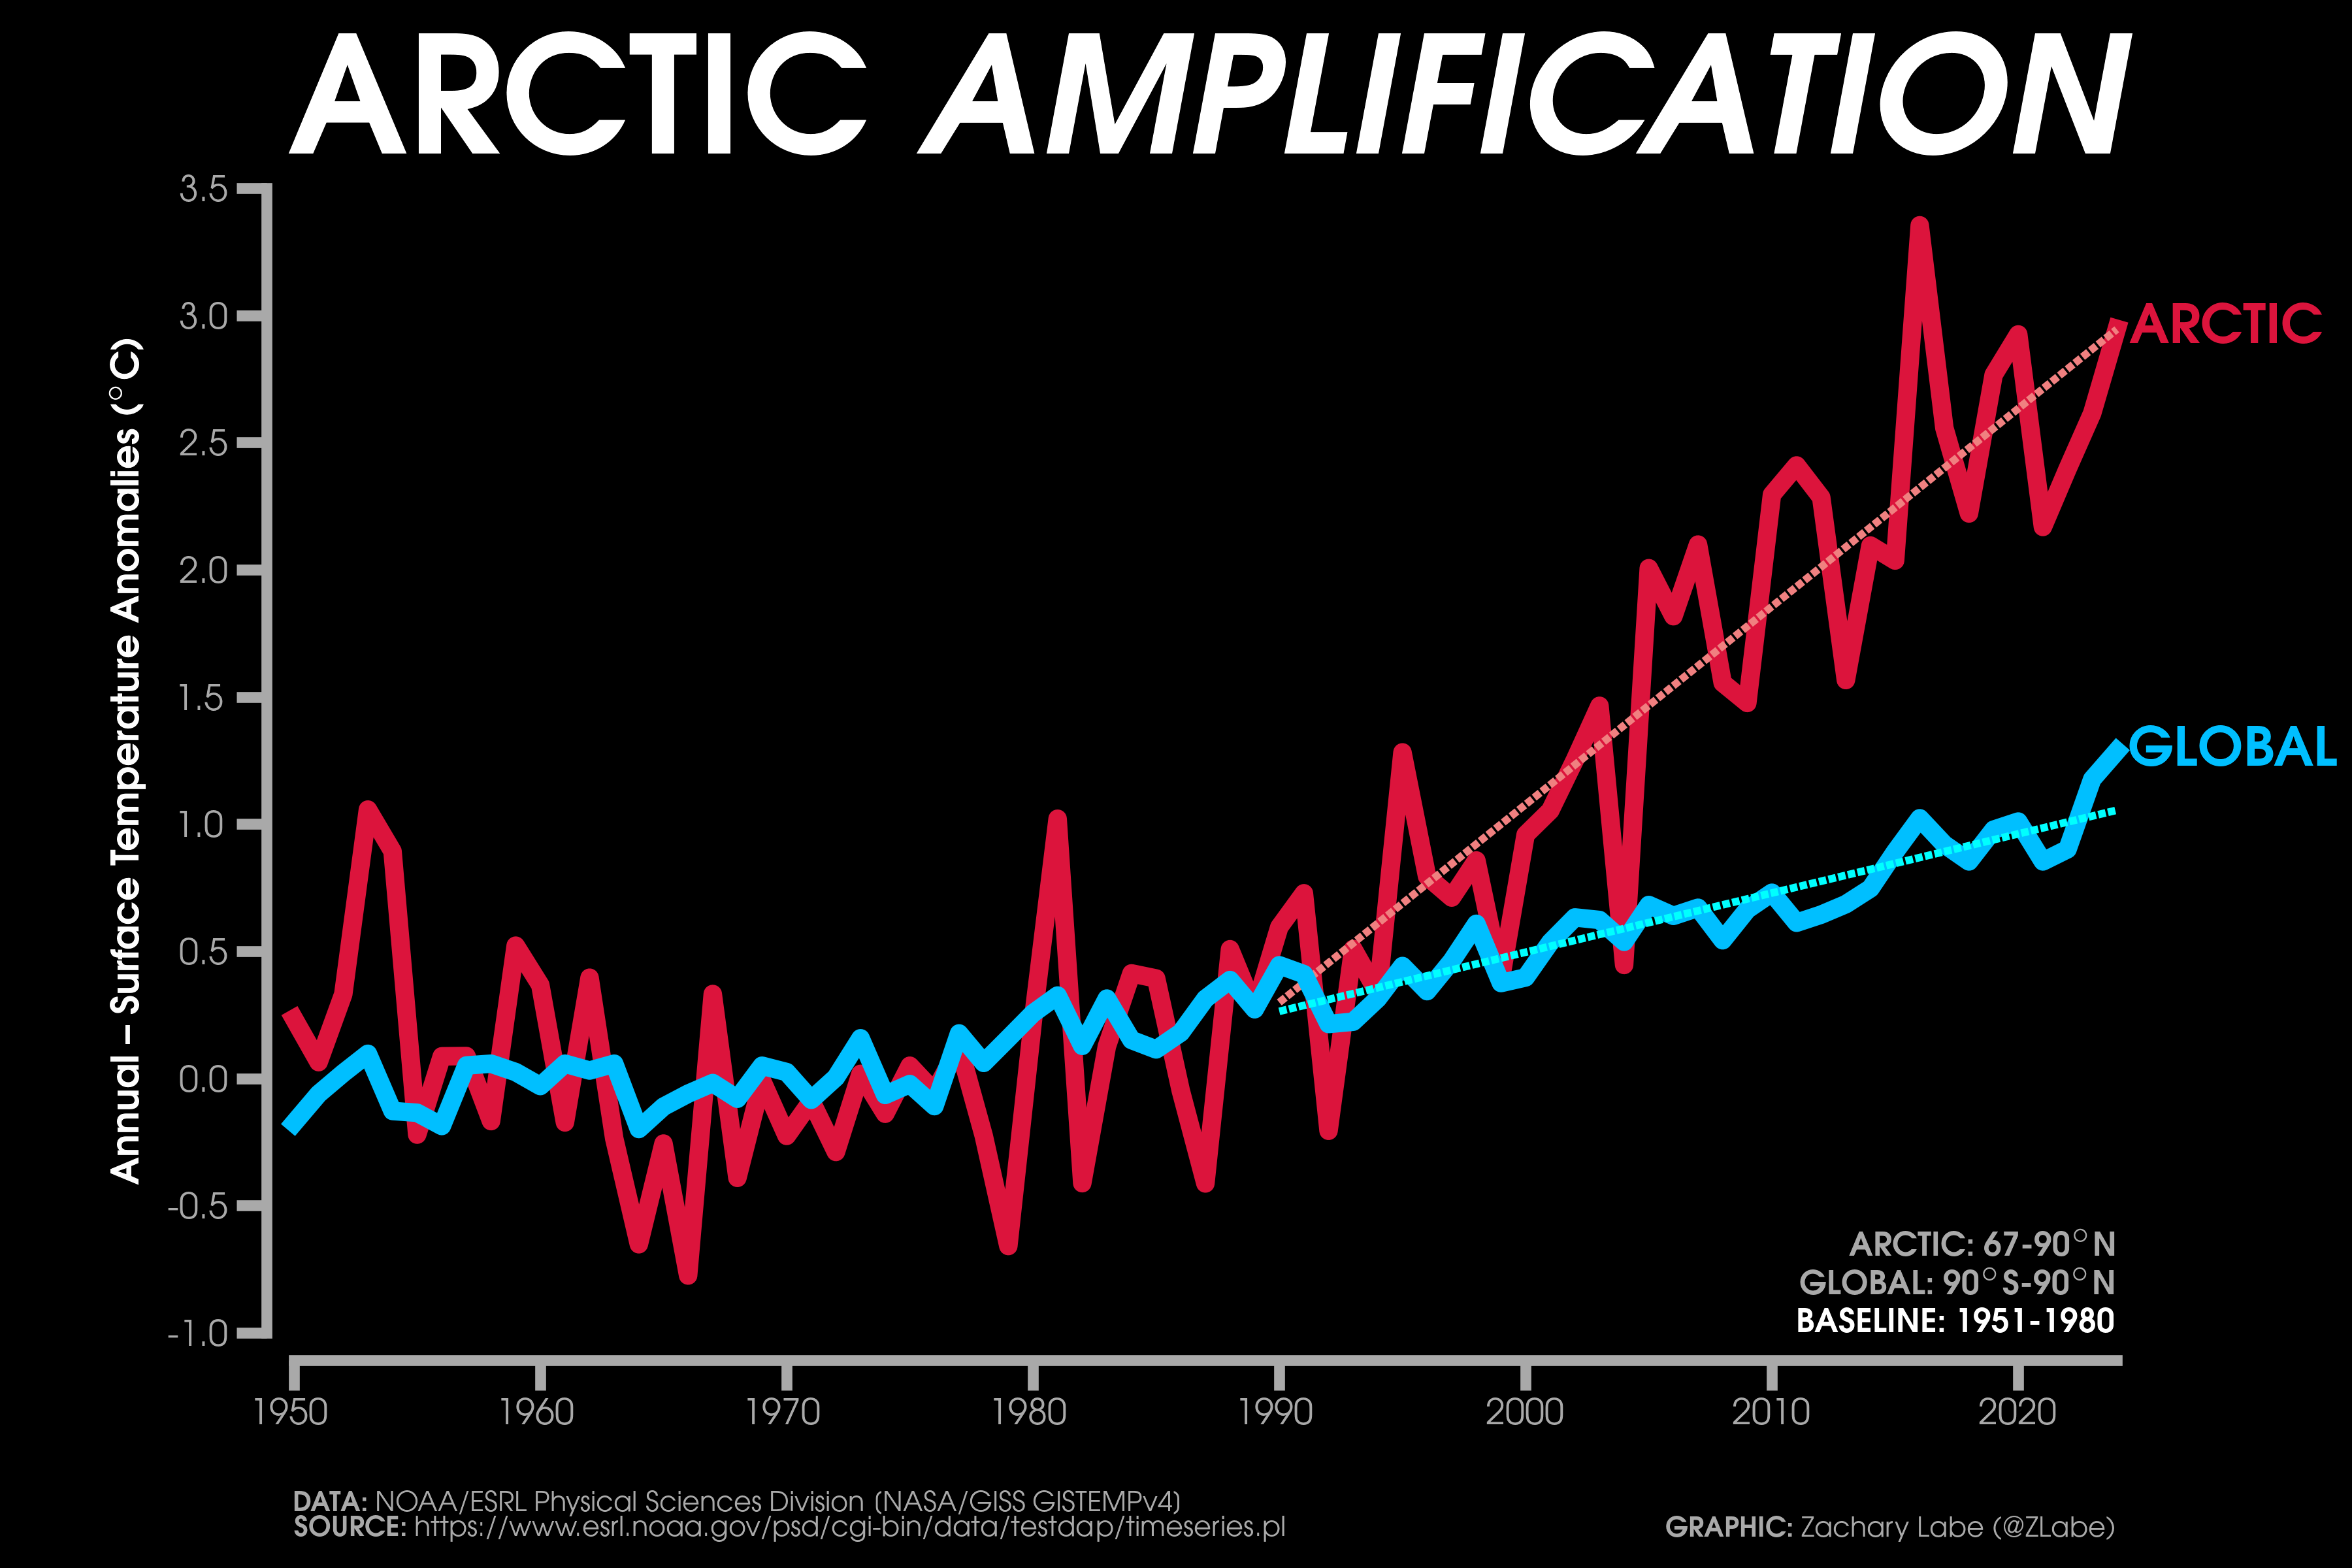
The Arctic is warming 3-4x faster than the globally averaged mean temperature trend. In addition to sea-ice loss, numerous other feedbacks in the climate system contribute to this rapid warming (Druckenmiller et al. 2021). In fact, some studies have pointed out that the Arctic is transitioning to an entirely new state (Landrum and Holland, 2020). To understand the consequences of this rapid warming, it especially important to evaluate the validity of current and future projections from climate models.
Since the development of the earliest forms of climate models, scientists have used statistical methods with different levels of complexity for evaluating their performance (e.g., using root-mean-square error (RMSE), pattern correlations, model weighting, emergent constraints, principal component analysis, etc.) (see Gleckler et al. 2016). However, there can be issues with these approaches (e.g., Willmott et al. 2017), such as linear assumptions about the data or only considering point-by-point statistics. Given the recent successes for using machine learning to identify regional climate patterns (e.g., Barnes et al. 2020), we decided to consider whether this framework could also be used for comparing climate models and observations.

Due to the growing availability of computational resources, climate centers frequently run their climate models simulations for a number of iterations, which only differ by small tweaks to the initial conditions. These types of experiments are called large ensembles, and they are useful for evaluating internal variability in the climate system (Maher et al. 2021). In other words, this is the randomness/chaos/noise of our atmosphere. Given that big datasets are needed to train, evaluate, and limit overfitting for useful machine learning models, climate model large ensemble experiments are particularly well-suited for addressing all sorts of scientific questions.
Considering these two pieces – Arctic climate change and machine learning – we evaluate climate model large ensembles and observations using a statistical method called neural networks. Specifically, in our new study (Labe and Barnes, 2022), we input yearly maps of near-surface air temperature from 7 different climate models and ask the neural network if it can identify which climate model produced each temperature map. Interestingly, we find that the neural network quickly learns how to accurately identify the right temperature map with the right climate model. To find out how the neural network is doing so, we leverage machine learning explainability methods to identify the regional temperature patterns that are unique to each climate model large ensemble. These regional patterns often align with known climate model biases at the ice-ocean interface, such over the marginal ice zone of the Greenland and Barents Seas.
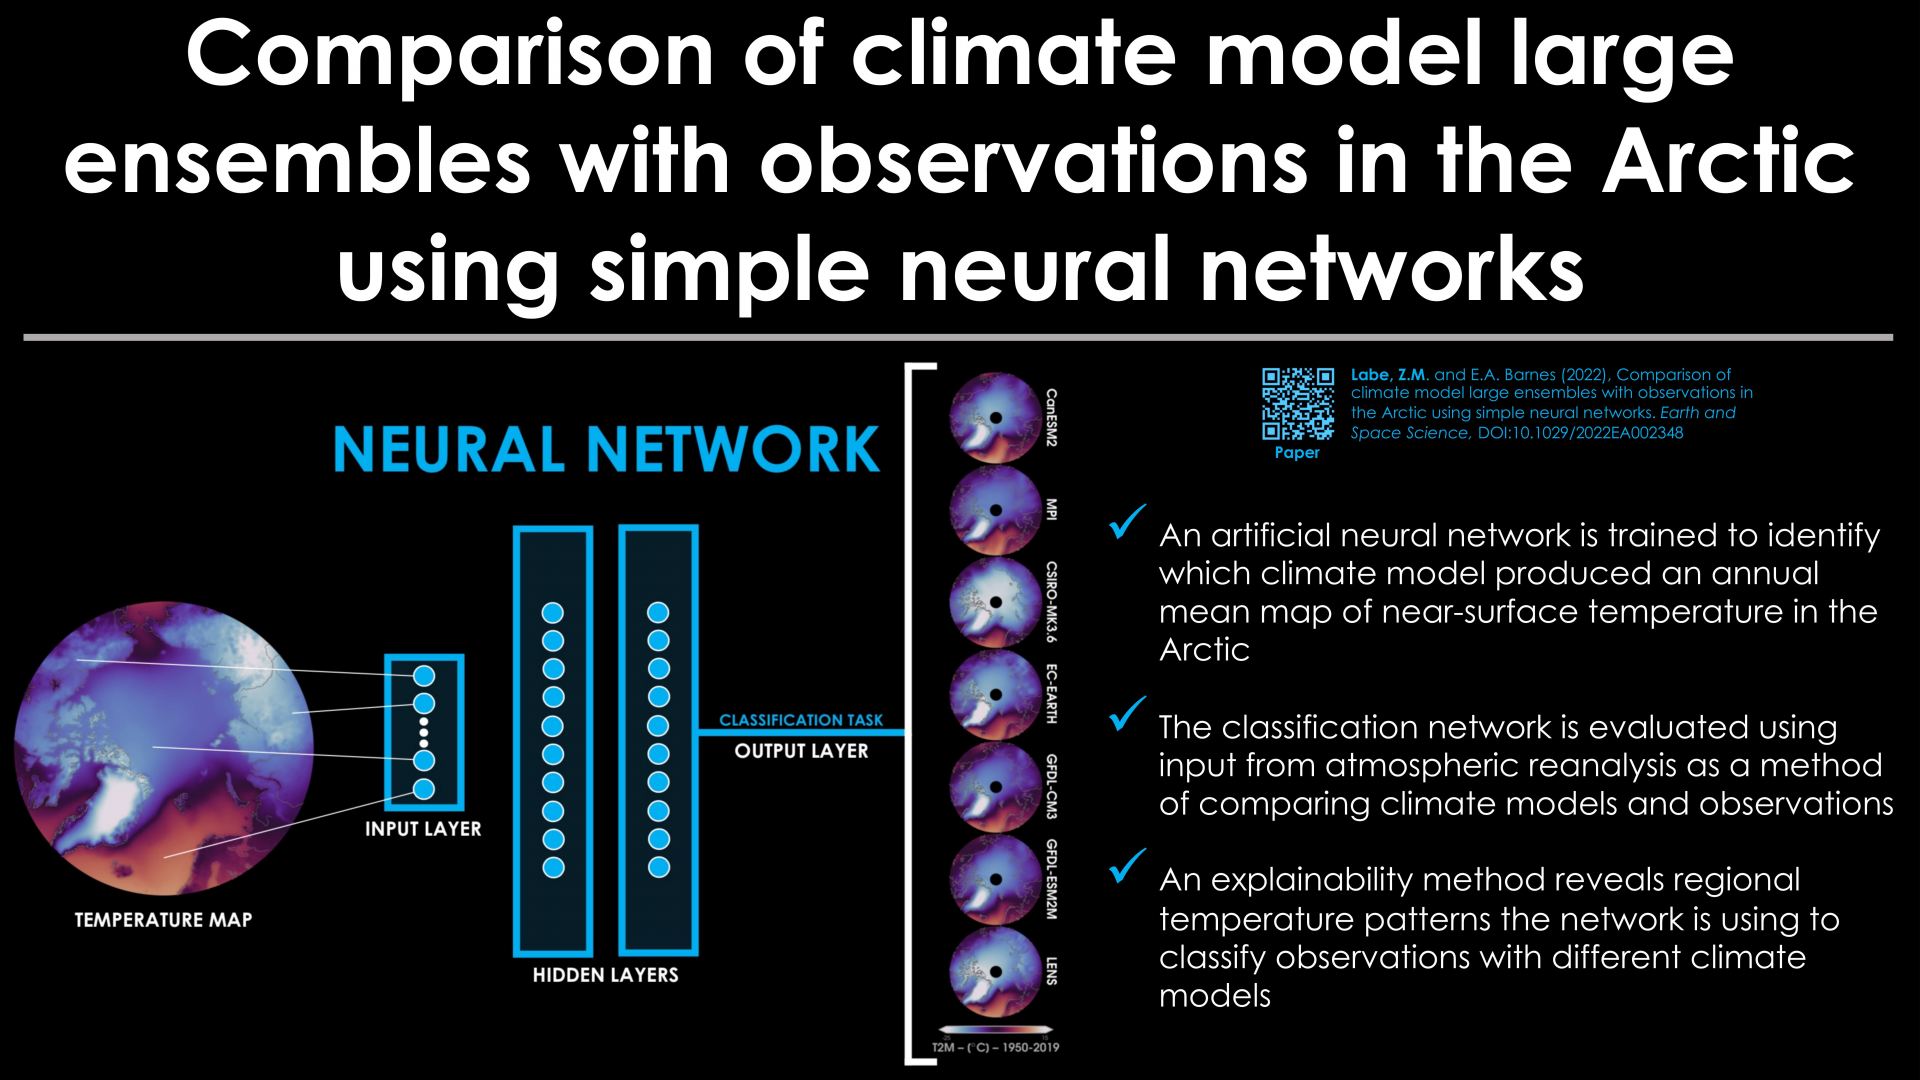
Finally, we input maps of yearly Arctic temperatures from observations and ask the neural network to associate it with one of the climate models. As a method of evaluating the skill of each observational map classification, we sort the climate models according to the confidence of the neural network output. We also compare this ranking with traditional climate model evaluation methods, such as RMSE, and find they compare surprisingly well despite the large differences in statistical approaches.
In summary, we leverage explainability methods in machine learning to identify differences between climate models and observations in the Arctic. One advantage of this approach is that we can address potential nonlinearities in the climate system and compare patterns of regional variability across the Arctic. In agreement with recent studies, we find that neural networks can be valuable tools for addressing patterns of climate change and variability in large ensemble modeling experiments.
Predicting temporary slowdowns in decadal warming

While there is a growing demand from government officials and other stakeholders for decadal climate predictions (e.g., Hermanson et al. 2022), forecasts are usually provided by modeling centers running computationally expensive Earth system models. Despite the increasing interest in explainable artificial intelligence (XAI) for weather and climate science (Boukabara et al. 2021), there still has been very little work on using machine learning methods for predicting on seasonal-to-decadal timescales (e.g., Gordon et al. 2021; Toms et al. 2021; Gordon and Barnes, 2022).
Meanwhile, the early 2000s temporary warming slowdown (also known as the “climate change hiatus/pause” – see Medhaug et al. 2017 and Wei et al. 2022) revealed a large gap between the multi-model mean from fully-coupled climate models and real-world observations. Thus, in our new study (Labe and Barnes, 2022), we were motivated to leverage recently adopted XAI tools for climate science and evaluate the potential predictability of similar warming slowdown events occurring in a climate model and observations. To assess whether these temporary slowdowns in decadal climate warming trends are predictable, we trained an artificial neural network by inputting maps of upper ocean heat content anomalies to assess whether a slowdown event will occur within the next 10-year period. Specifically, we use data from the newly released CESM2 Large Ensemble, which was a climate model experiment designed to assess the influences of internal variability in the climate system.

Notably, despite only training on single maps of upper ocean heat content for each year, we find that the skill of our neural network is substantially better than random chance and higher than other logistic regression models using predictors like global mean (sea) surface temperature or the Interdecadal Pacific Oscillation. We further use a machine learning explainability tool to peer into the “black box” and highlight that our neural network is using physically-consistent mechanisms for its correct predictions, which resemble transitions in the phase of the Interdecadal Pacific Oscillation.
Lastly, we test the skill of the neural network on observations and find that it successfully predicts the early 2000s slowdown using single annual mean maps of upper ocean heat content. This suggests that patterns of ocean heat content variability in the CESM2 large ensemble may be consistent with the real-world for some types of decadal warming slowdown events. In summary, we believe that even this simple neural network highlights the promising future for using machine learning tools in a wide variety of decadal climate prediction problems.
Disentangling aerosols and greenhouse gases
Aerosols (particles in the atmosphere) have an important influence on Earth’s climate (IPCC, 2013). On one hand, they can block incoming solar radiation, which acts as a cooling mechanism. However, other aerosols, like black carbon, can induce warming by absorbing solar energy. In general, aerosols remain a highly uncertain climate forcing (Bellouin et al. 2019). Recent studies have also shown that global climate model simulations are highly sensitive to the number of human-caused (anthropogenic) aerosols that are emitted during the 20th century (Dittus et al. 2020; Fyfe et al. 2021).
Thanks to a growing number of supercomputers, climate modelers have started to run their simulations over and over again. These types of experiments are called large ensembles, and they are produced by slightly tweaking the initial conditions of a climate model using a small round-off error (Deser et al. 2020b). Large ensembles have the advantage of allowing scientists to explore internal variability – in other words, the noise in the climate system (an example is shown in the animation). These large ensembles are often prescribed with realistic greenhouse gases and anthropogenic aerosols over the 20th and 21st centuries (Deser et al. 2020a). Since both greenhouse gases and aerosols can have (non)linear interactions that affect regional and global climate change, it is difficult for scientists to directly attribute their individual causality. To address this issue, scientists at the National Center for Atmospheric Research (NCAR) have developed a new set of large ensemble simulations that are forced by different combinations of anthropogenic aerosols and greenhouse gases. For example, in one experiment, greenhouse gases evolve realistically from 1920 to 2080, while industrial aerosols are held fixed to 1920 levels. This combination of single-forcing simulations allow us to disentangle their influence on climate change and variability.
In our new study (Labe and Barnes, 2021), we use a novel pattern recognition-like method from an artificial neural network (ANN) to compare regional climate change signals across the single-forcing large ensembles. Our relatively shallow (few hidden layers) ANN is trained on inputs of surface temperature maps from a climate model, and then it outputs the year/decade of those maps as its prediction. As shown in earlier studies (Barnes et al. 2019; Barnes et al. 2020), the ANN architecture here use regional patterns of information in order to predict the year of the input maps. To find these climate indicators, we use a method of explainable artificial intelligence (XAI) called layer-wise relevance propagation (LRP; Toms et al. 2020), which allows us to “see” where these important regions exist that the ANN is using for its predictions. Finally, after training our model on the large ensemble simulations, we can test the ANN by inputting maps of real-world observations. By using an ANN, we consider potential nonlinearities in regional climate signals that evolve over time due to greenhouse gases and industrial aerosols, which may not be easily captured by traditional statistical methods.
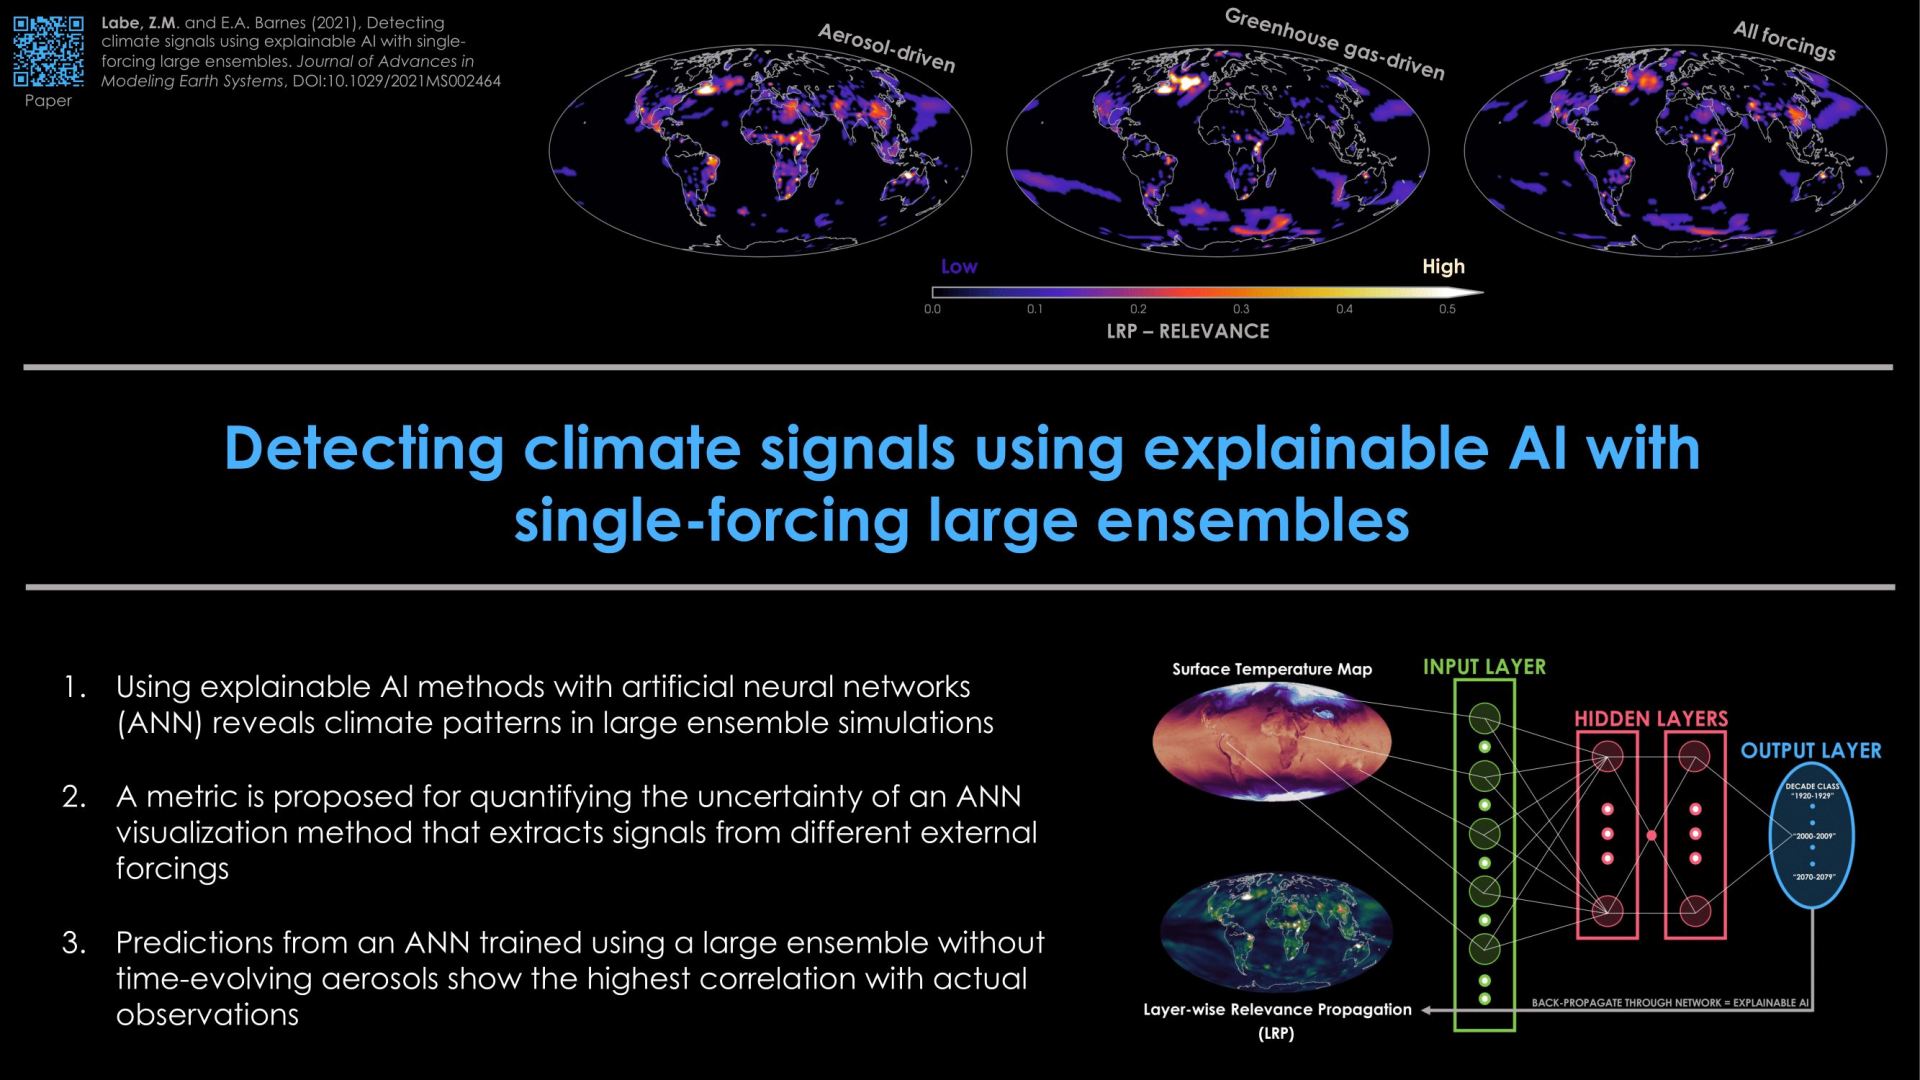
In summary, we find that Southeast Asia, the Southern Ocean, and the North Atlantic Ocean are key regional signals that are important for the ANN to be able to make a prediction. The patterns of relevance also differ between the aerosol and greenhouse gas simulations. In agreement with recent work (e.g., Dagan et al. 2020), our LRP method reveals that anthropogenic aerosols have had an important role in surface temperature trends near the North Atlantic Warming Hole. Finally (and perhaps most interesting), we find that the yearly predictions based on real-world observations (from 1920 to 2015) correlate more closely to actual data after training the ANN on the large ensemble with industrial aerosols held fixed to 1920 levels. This correlation is slightly higher than from the ANN trained on the more realistic large ensemble simulation (with both time-evolving aerosols and greenhouse gases). Broadly, this work supports recent studies that reveal how global climate models may be overly sensitive to aerosols when compared to observations in the 20th century. Our study shows how XAI methods can be a valuable tool for identifying the timing of emergence of regional climate change signals.
Refereed/Peer-Reviewed:
[10] Kalashnikov, D.A., J.T. Abatzoglou, F.V. Davenport, Z.M. Labe, P.C. Loikith, D. Touma, and D. Singh (2025). Projections of Lightning-Ignited Wildfire Risk in the Western United States. Earth’s Future, DOI:10.1029/2025EF006108
[HTML][BibTeX][Code][Data]
[Press Release][CalMatters][New York Times][The Guardian]
[9] Kalashnikov, D.A., F.V. Davenport, Z.M. Labe, P.C. Loikith, J.T. Abatzoglou, and D. Singh (2024). Predicting cloud-to-ground lightning in the Western United States from the large-scale environment using explainable neural networks. Journal of Geophysical Research: Atmospheres, DOI:10.1029/2024JD042147
[HTML][BibTeX][Code][Data]
[8] Labe, Z.M., T.L. Delworth, N.C. Johnson, and W.F. Cooke (2024). Exploring a data-driven approach to identify regions of change associated with future climate scenarios. Journal of Geophysical Research: Machine Learning and Computation, DOI:10.1029/2024JH000327
[HTML][BibTeX][Code]
Plain Language Summary
[7] Kretschmer, M., A. Jézéquel, Z.M. Labe, and D. Touma (2024). A shifting climate: new paradigms and challenges for (early career) scientists in extreme weather research. Atmospheric Science Letters, DOI:10.1002/asl.1268
[HTML][BibTeX]
[6] Labe, Z.M., N.C. Johnson, and T.L. Delworth (2024), Changes in United States summer temperatures revealed by explainable neural networks. Earth’s Future, DOI:10.1029/2023EF003981
[HTML][BibTeX][Code]
[Plain Language Summary][GFDL Bulletin]
[5] Labe, Z.M., E.A. Barnes, and J.W. Hurrell (2023). Identifying the regional emergence of climate patterns in the ARISE-SAI-1.5 simulations. Environmental Research Letters, DOI:10.1088/1748-9326/acc81a
[HTML][BibTeX][Code]
[Plain Language Summary]
[4] Po-Chedley, S., J.T. Fasullo, N. Siler, Z.M. Labe, E.A. Barnes, C.J.W. Bonfils, and B.D. Santer (2022). Internal variability and forcing influence model-satellite differences in the rate of tropical tropospheric warming. Proceedings of the National Academy of Sciences, DOI:10.1073/pnas.2209431119
[HTML][BibTeX][Code][Data]
[Press Release][DOE Research Highlight]
[3] Labe, Z.M. and E.A. Barnes (2022), Comparison of climate model large ensembles with observations in the Arctic using simple neural networks. Earth and Space Science, DOI:10.1029/2022EA002348
[HTML][BibTeX][Code]
[Plain Language Summary]
[2] Labe, Z.M. and E.A. Barnes (2022), Predicting slowdowns in decadal climate warming trends with explainable neural networks. Geophysical Research Letters, DOI:10.1029/2022GL098173
[HTML][BibTeX]
[Plain Language Summary][DOE Research Highlight]
[1] Labe, Z.M. and E.A. Barnes (2021), Detecting climate signals using explainable AI with single-forcing large ensembles. Journal of Advances in Modeling Earth Systems, DOI:10.1029/2021MS002464
[HTML][BibTeX]
[Plain Language Summary][Data Skeptic Podcast]
Submitted:
Coming soon! 🙂
Presentations:
[49] Labe, Z.M. Utility of explainable machine learning for scenarios of climate change, Session III: AI Explainability and Climate Science Innovation, Broadening Access to Climate AI Innovation Workshop, University of Virginia, USA (May 2025) (Invited-Remote).
[SlideShare]
[48] Kalashnikov, D.A., J. Abatzoglou, F.V. Davenport, Z.M. Labe, P.C. Loikith, D. Touma, and D. Signh. Projections of Lightning-Ignited Wildfire Risk in the Western United States, 15th Fire and Forest Meteorology Symposium , Denver, CO (May 2025).
[Abstract]
[47] Labe, Z.M. Using machine learning for understanding changes in the Earth system, Guest lecture for “First-Year Innovation and Research Experience and Climate Computing, University of Maryland, College Park, MD (Feb 2025) (Invited).
[SlideShare]
[46] Kalashnikov, D.A., J. Abatzoglou, F.V. Davenport, Z.M. Labe, P.C. Loikith, D. Touma, and D. Signh. Projecting cloud-to-ground lightning and wildfire ignition risk in the western United States, 12th Conference on the Meteorological Application of Lightning Data, New Orleans, LA (Jan 2025).
[Abstract]
[45] Kalashnikov, D.A., J.T. Abatzoglou, F.V. Davenport, Z.M. Labe, P.C. Loikith, D.E. Touma, and D. Singh. Projecting cloud-to-ground lightning and wildfire ignition risk in the western United States, 2024 American Geophysical Union Annual Meeting, Washington, DC (Dec 2024).
[Abstract]
[44] Labe, Z.M. XAI for detecting scenarios of future climate change, Climate & Global Dynamics Machine Learning Group, NSF NCAR, Boulder, CO, USA (Nov 2024) (Invited-Remote).
[SlideShare]
[43] Labe, Z.M. Timing of emergence of U.S. summer temperatures with explainable AI, Building AI-Ready workforce for heat resilience, 6th NOAA AI Workshop, USA (Sep 2024) (Invited-Remote).
[SlideShare]
[42] Labe, Z.M. Machine learning for climate prediction at decadal and longer timescales, Predictability, Predictions, and Applications Interface (PPAI) Panel, US CLIVAR, Boulder, CO, USA (Aug 2024) (Invited-Remote).
[SlideShare]
[41] Labe, Z.M., L. Jia, N.C. Johnson, C.E. McHugh, T.L. Delworth, and W.F. Cooke. Prediction, projection, and detection of U.S. heat extremes using data-driven approaches with the GFDL SPEAR modeling system, Extreme Heat Workshop: Emerging Risks from Concurrent, Compounding and Record-breaking Extreme Heat across Sectors, Columbia University, NY, USA (Jul 2024).
[Poster]
[40] Labe, Z.M., T.L. Delworth, N.C. Johnson, and W.F. Cooke. Explainable AI for distinguishing future climate change scenarios, EGU General Assembly 2024, Vienna, Austria (Apr 2024).
[Abstract][SlideShare]
[39] Labe, Z.M. Explainable AI approach for evaluating climate models in the Arctic, Modelers’ Community of Practice, IARPC Collaborations, Remote Presentation (Mar 2024) (Invited).
[Event][SlideShare]
[38] Labe, Z.M. Applications of machine learning for climate change and variability, Department of Environmental Sciences Seminar, Rutgers University, New Brunswick, NJ (Feb 2024) (Invited).
[SlideShare]
[37] Labe, Z.M., T.L. Delworth, N.C. Johnson, and W.F. Cooke. A data-driven approach to identifying key regions of change associated with future climate scenarios, 23rd Conference on Artificial Intelligence for Environmental Science, Baltimore, MD (Jan 2024).
[Abstract][SlideShare]
[36] Kalashnikov, D.A., F.V. Davenport, Z.M. Labe, P.C. Loikith, J. Abatzoglou, and D. Singh. Using deep learning to predict cloud-to-ground lightning in the western United States, 23rd Conference on Artificial Intelligence for Environmental Science, Baltimore, MD (Jan 2024).
[Abstract]
[35] Labe, Z.M., N.C. Johnson, and T.L. Delworth. Distinguishing the regional emergence of United States summer temperatures between observations and climate model large ensembles, 23rd Conference on Artificial Intelligence for Environmental Science, Baltimore, MD (Jan 2024).
[Abstract][SlideShare]
[34] Kalashnikov, D.A., F.V. Davenport, Z.M. Labe, P.C. Loikith, J. Abatzoglou, and D. Singh. Using deep learning to predict cloud-to-ground lightning in the western United States, 2023 American Geophysical Union Annual Meeting, San Francisco, CA (Dec 2023).
[Abstract]
[33] Labe, Z.M. Revisiting projections of Arctic climate change linkages, Department Seminar, Tongji University, Shanghai, China. (Nov 2023) (Invited-Remote).
[SlideShare]
[32] Labe, Z.M. Using explainable machine learning to evaluate climate change projections, Atmosphere and Ocean Climate Dynamics Seminar, Yale University, CT, USA (Oct 2023) (Invited-Remote).
[SlideShare]
[31] Labe, Z.M. Creative machine learning approaches for climate change detection, Resnick Young Investigators Symposium, California Institute of Technology (Caltech), CA, USA (Apr 2023) (Invited)
[Symposium Event][SlideShare]
[30] Labe, Z.M., N.C. Johnson, and T.L Delworth. A data-driven approach to identifying key regions of climate change in GFDL SPEAR, GFDL Poster Session with NOAA Research, Princeton, NJ, USA (Apr 2023).
[Poster]
[29] Labe, Z.M. Using explainable AI to identify key regions of climate change in GFDL SPEAR large ensembles, GFDL Lunchtime Seminar Series, Princeton, NJ, USA (Mar 2023).
[SlideShare]
[28] Labe, Z.M. Using explainable machine learning for evaluating patterns of climate change, Natural Sciences Group Seminar, Washington State University Vancouver, WA, USA (Feb 2023) (Invited-Remote).
[SlideShare]
[27] Labe, Z.M. Exploring explainable machine learning for detecting changes in climate, Department of Earth, Ocean, and Atmospheric Science Colloquium, Florida State University, FL, USA (Feb 2023) (Invited-Remote).
[SlideShare]
[26] Labe, Z.M. Forced climate signals with explainable AI and large ensembles, Atmospheric and Oceanic Sciences Student/Postdoc Seminar, Princeton University, NJ, USA (Feb 2023).
[SlideShare]
[25] Labe, Z.M. Explainable AI for identifying regional climate change patterns, Scientific Machine Learning Community, University of Leeds, UK (Jan 2023) (Invited-Remote).
[SlideShare][Recording]
[24] Labe, Z.M. and E.A. Barnes. Using artificial neural networks to predict temporary slowdowns in global warming trends, 22nd Conference on Artificial Intelligence for Environmental Science, Virtual Attendance (Jan 2023).
[Abstract][SlideShare]
[23] Labe, Z.M., E.A. Barnes, and J.W. Hurrell. Detecting the regional emergence of climate signals with machine learning in a set of stratospheric aerosol injection simulations, 2022 American Geophysical Union Annual Meeting, Chicago, IL (Dec 2022).
[Abstract][Poster][Code]
[22] Po-Chedley, S., E.A. Barnes, C. Bonfils, J. Fasullo, Z.M. Labe, B. Santer, and N. Siler. Substantial contribution of internal variability to satellite-era tropospheric warming inferred from CMIP6 large ensembles, 2022 American Geophysical Union Annual Meeting, Chicago, IL (Dec 2022).
[Abstract]
[21] Labe, Z.M. Machine learning for evaluating climate model projections, IEEE-Student Branch – IIT Indore, Tech-Talks 2.0, India (Dec 2022) (Invited-Remote).
[SlideShare]
[20] Po-Chedley, S., E.A. Barnes, C. Bonfils, J. Fasullo, Z.M. Labe, B. Santer, and N. Siler. Internal variability influences model-satellite differences in the rate of tropical tropospheric warming, CLIVAR Climate Dynamics Panel (CDP) annual workshop: External versus internal variability on decadal and longer time scales, Virtual Workshop (Oct 2022).
[19]Labe, Z.M. and E.A. Barnes. Temporary slowdowns in decadal warming predictions by a neural network, CLIVAR Climate Dynamics Panel (CDP) annual workshop: External versus internal variability on decadal and longer time scales, Virtual Workshop (Oct 2022).
[SlideShare][Poster]
[18] Po-Chedley, S., E.A. Barnes, C. Bonfils, J. Fasullo, Z.M. Labe, B. Santer, and N. Siler. Internal Variability and Forcing Influence Model-satellite Differences in the Rate of Tropical Tropospheric Warming, Asia Oceania Geosciences Society 19th Annual Meeting, Virtual Conference (Aug 2022).
[17] Labe, Z.M. Learning new climate science by thinking creatively with machine learning, GFDL/AOS Summer Internship Lecture Series, Princeton University, NJ (Jun 2022).
[SlideShare]
[16] Labe, Z.M. and E.A. Barnes. Using neural networks to predict temporary slowdowns in decadal climate warming trends, 27th Annual CESM Workshop, Virtual Workshop (Jun 2022).
[SlideShare]
[15] Po-Chedley, S., E.A. Barnes, C. Bonfils, J. Fasullo, Z.M. Labe, B. Santer, and N. Siler. Internal variability influences model-satellite differences in the rate of tropical tropospheric warming, US CLIVAR: The Pattern Effect: Coupling of SST Patterns, Radiative Feedbacks, and Climate Sensitivity Workshop, Boulder, CO (May 2022).
[Poster]
[14] Labe, Z.M. and E.A. Barnes. Using explainable neural networks for comparing climate model projections, 27th Conference on Probability and Statistics, Virtual Attendance (Jan 2022).
[Abstract][SlideShare]
[13] Labe, Z.M. and E.A. Barnes. Using neural networks to explore regional climate patterns in single-forcing large ensembles, 2021 American Geophysical Union Annual Meeting, Virtual Attendance (Dec 2021) (Invited).
[Abstract][SlideShare]
[12] Labe, Z.M. and E.A. Barnes. Evaluating global climate models using simple, explainable neural networks, 2021 American Geophysical Union Annual Meeting, Virtual Attendance (Dec 2021) (Invited).
[Abstract][SlideShare]
[11] Labe, Z.M. Exploring climate change signals with explainable AI, NASA JPL Carbon Club, Pasadena, CA. Remote Presentation (Dec 2021) (Invited).
[SlideShare]
[10] Labe, Z.M. and E.A. Barnes. Decadal warming slowdown predictions by an artificial neural network, 2021 Young Scientist Symposium on Atmospheric Research (YSSAR), Colorado State University, CO (Oct 2021).
[SlideShare]
[9] Labe, Z.M. Assessing climate variability and change with explainable neural networks, GFDL, Princeton University, NJ. Remote Presentation (Oct 2021) (Invited).
[SlideShare]
[8] Labe, Z.M. Learning new climate science by opening the machine learning black box, Department of Psychology: Cognitive Brownbag Series, Colorado State University, CO (Sep 2021) (Invited).
[SlideShare]
[7] Labe, Z.M. and E.A. Barnes. Exploring climate model large ensembles with explainable neural networks, WCRP workshop on attribution of multi-annual to decadal changes in the climate system, Virtual Workshop (Sep 2021).
[SlideShare]
[6] Labe, Z.M. and E.A. Barnes. Climate model evaluation with explainable neural networks, 3rd NOAA Workshop on Leveraging AI in Environmental Sciences, Virtual Workshop (Sep 2021).
[Poster]
[5] Labe, Z.M. and E.A. Barnes. Using explainable neural networks for comparing historical climate model simulations, 2nd Workshop on Knowledge Guided Machine Learning (KGML2021), Virtual Workshop (Aug 2021).
[Poster]
[4] Labe, Z.M. and E.A. Barnes. Climate Signals in CESM1 Single-Forcing Large Ensembles Revealed by Explainable Neural Networks, 26th Annual CESM Workshop, Virtual Workshop (Jun 2021).
[SlideShare]
[3] Mayer, K.J., E. Gordon, Z.M. Labe, A. Mamalakis, Z. Martin, and E.A. Barnes. Explainable AI for Climate Science, Institute for Energy and Climate Research (IEK-7), Remote Presentation (Mar 2021).
[2] Labe, Z.M. Revealing climate change signals with explainable AI, 2021 Spring Postdoctoral Research Symposium, Remote Presentation (Mar 2021).
[SlideShare]
[1] Labe, Z.M. and E.A. Barnes. Disentangling Climate Forcing in Multi-Model Large Ensembles Using Neural Networks, 20th Conference on Artificial Intelligence for Environmental Science, Virtual Conference (Jan 2021).
[Abstract][SlideShare][Summary]