February 2026
It’s time for my next “climate viz of the month” blog, but first some unfortunate news. The widely used Pan-Arctic Ice-Ocean Modeling and Assimilation System (PIOMAS; Zhang and Rothrock, 2003) will be pausing in the short term. The reason is that NOAA NWS/NCEP has terminated production of the NCEP/NCAR Reanalysis 1 (R1) as of 18 March 2026 (see notice), which is a key input for PIOMAS.
So why is this important? PIOMAS is an ice-ocean model, meaning it does not include an atmosphere. Instead, it reads in atmospheric information such as surface winds, air temperature, and cloud cover fraction, along with sea surface temperatures, from R1. While it is true that R1 is quite old and will be replaced by newer reanalysis products like CORe, PIOMAS was specifically tuned and calibrated using R1. That matters, as changing the atmospheric forcing is not a simple swap and can influence simulated sea-ice thickness and volume trends (see this study). This means there will be a significant amount of work required to re-calibrate PIOMAS for a different reanalysis product.
And why does this matter? PIOMAS is the only dataset that provides a temporally and spatially complete record of Arctic sea-ice thickness and volume since January 1979 (to my knowledge). There are other modeled products, including those from the Danish Meteorological Institute, as well as satellite observations, but they do not provide a long enough or consistent record to fully capture climate change trends (check out this comparison together we put together). Satellite altimetry products are also more limited in summer because melt ponds interfere with thickness retrievals (though this might be changing). PIOMAS has been widely evaluated, including in my own research, and is one of the go-to datasets in polar climate science. Even a temporary pause is a big loss.
This all creates a gap in one of the most physically meaningful indicators of Arctic climate change: sea-ice volume. It also comes at a time when Arctic sea-ice volume has been near record lows, with especially thin ice in parts of the central Arctic and near the North Pole. I also expect that GIOMAS may be affected given its reliance on similar atmospheric forcing, though I have not yet seen any official notice (I sent an email to follow-up). This will also affect my Antarctic/Global sea-ice volume graphics. It is a frustrating situation. At a time when we should be expanding and refining long-term climate data records, we are instead facing more challenges, especially due to limited funding and institutional support. Hopefully there is a clear path forward soon. I will also do my best to explore alternative sources and develop new graphics for continued real-time monitoring of sea-ice thickness and volume on my website, though this will take some time to fully assess their strengths and limitations. Stay tuned.
Now that I have shared that we are losing a key dataset for Arctic sea ice, I also want to highlight where things currently stand. The annual maximum Arctic sea-ice extent reached another record low this year, effectively tied with the previous record set just last year. The maximum occurred on 15 March 2026 at 14.29 million square kilometers (5.52 million square miles) (NSIDC Sea Ice Index v4 data). 2025 was at 14.31 million square kilometers (5.53 million square miles). This is about 1.3 million square kilometers (500,000 square miles) below the 1981 to 2010 climatological average. The timing was close to normal. The average date of the maximum over 1981 to 2010 is March 12.
It is also important to remember that these records begin in 1979, with the start of the temporally- and spatially-consistent passive microwave satellite observations. Within that record, the past two winters now stand out for the lowest annual maximum extents.
My special visualization for this month shows changes in daily Arctic sea-ice concentration from 1 January 2026 through late March, using the high-resolution (about 3 km) AMSR2 satellite product. You may notice some artifacts along coastlines, where the satellite can falsely detect sea ice. These are common and can mostly be ignored. The fast pace of my animation is intentional. It highlights the day-to-day growth and variability that define an Arctic winter. I have also included a second animation showing the long-term changes in the annual maximum extent from 1979 to 2026. The downward trend is obvious.
Overall, this winter has been particularly concerning across the Arctic. Sea ice remained unusually low for much of the season, and in many periods tracked at or near daily record lows for the time of year.
While the final maximum is now in, the broader winter context still stands out. Conditions were especially poor across several regions, including the Sea of Okhotsk, Baffin Bay, Labrador Sea, Barents Sea, and Kara Sea, where sea-ice extent remained persistently below average. The Sea of Okhotsk in particular saw one of the smallest maximum extents on record for that region and stands out as a major outlier compared to any other year in the satellite record as of late March. One of the few exceptions was the eastern Bering Sea near Alaska, which saw higher ice coverage compared to average, particularly over the past month when ice extent reached its farthest southward position in several years.
The thickness and volume story has been just as concerning. Based on PIOMAS, sea ice north of Greenland has been more than 2 meters thinner than average in places. Ice near the North Pole has also been at or near record-low thickness now for several months. In February, total Arctic sea-ice volume ranked as the second lowest on record.
Taken together, the Arctic is entering late winter in one of its weakest states in the satellite era. As I say every year at this point, it is still too early to say what this will mean for the summer melt season, since regional weather patterns can shift quickly. But winter 2025 to 2026 is another clear signal of how rapidly the Arctic is changing. Human-caused climate change is continuing to reshape the polar environment, with growing impacts near and far. While it seems like natural climate variability has temporarily offset some of the long-term trend for September Arctic sea ice (around the annual minimum), recent winter conditions show a more steady decline. Given that the Arctic Ocean is ice-covered in winter (and will continue to be well into the future), the declines are happening around the outer margins of the region.
This winter also featured notable temperature variability and extremes. Greenland experienced record warmth in January, followed by a sharp shift to much colder than average conditions in February across the area and parts of northern Canada. Across the Arctic, lower tropospheric temperatures (925 hPa) ranked as the 2nd warmest on record in January but dropped to around the 30th warmest in February. Near-surface air temperatures told a similar story, with February ranking 31st warmest. So while February seemed relatively cold compared to recent years, it does not offset the broader warmth. Looking more closely at cumulative cold, total freezing degree day anomalies across the high Arctic (north of 80°N) show one of the largest negative deviations on record within my tracking period (which began in July 2025 and uses a July to June year). This highlights the overall lack of sustained cold recently across the northernmost parts of the planet, even with short-term variability like in February.
That’s all for now – thanks for reading! You can find archives of my past blogs listed below. If you would like to support this website, you can also find a Buy Me a Coffee page: https://buymeacoffee.com/zacklabe.
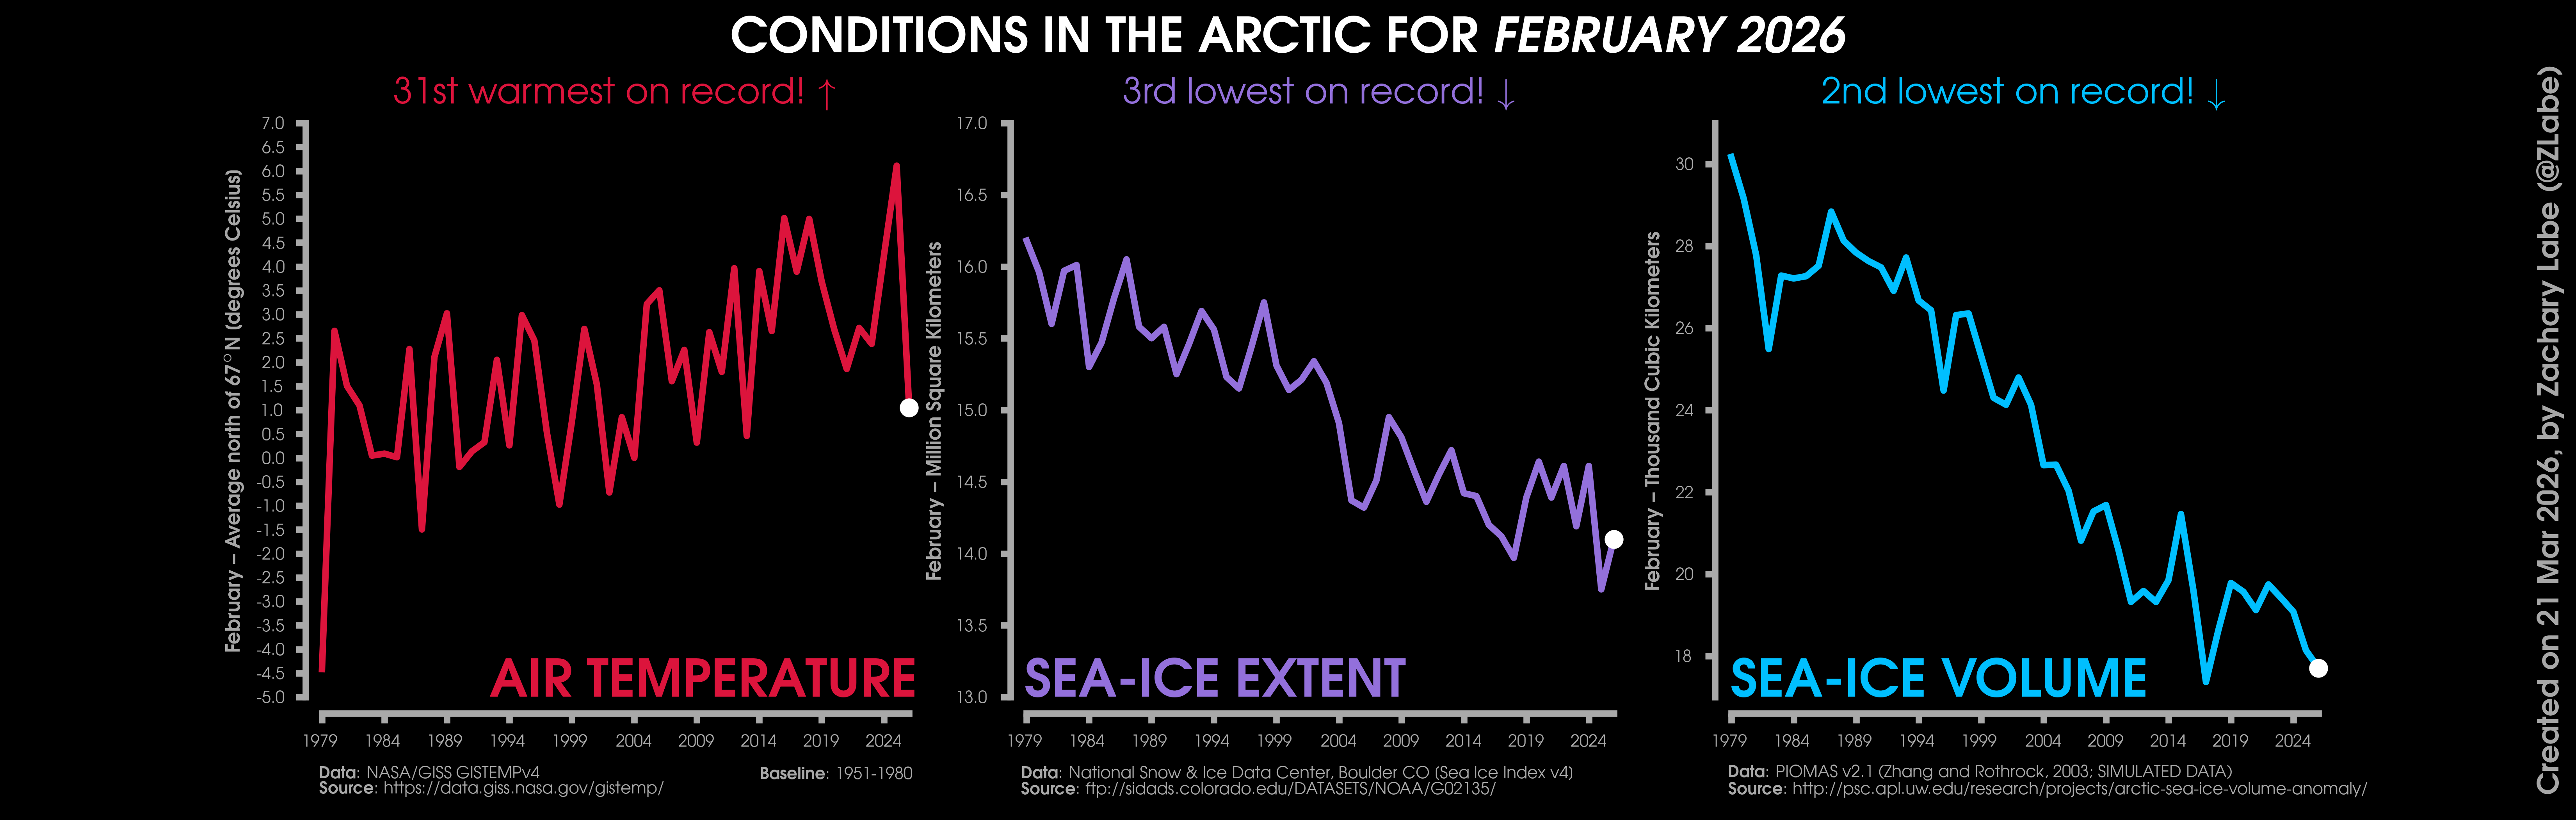
Changes in mean surface air temperature anomalies (GISTEMPv4; 1951-1980 baseline), mean Arctic sea ice extent (NSIDC; Sea Ice Index v4), and mean Arctic sea ice volume (PIOMAS v2.1; Zhang and Rothrock, 2003) over the satellite era. Updated 3/21/2026.
Other Blogs (Monthly):

Other Climate Data Statistics (Monthly):
My Visualizations:
My research related to data visualization:
[2] Witt, J.K., Z.M. Labe, A.C. Warden, and B.A. Clegg (2023). Visualizing uncertainty in hurricane forecasts with animated risk trajectories. Weather, Climate, and Society, DOI:10.1175/WCAS-D-21-0173.1
[HTML][BibTeX][Code]
[Blog][Plain Language Summary][CNN]
[1] Witt, J.K., Z.M. Labe, and B.A. Clegg (2022). Comparisons of perceptions of risk for visualizations using animated risk trajectories versus cones of uncertainty. Proceedings of the Human Factors and Ergonomics Society Annual Meeting, DOI:10.1177/1071181322661308
[HTML][BibTeX][Code]
[Plain Language Summary][CNN]
The views presented here only reflect my own. These figures may be freely distributed (with credit). Information about the data can be found on my references page and methods page.