Hi! My name is Zack! I’m a climate scientist looking to find the signal in all the noise. I use data-driven methods to untangle climate change patterns from natural variability, providing clearer insights into climate risks. I also spend a lot of time thinking about how to make science more engaging through storytelling and visualization.
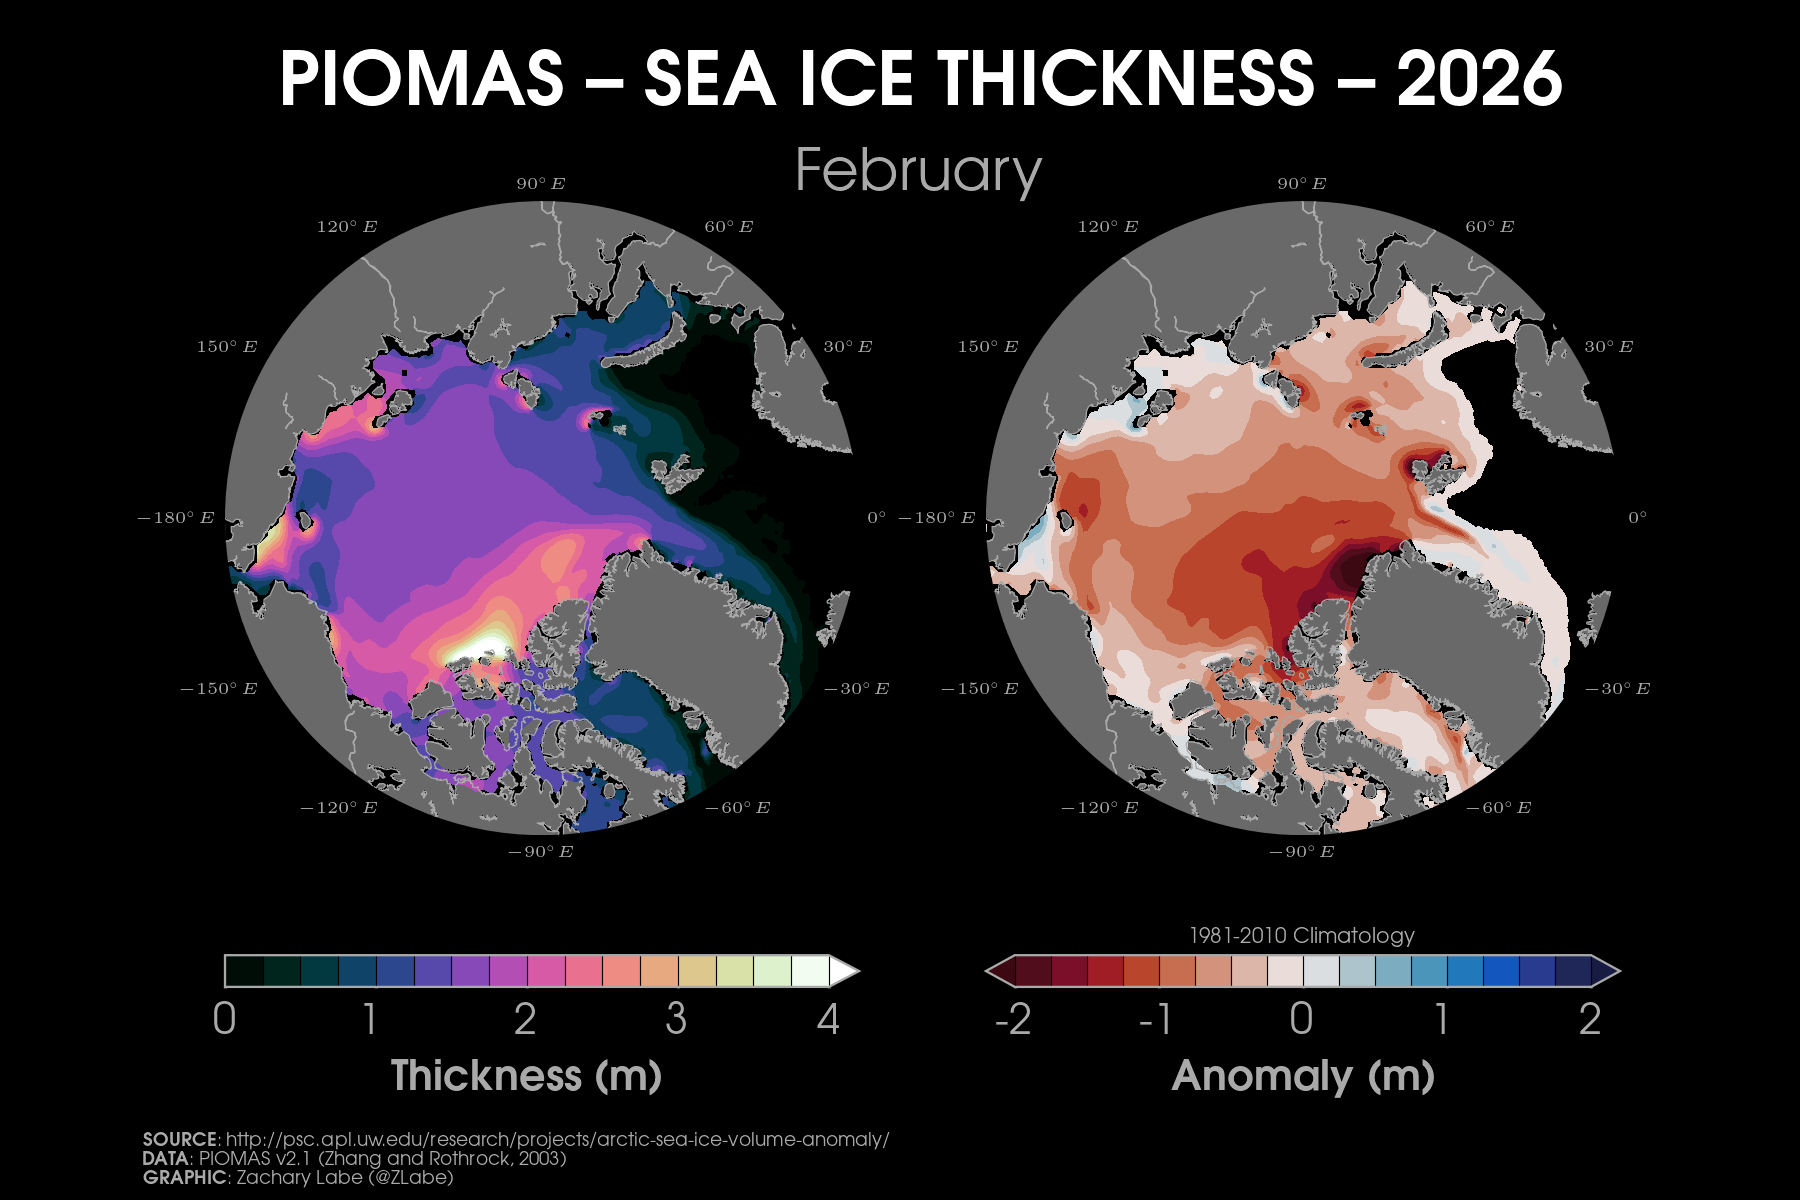
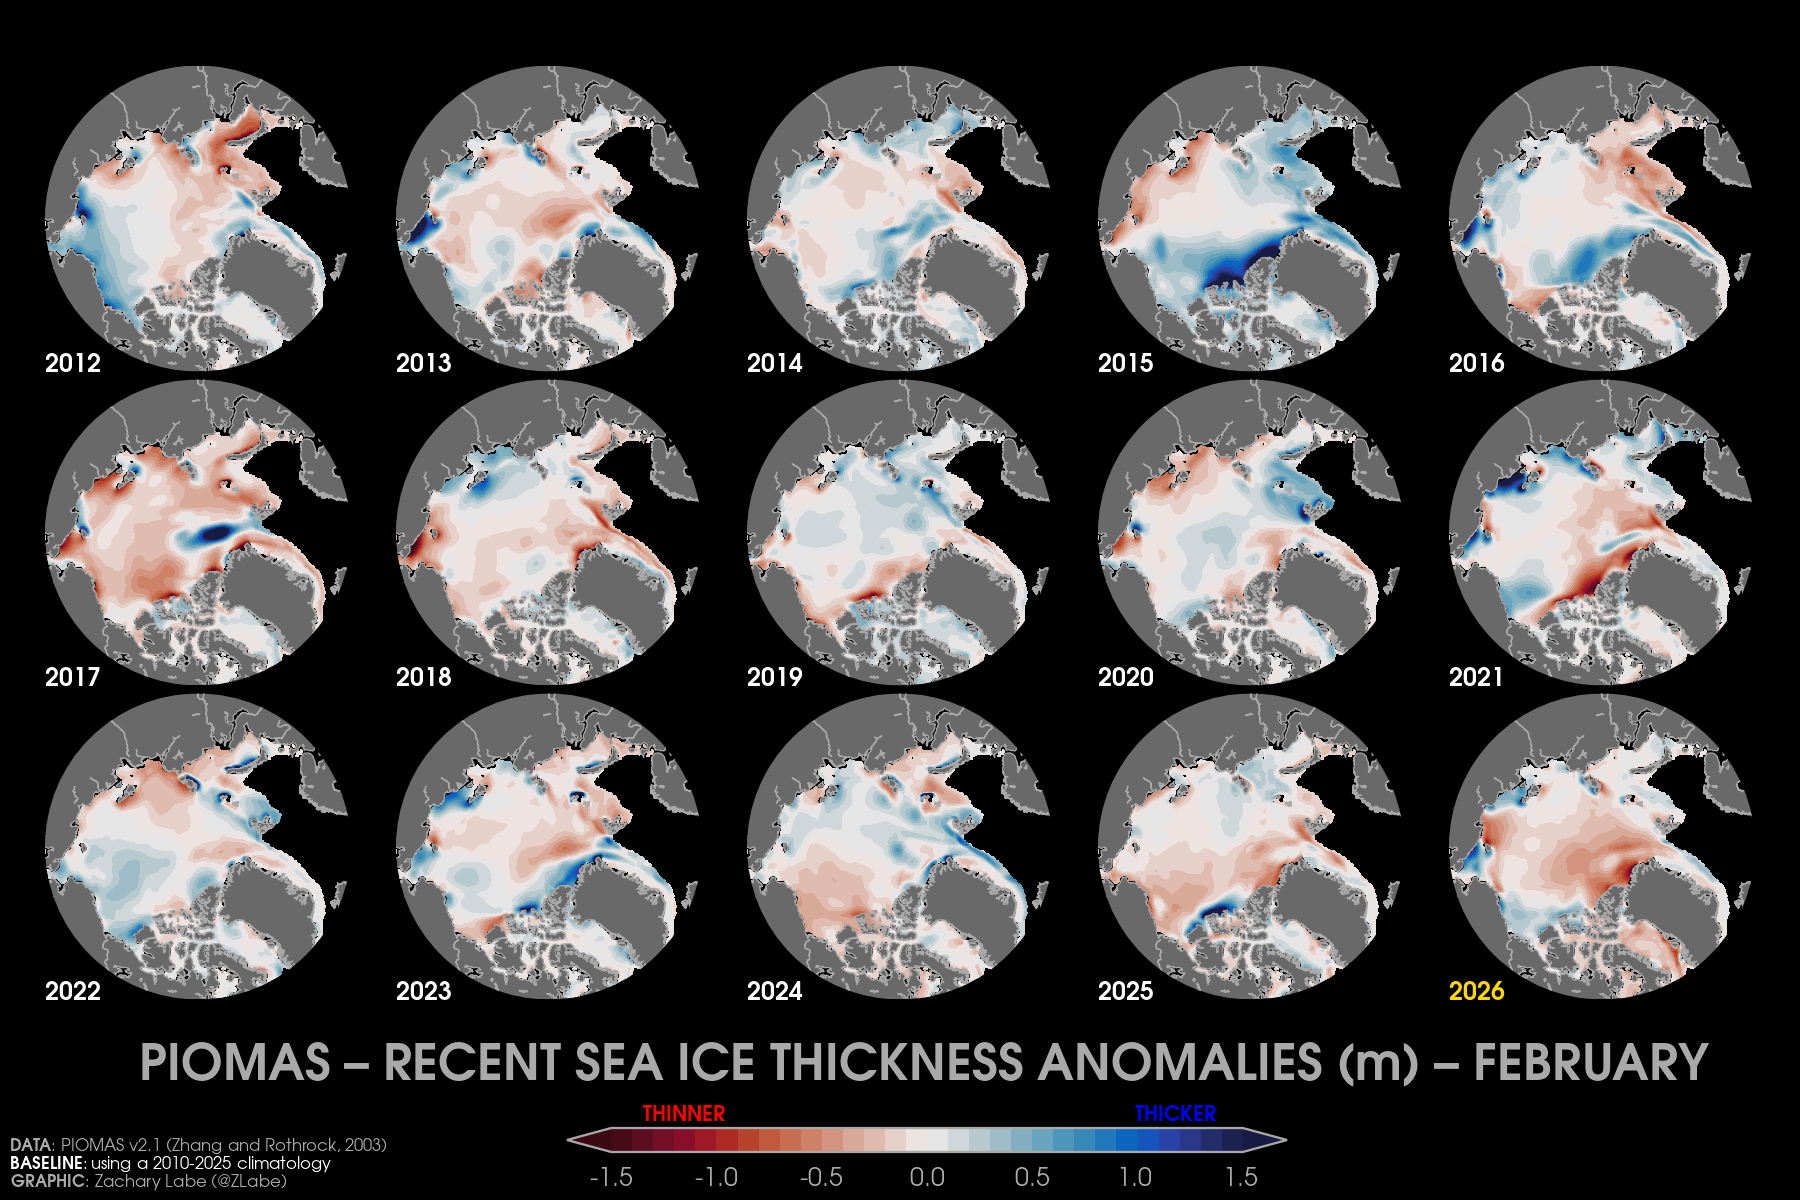
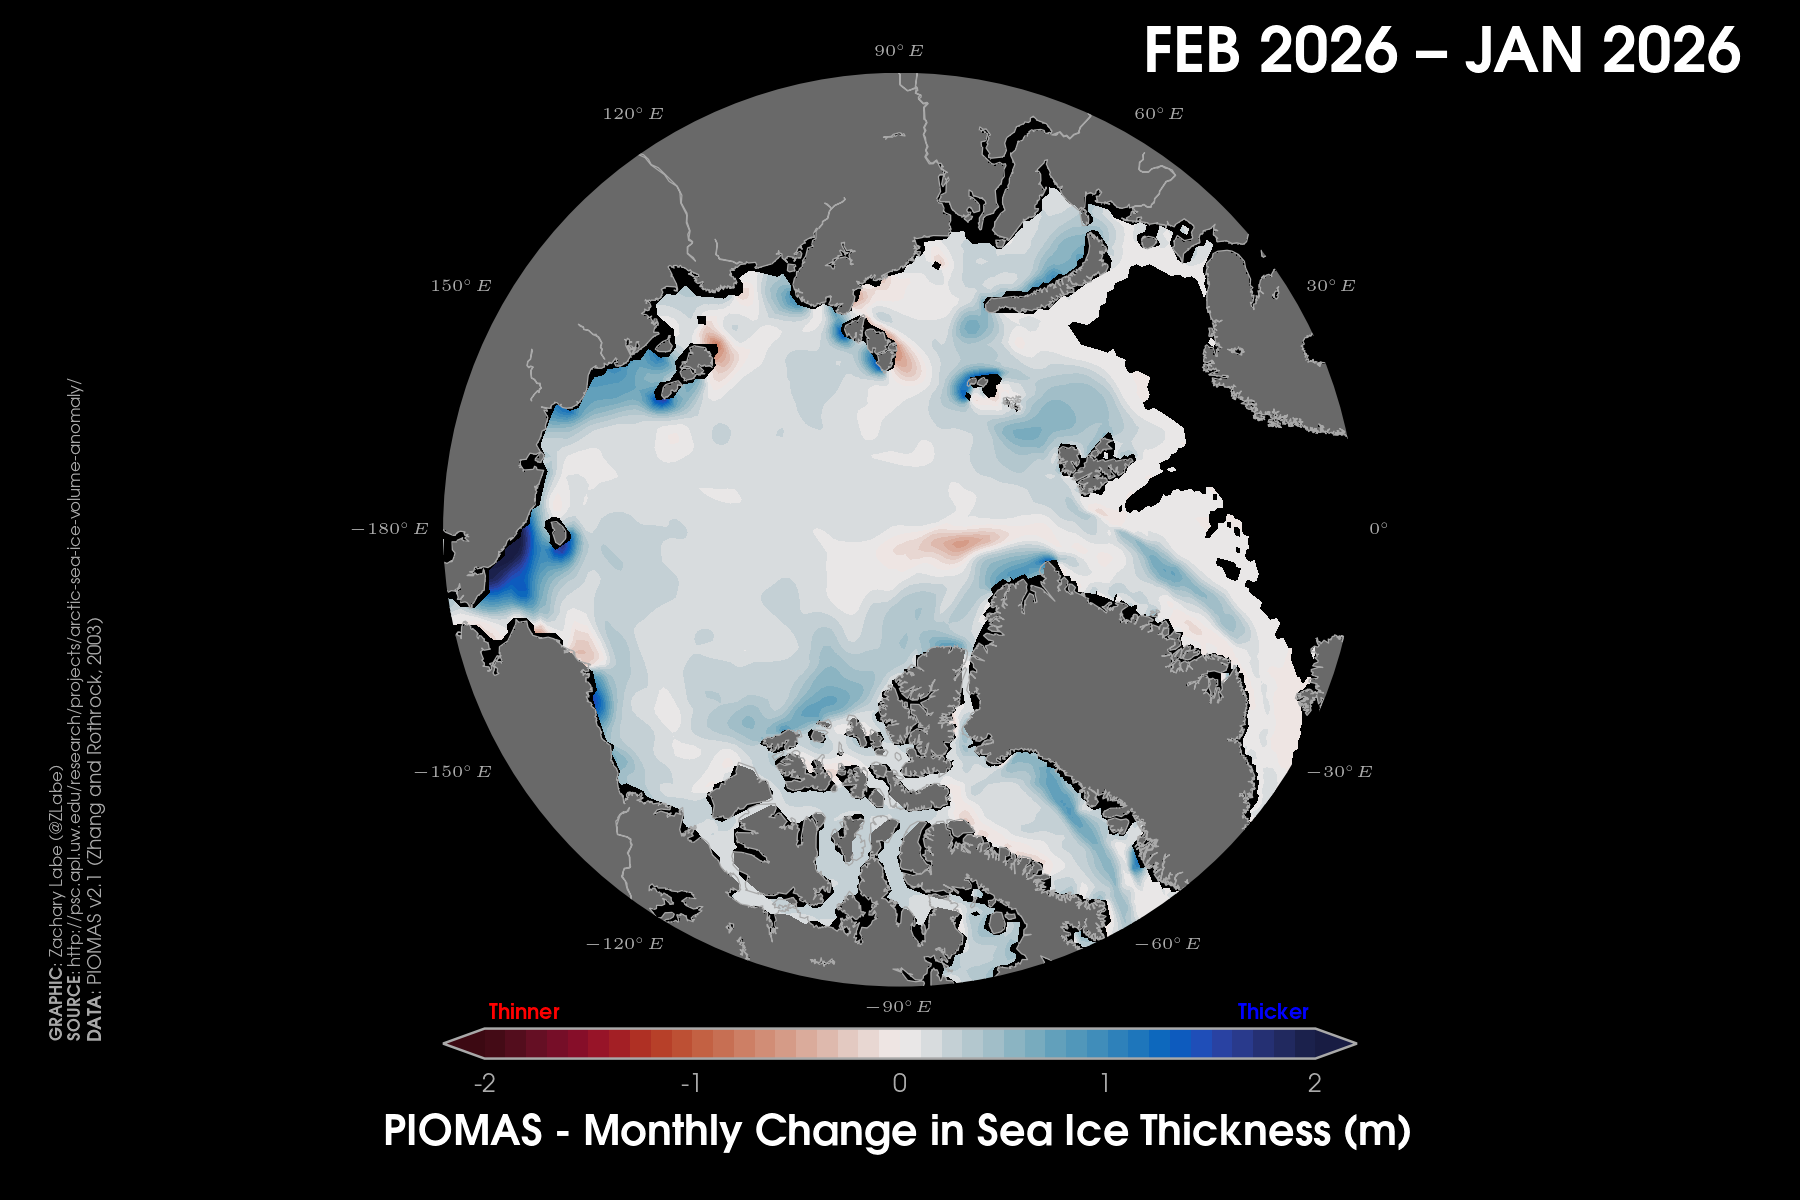
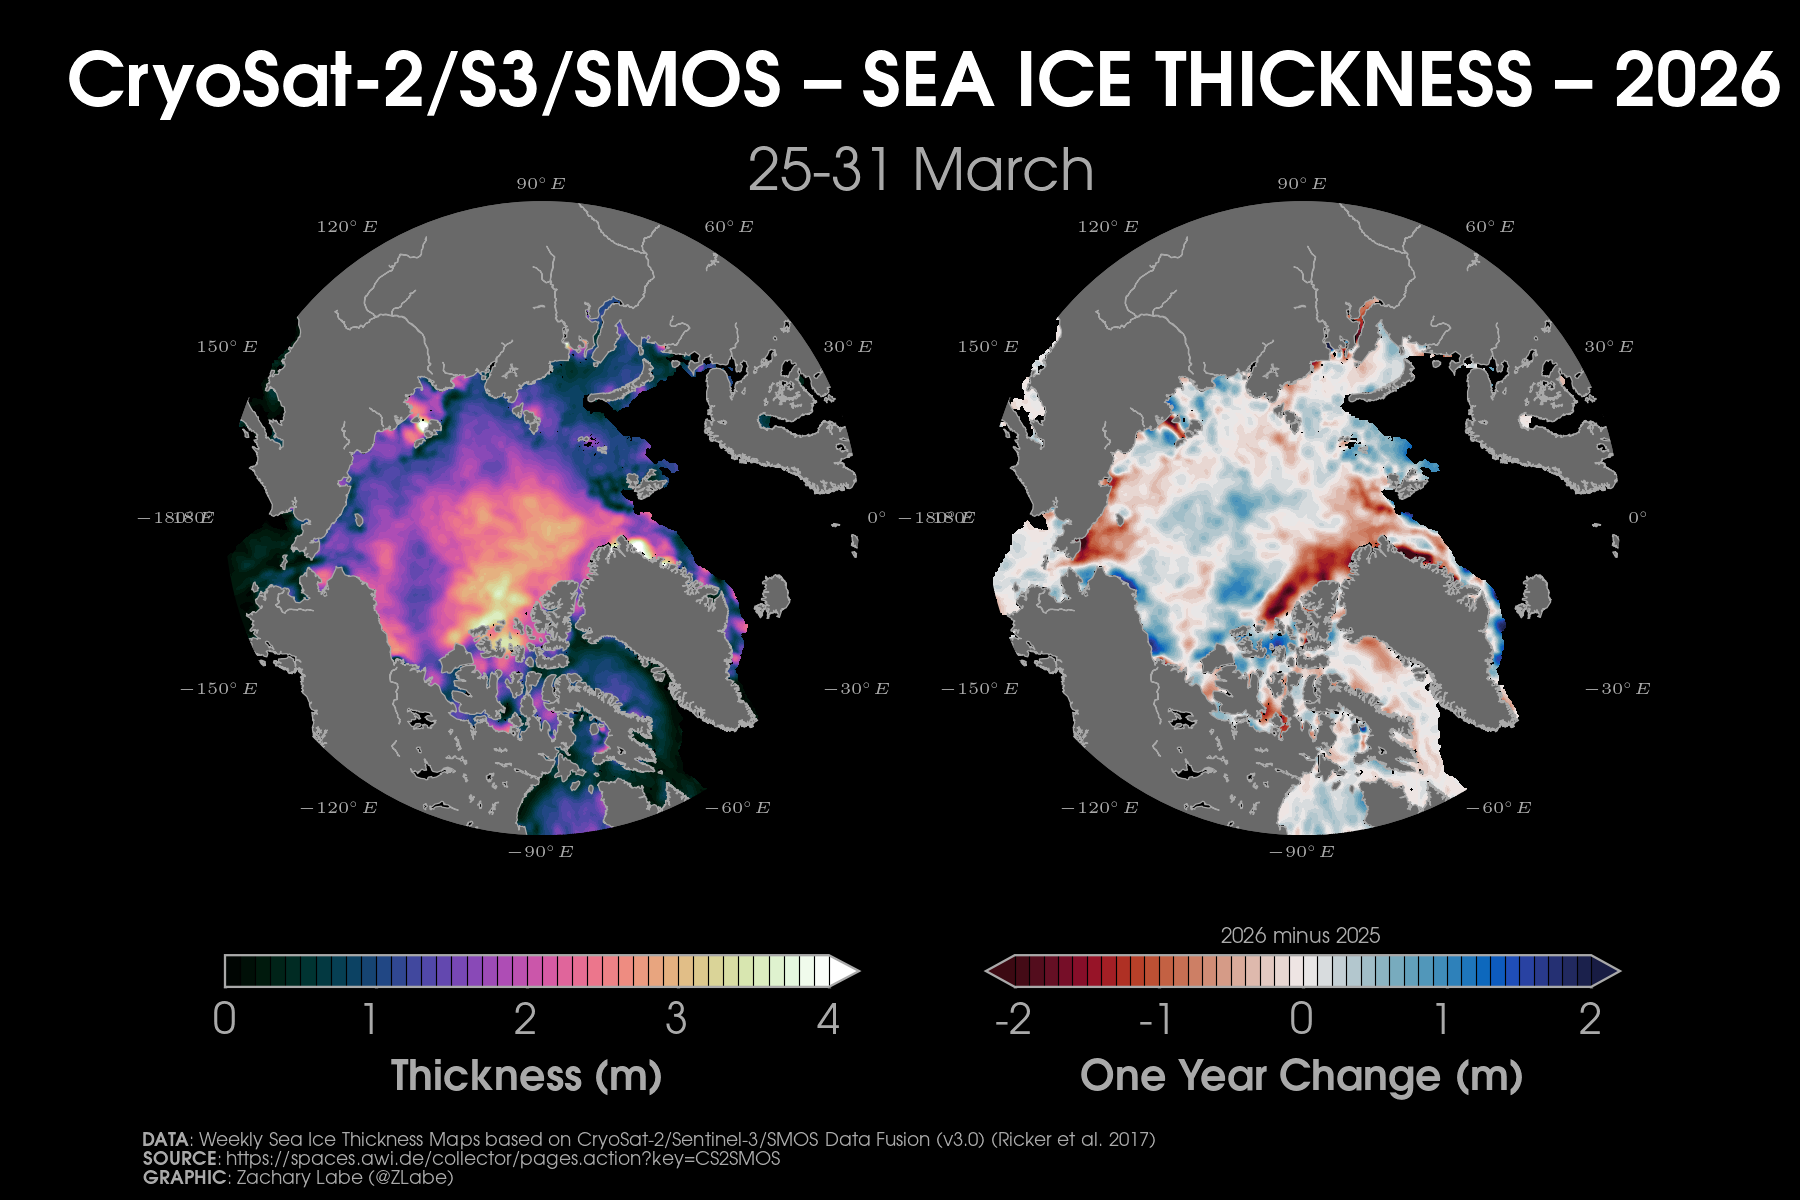
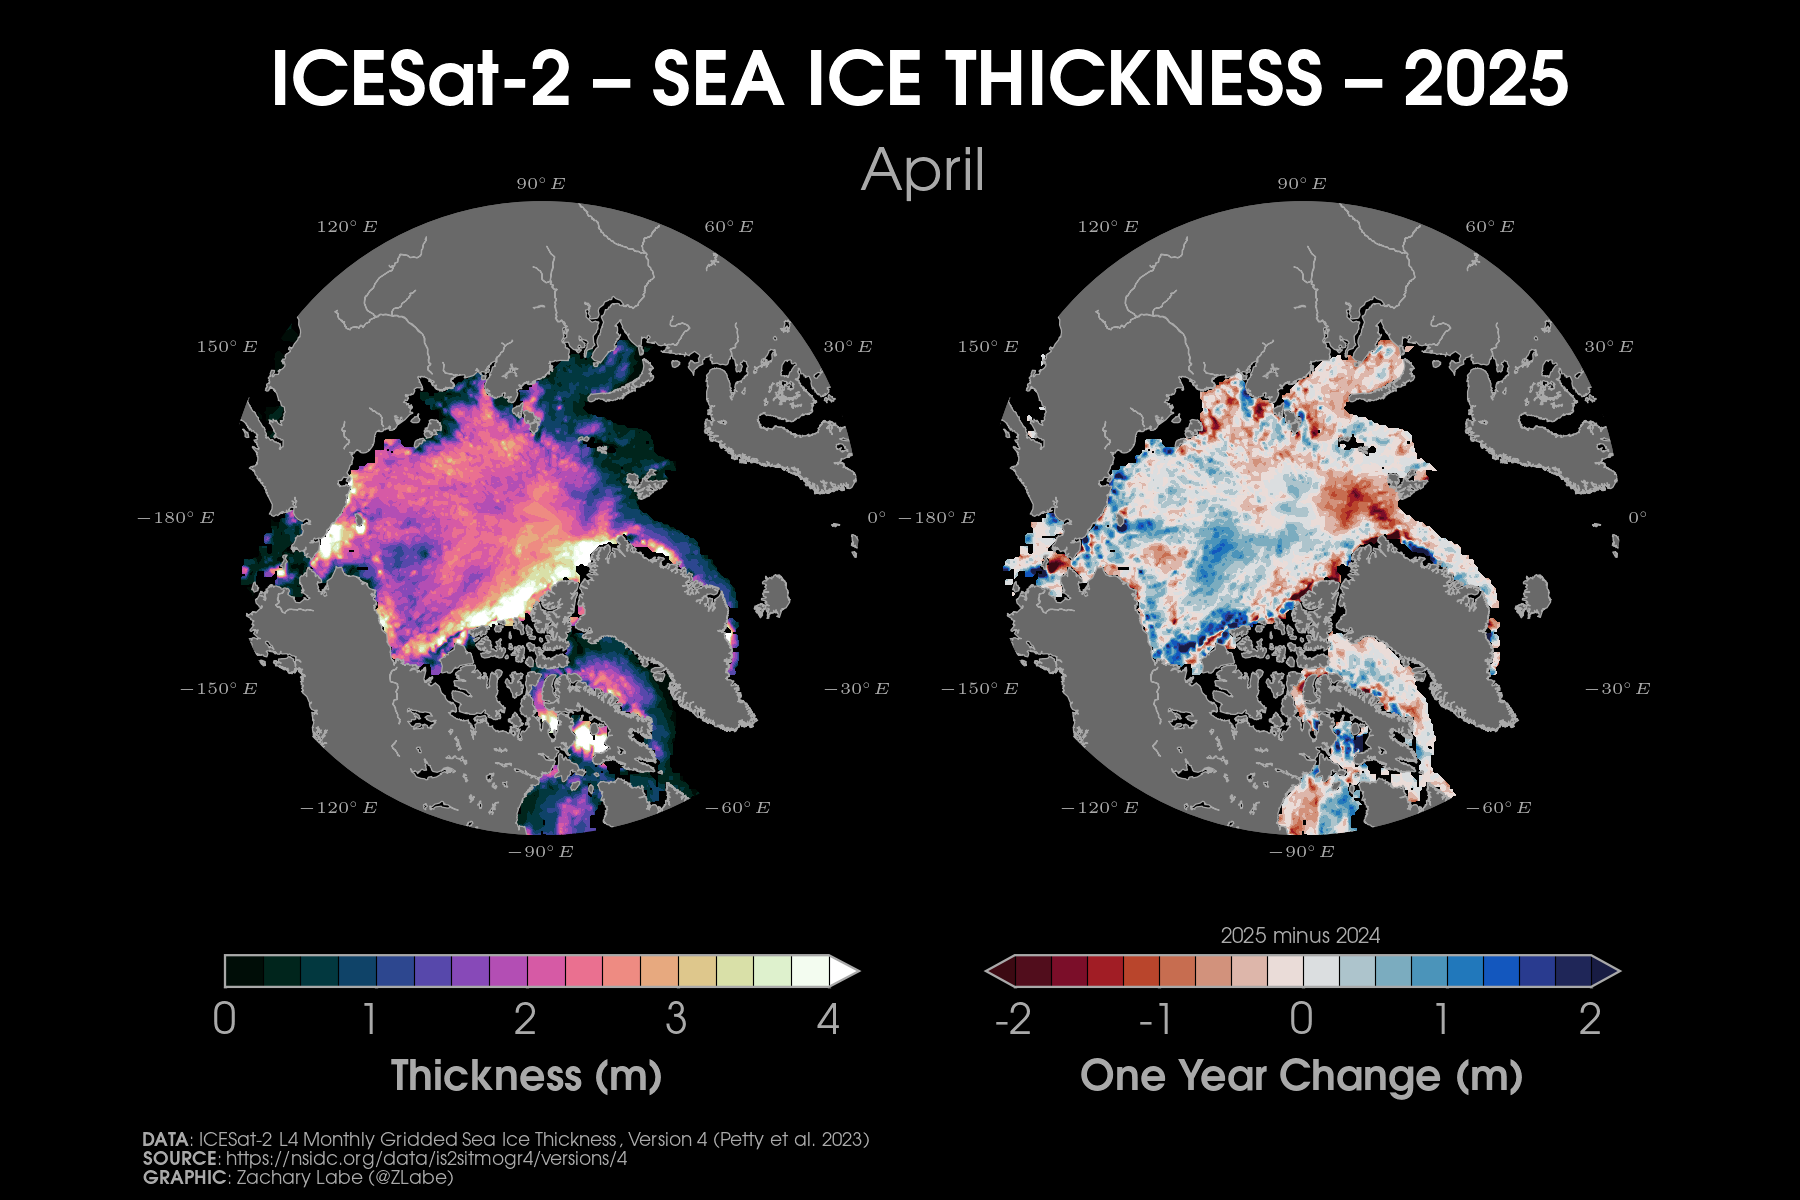
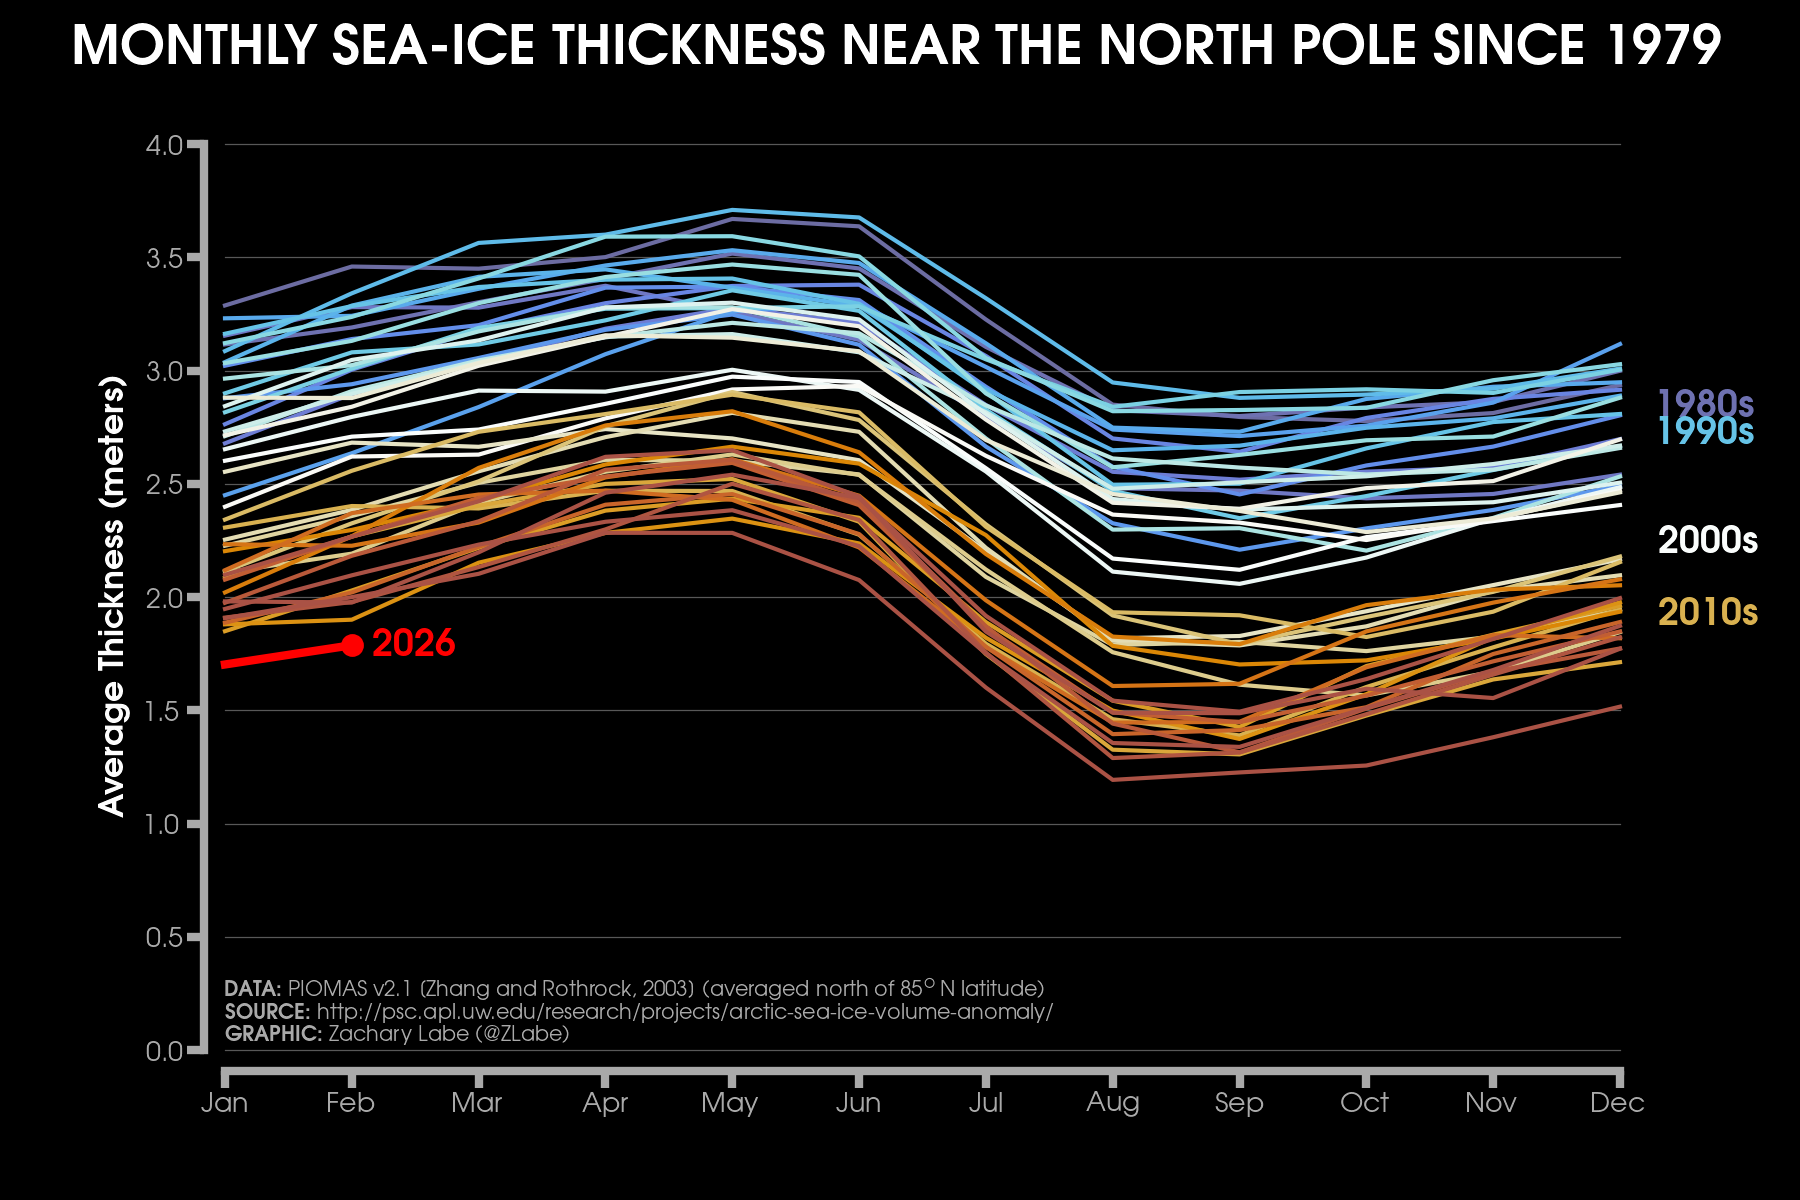
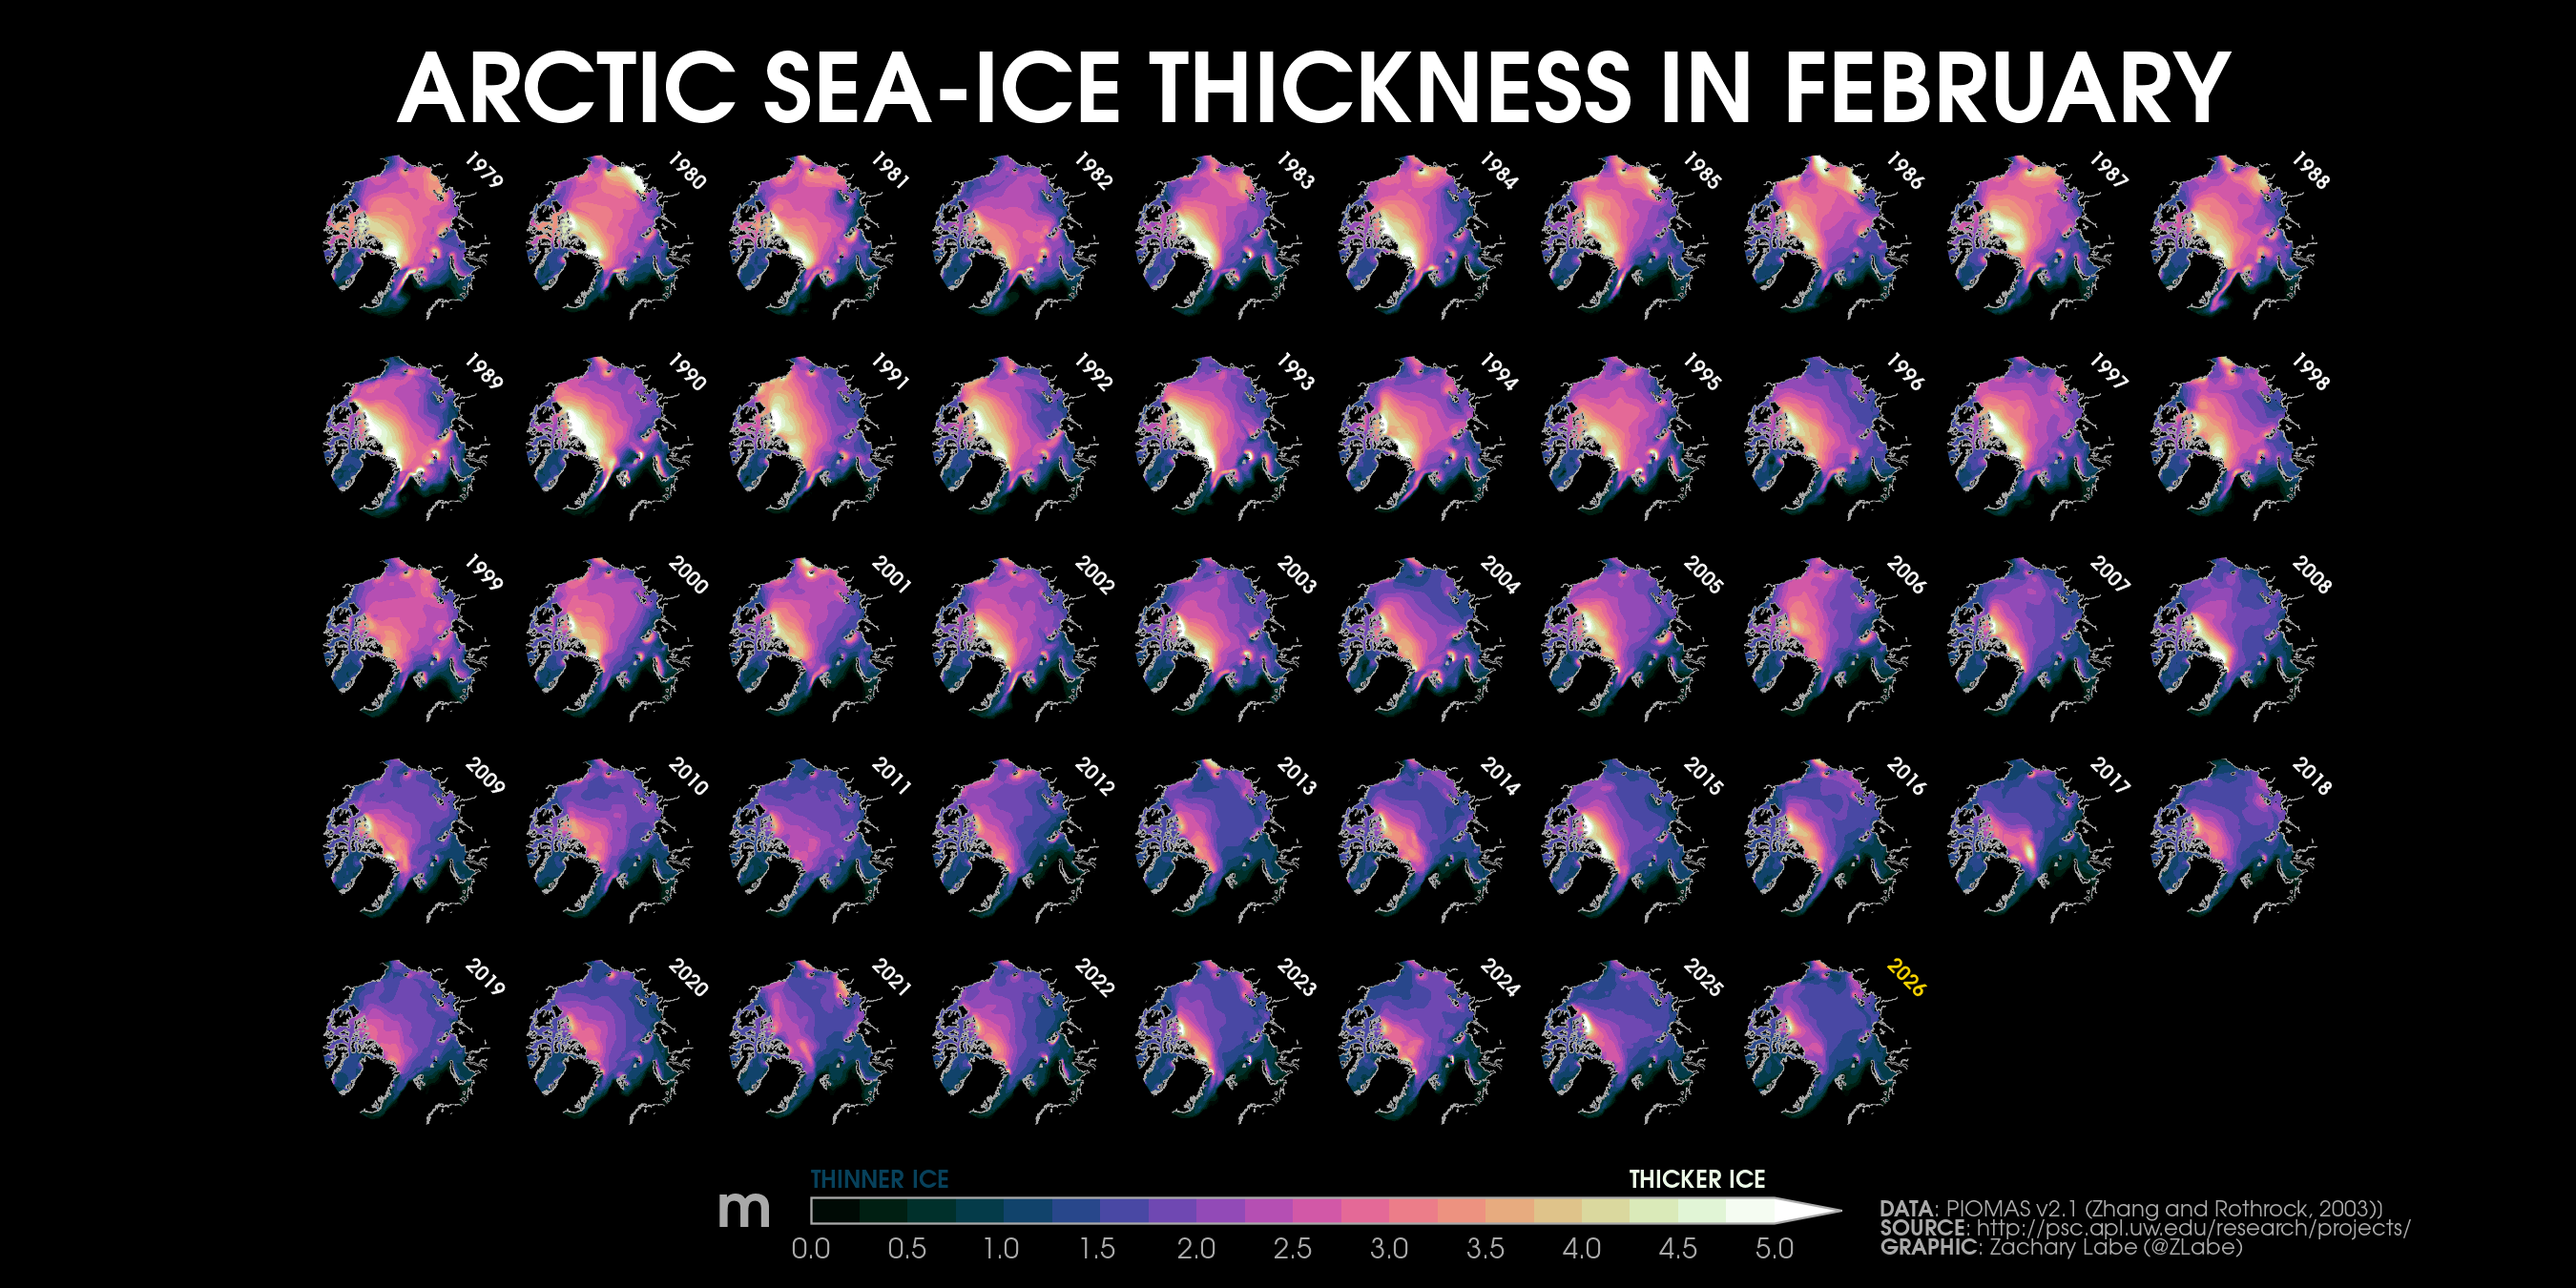
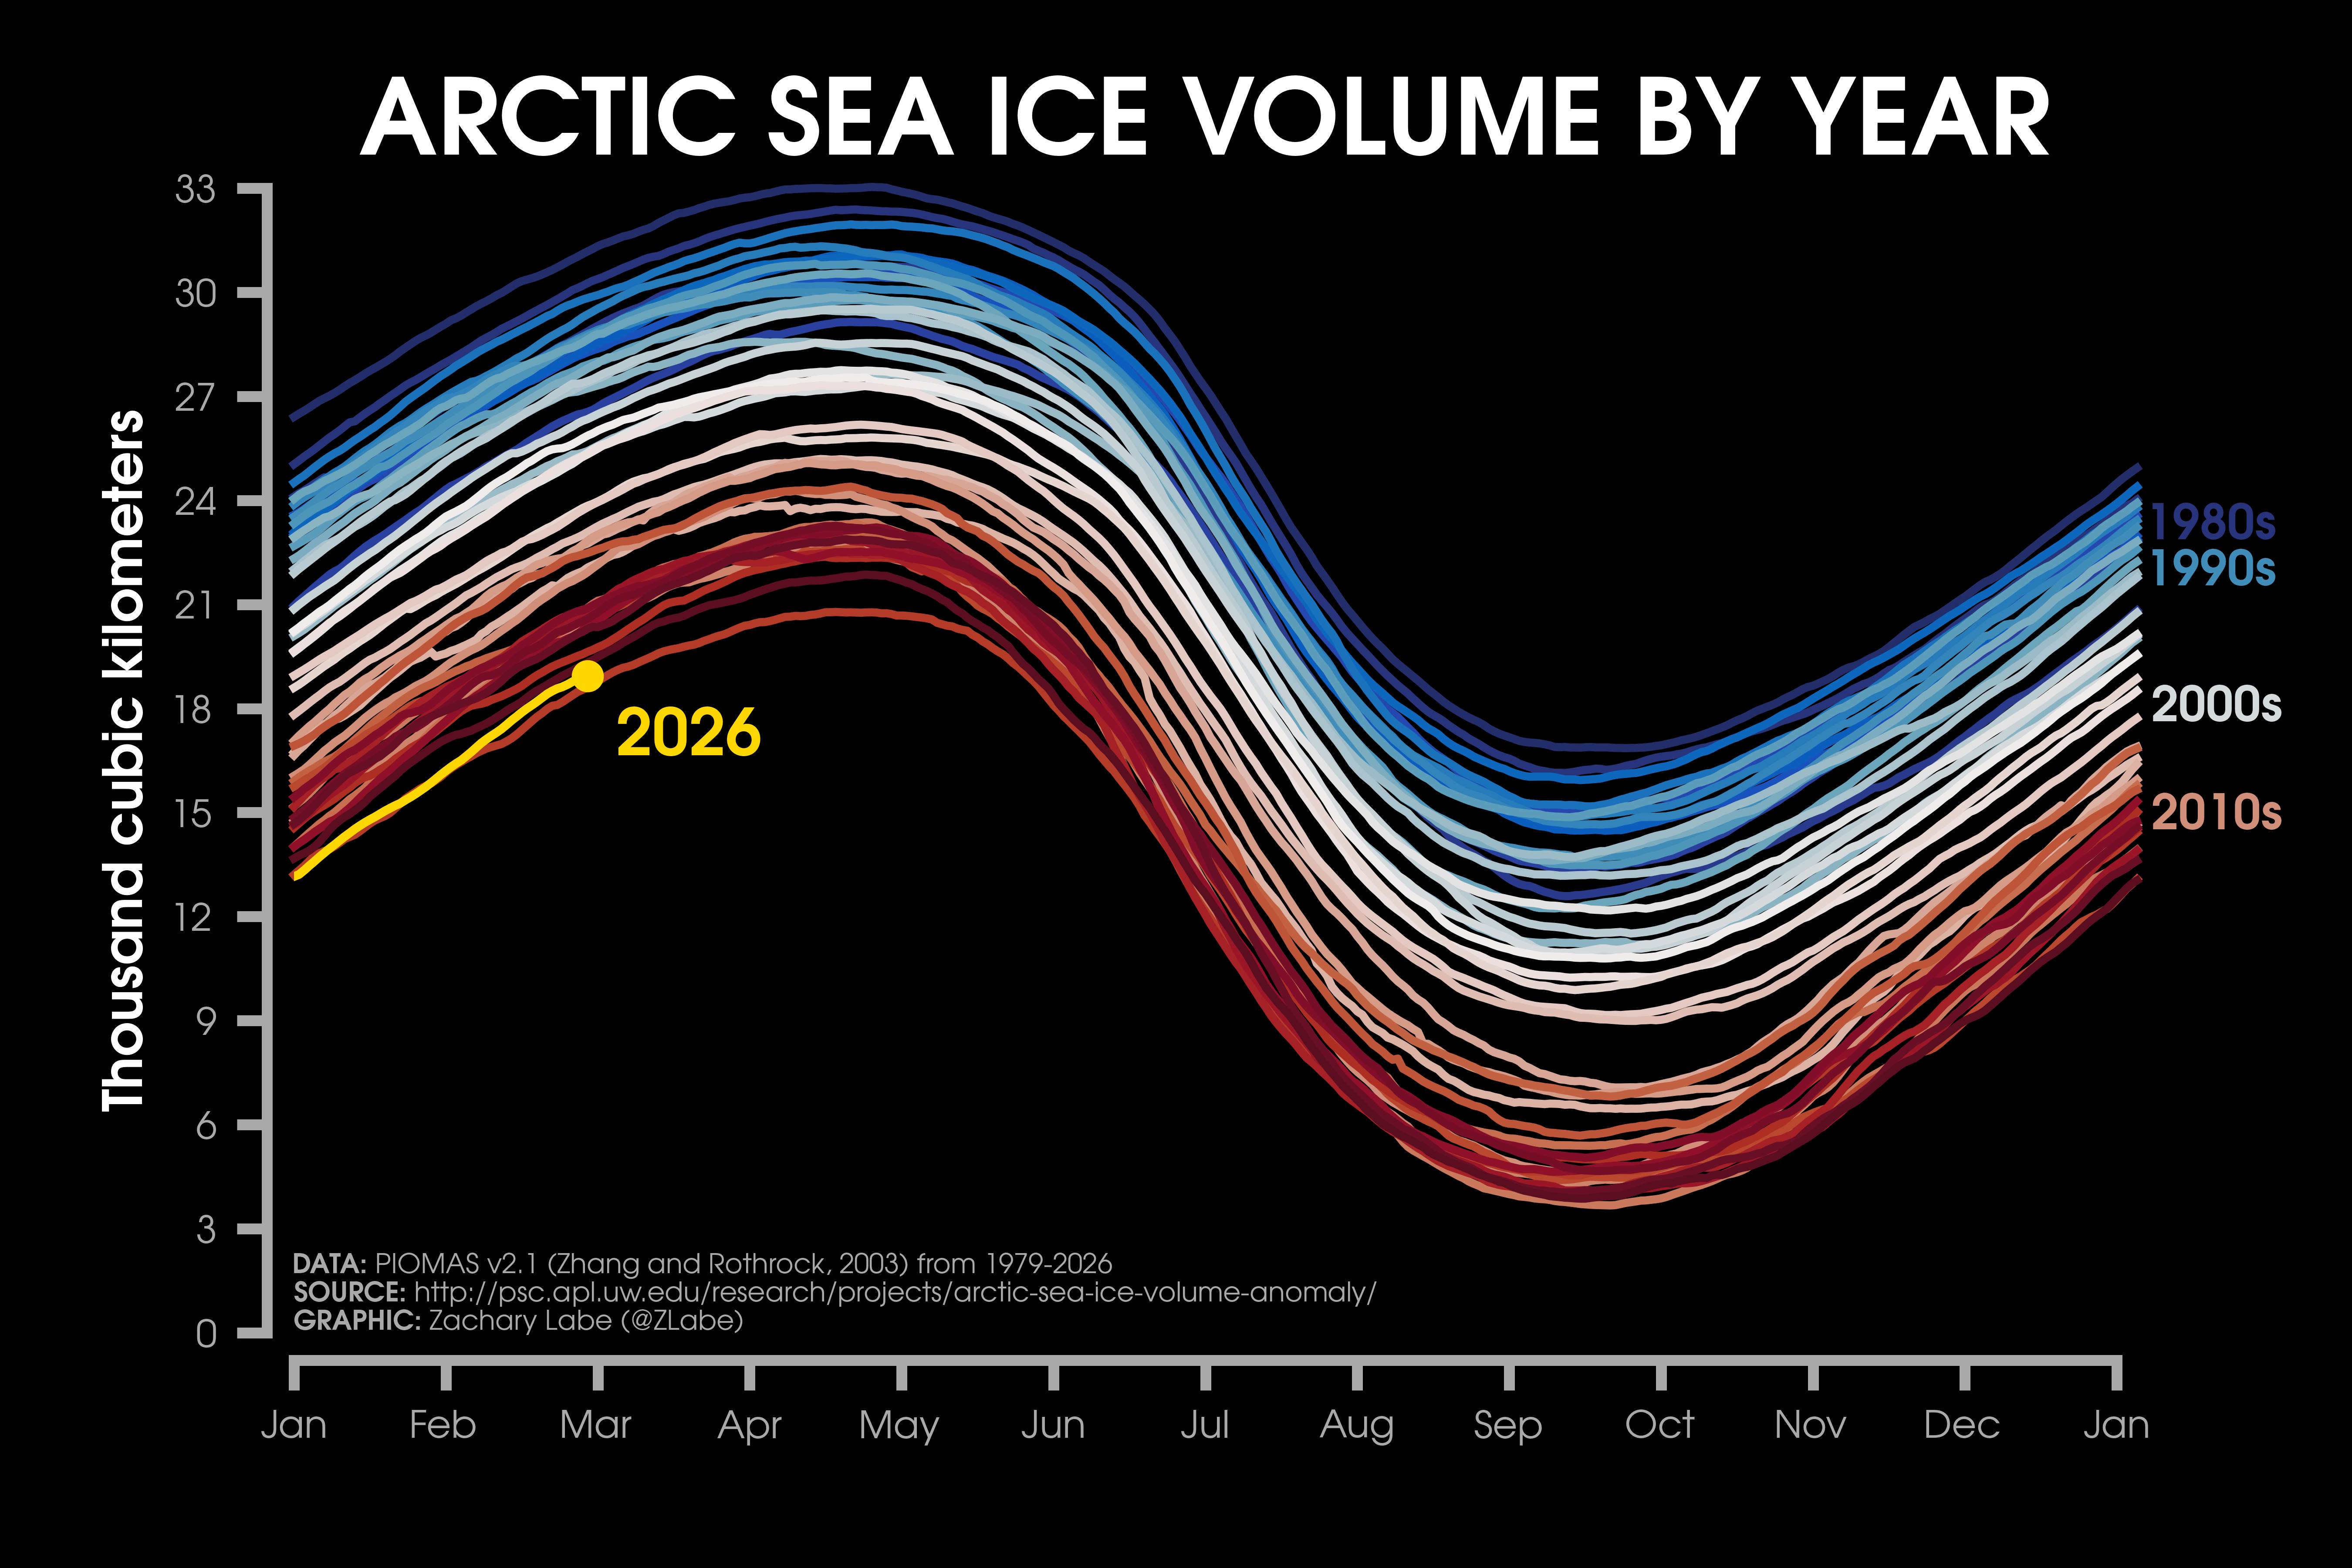
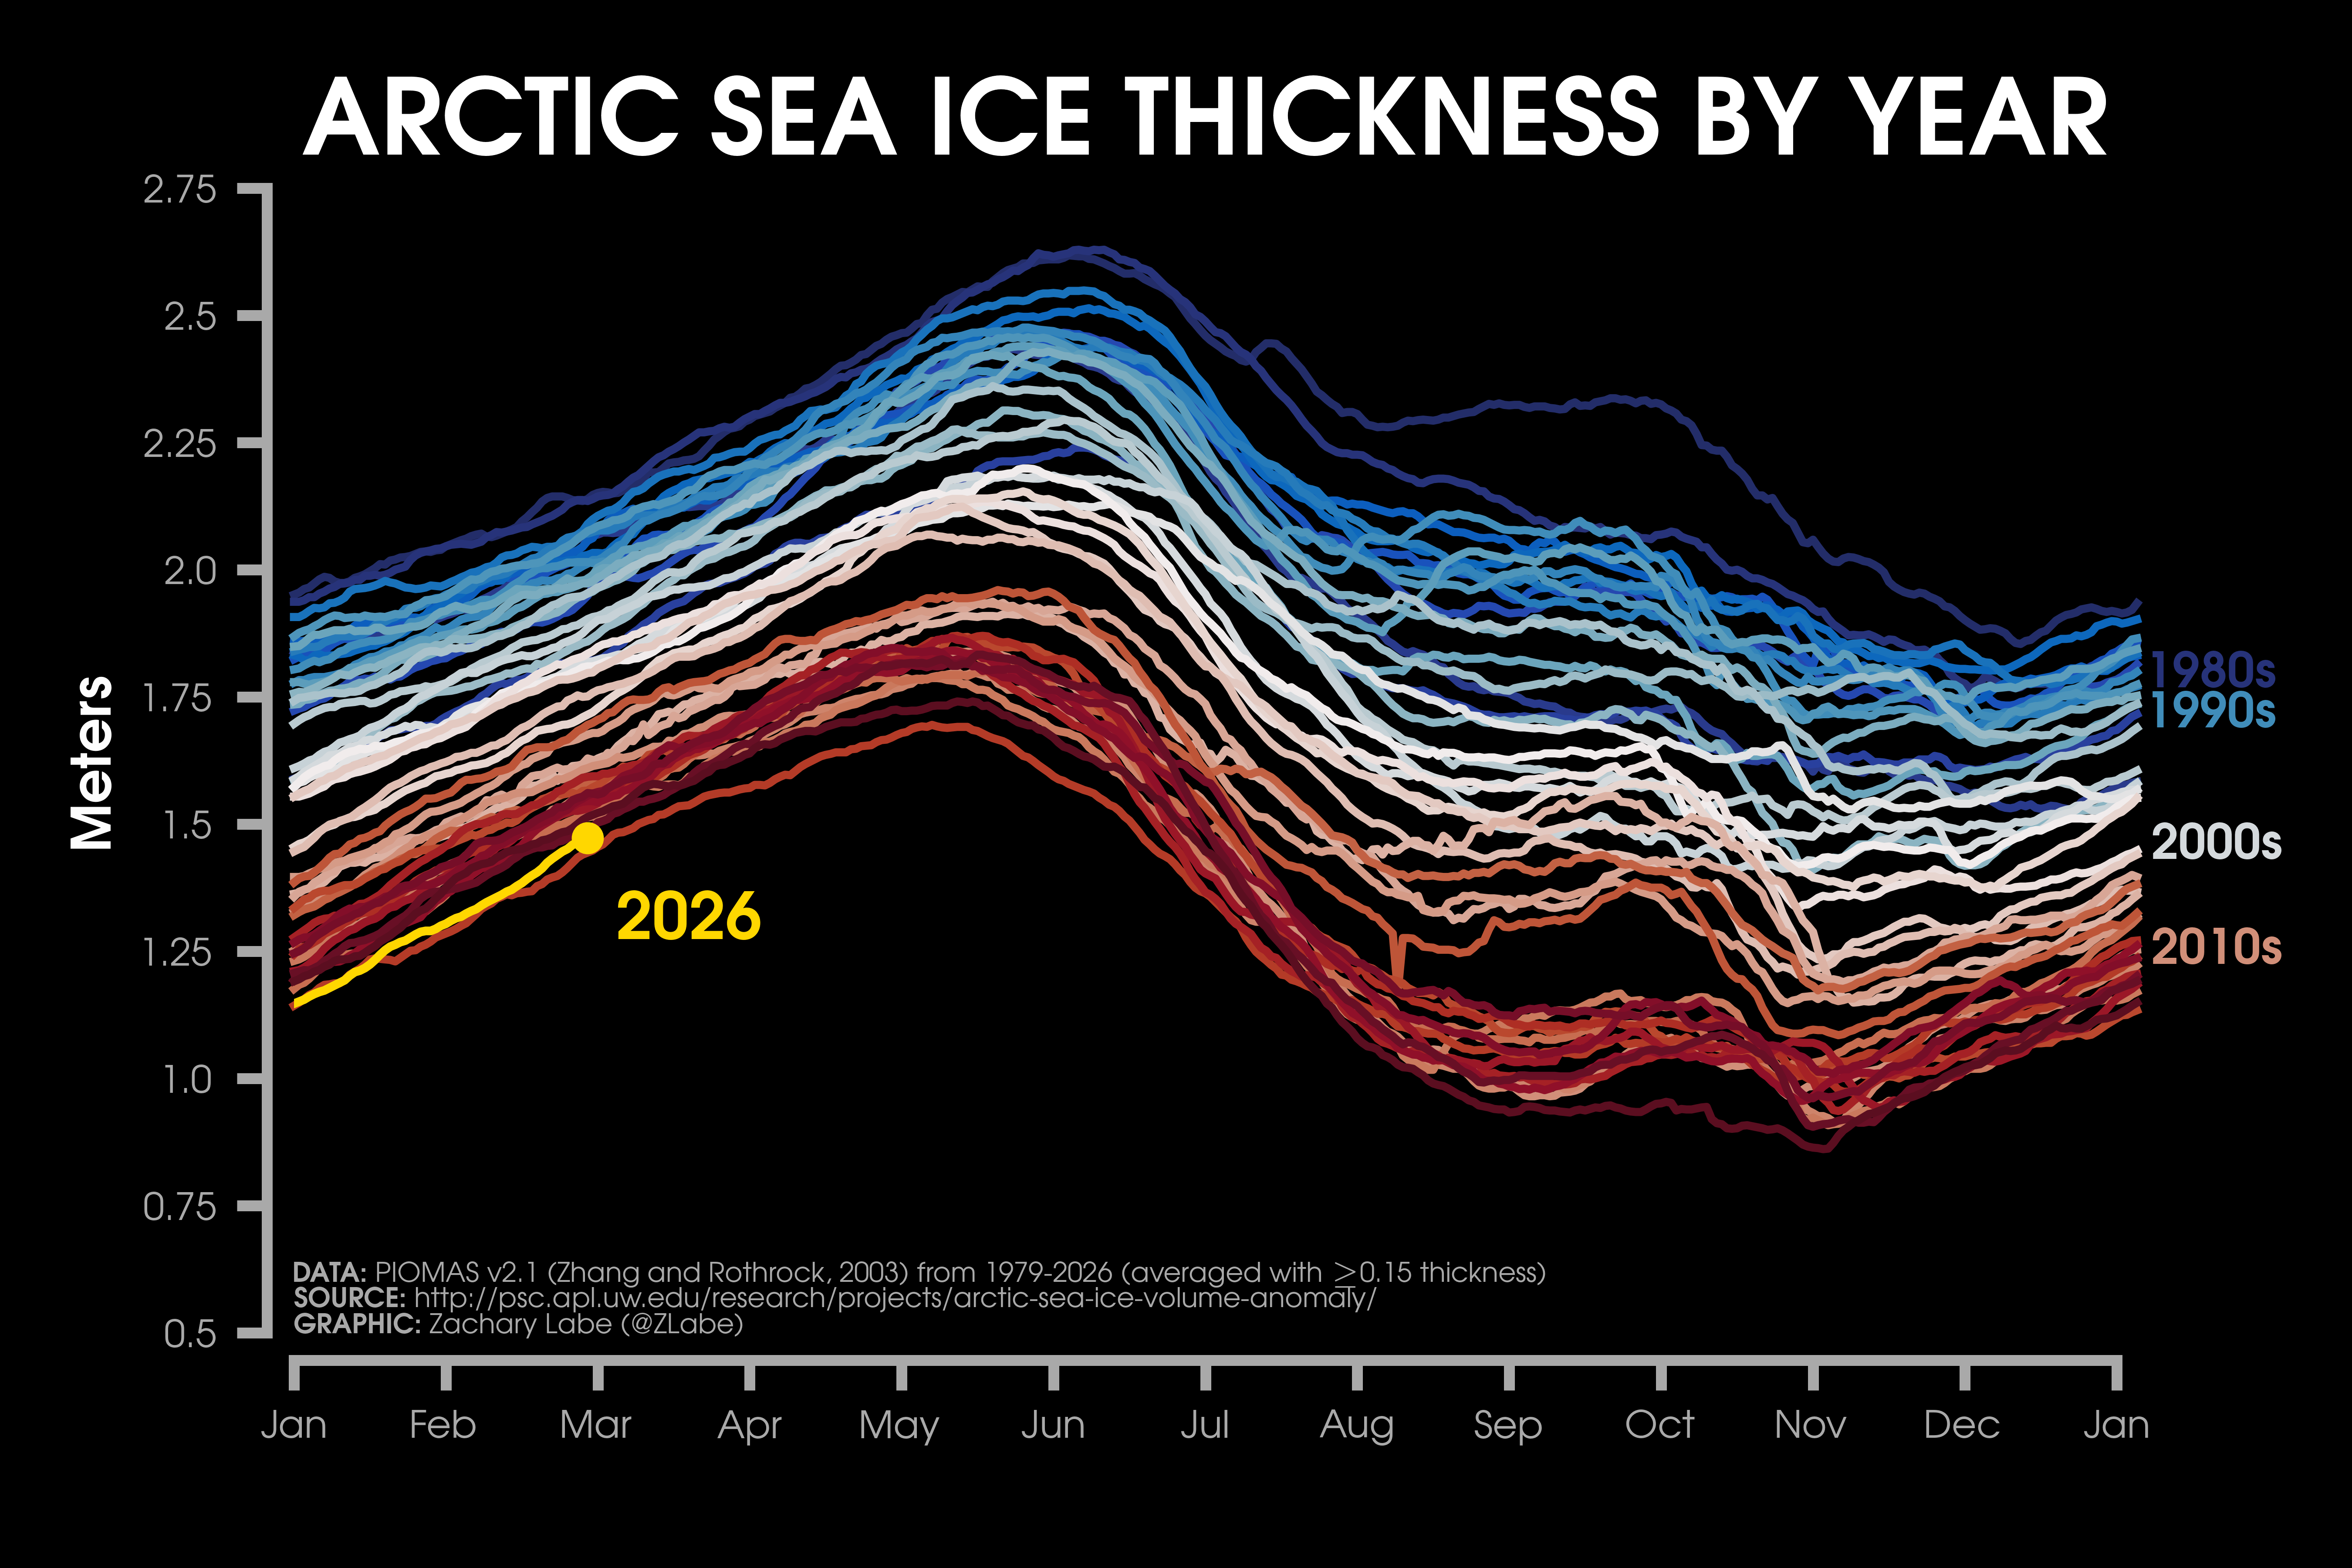
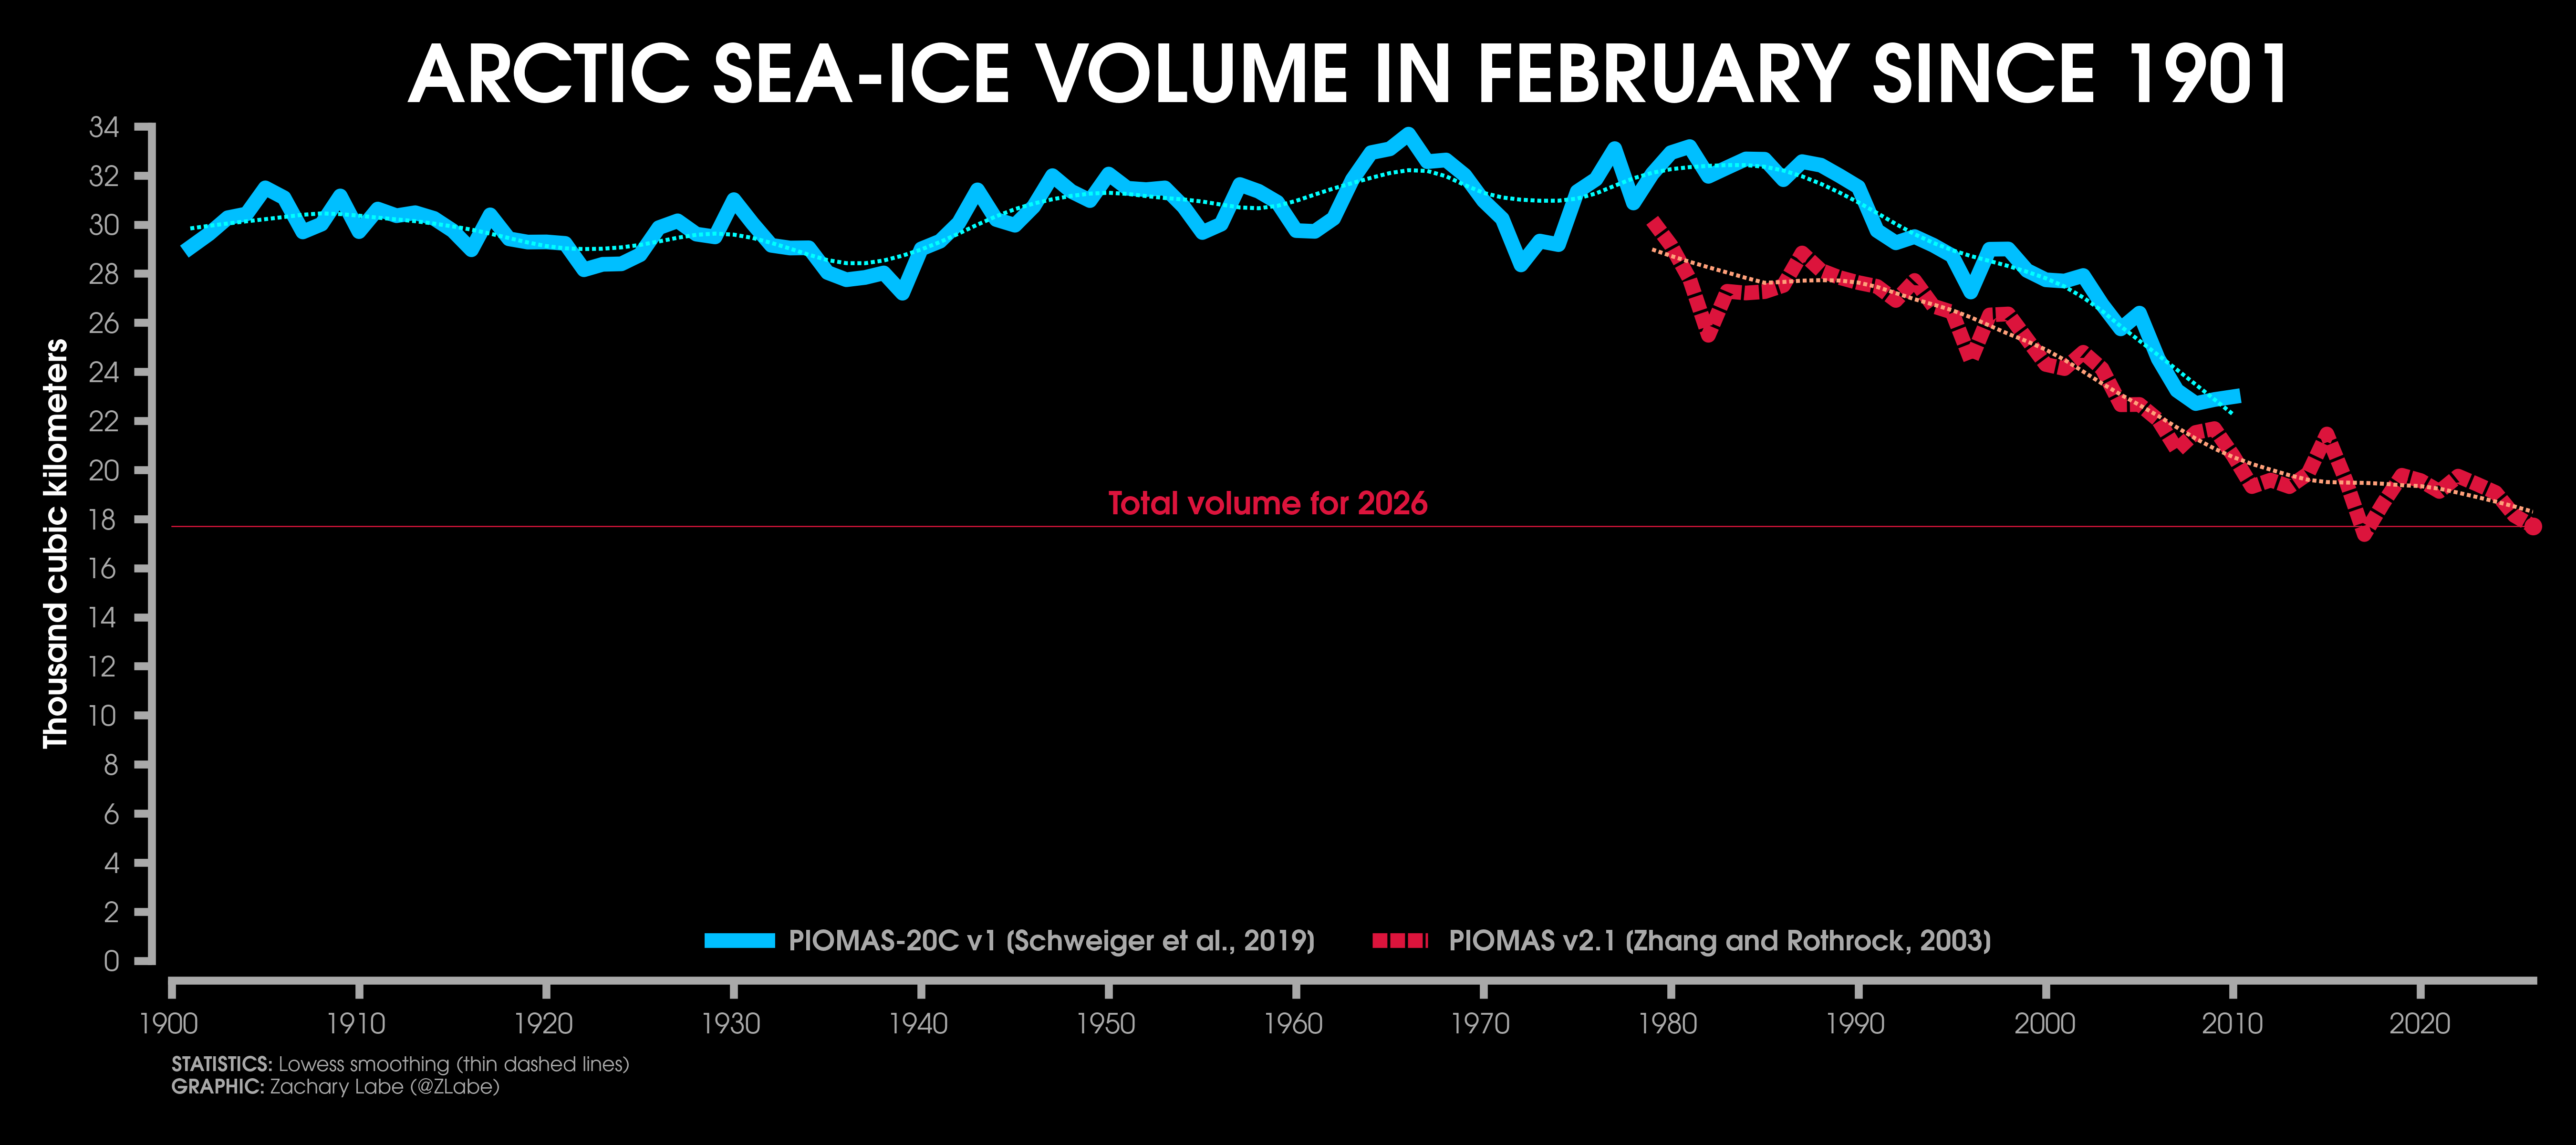
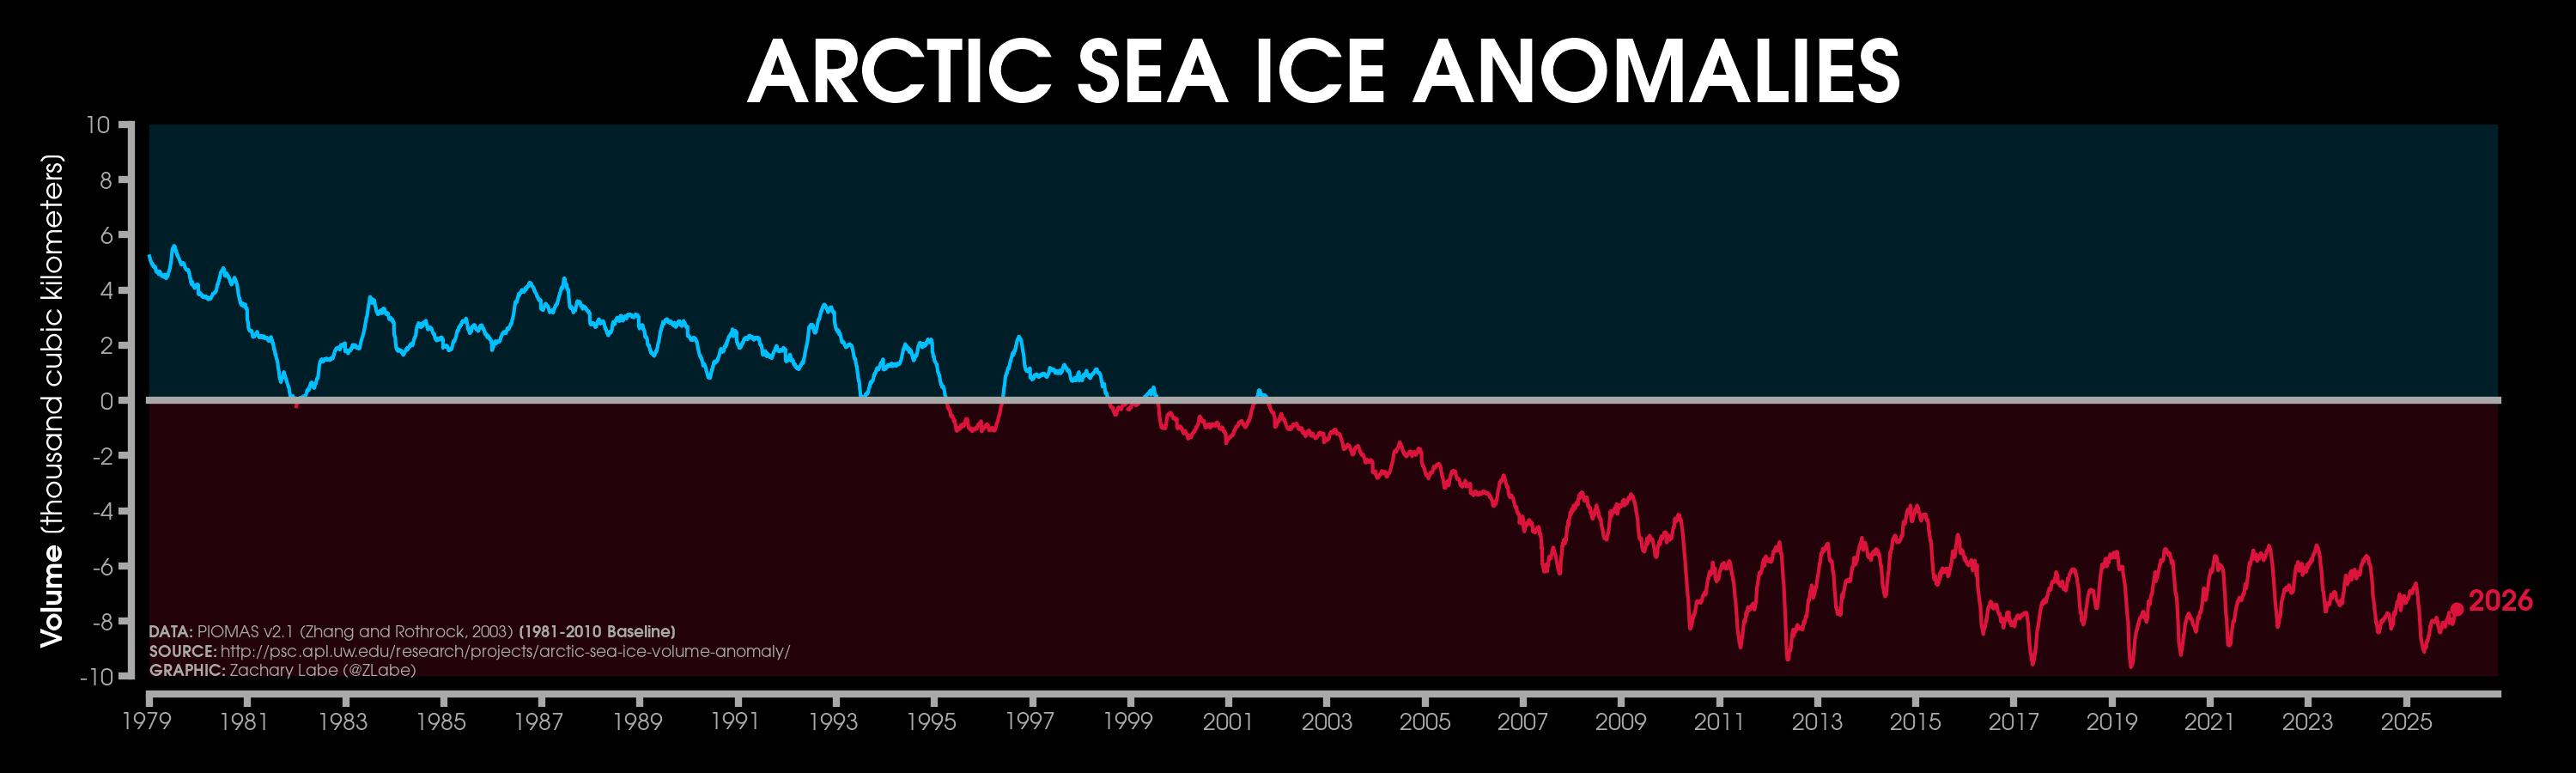
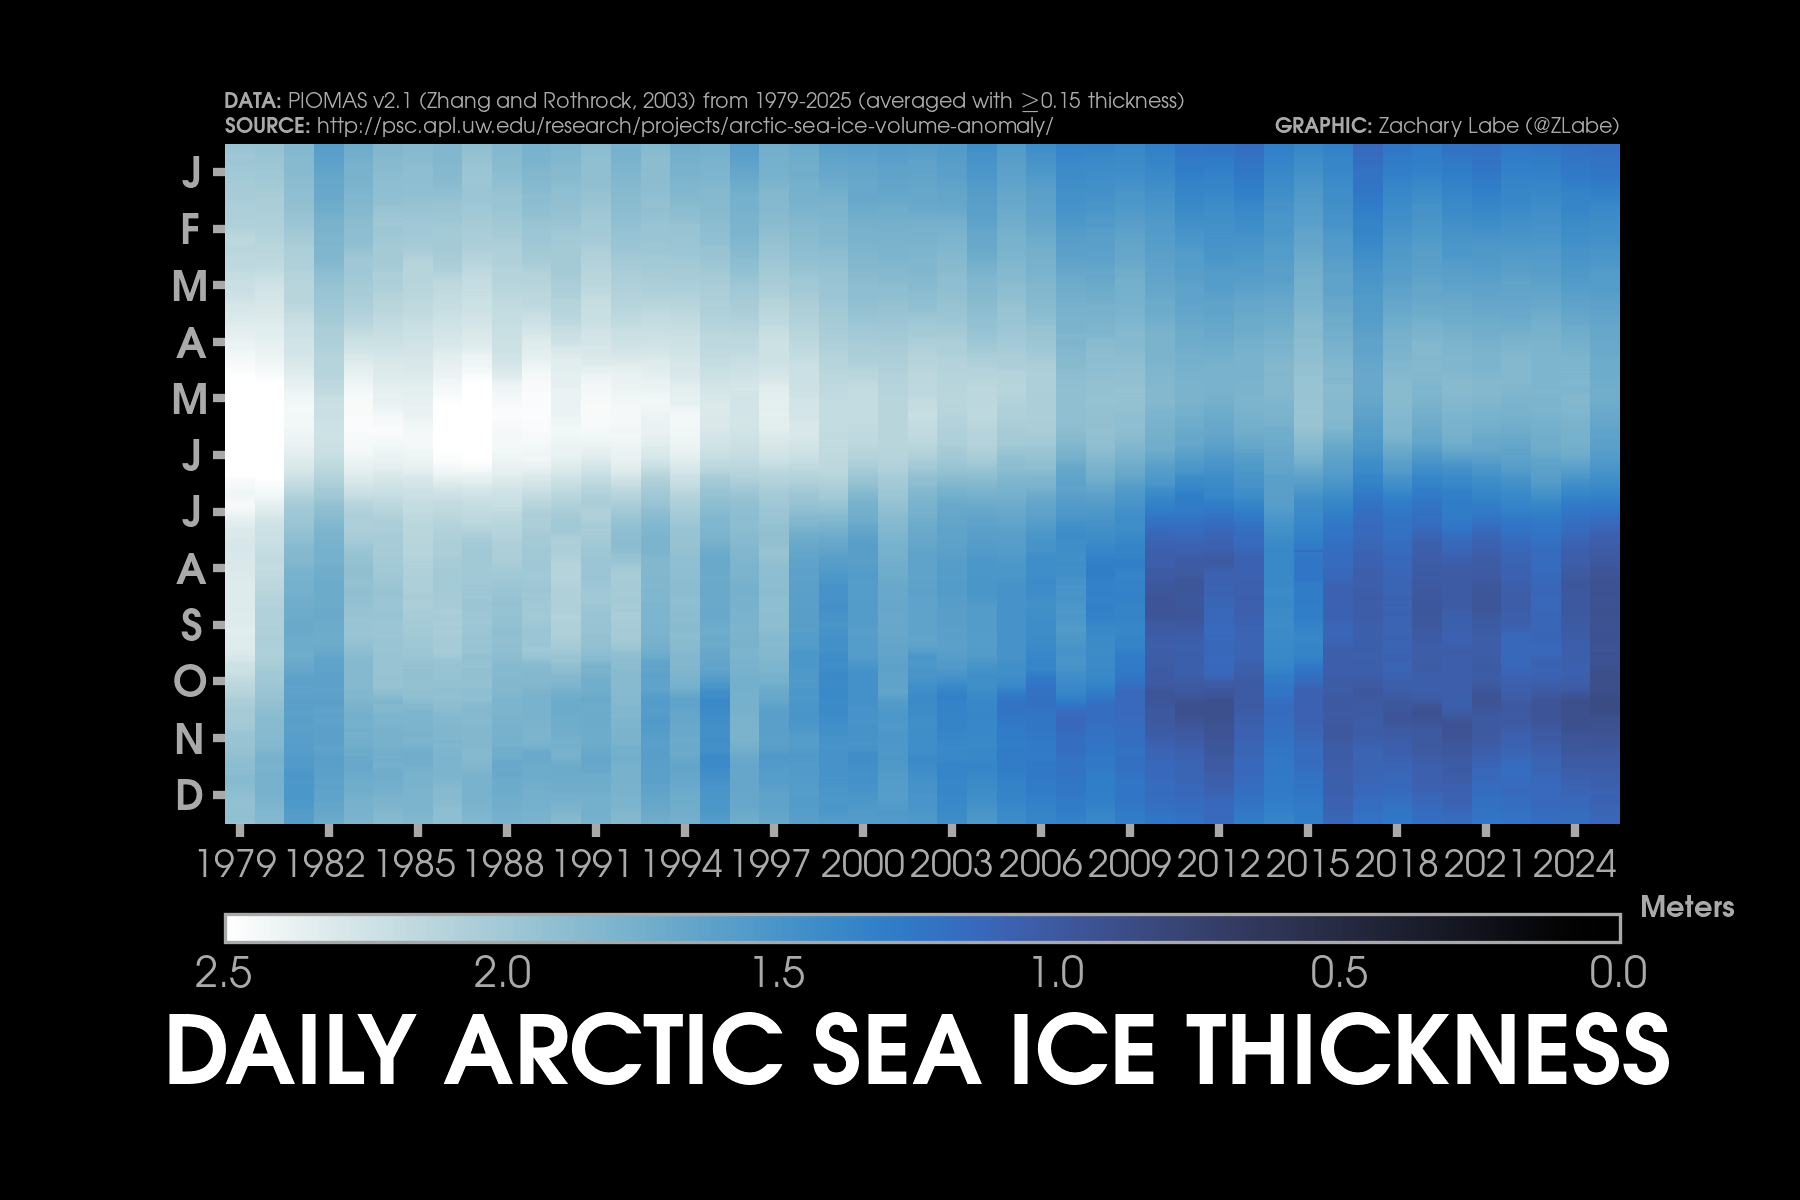
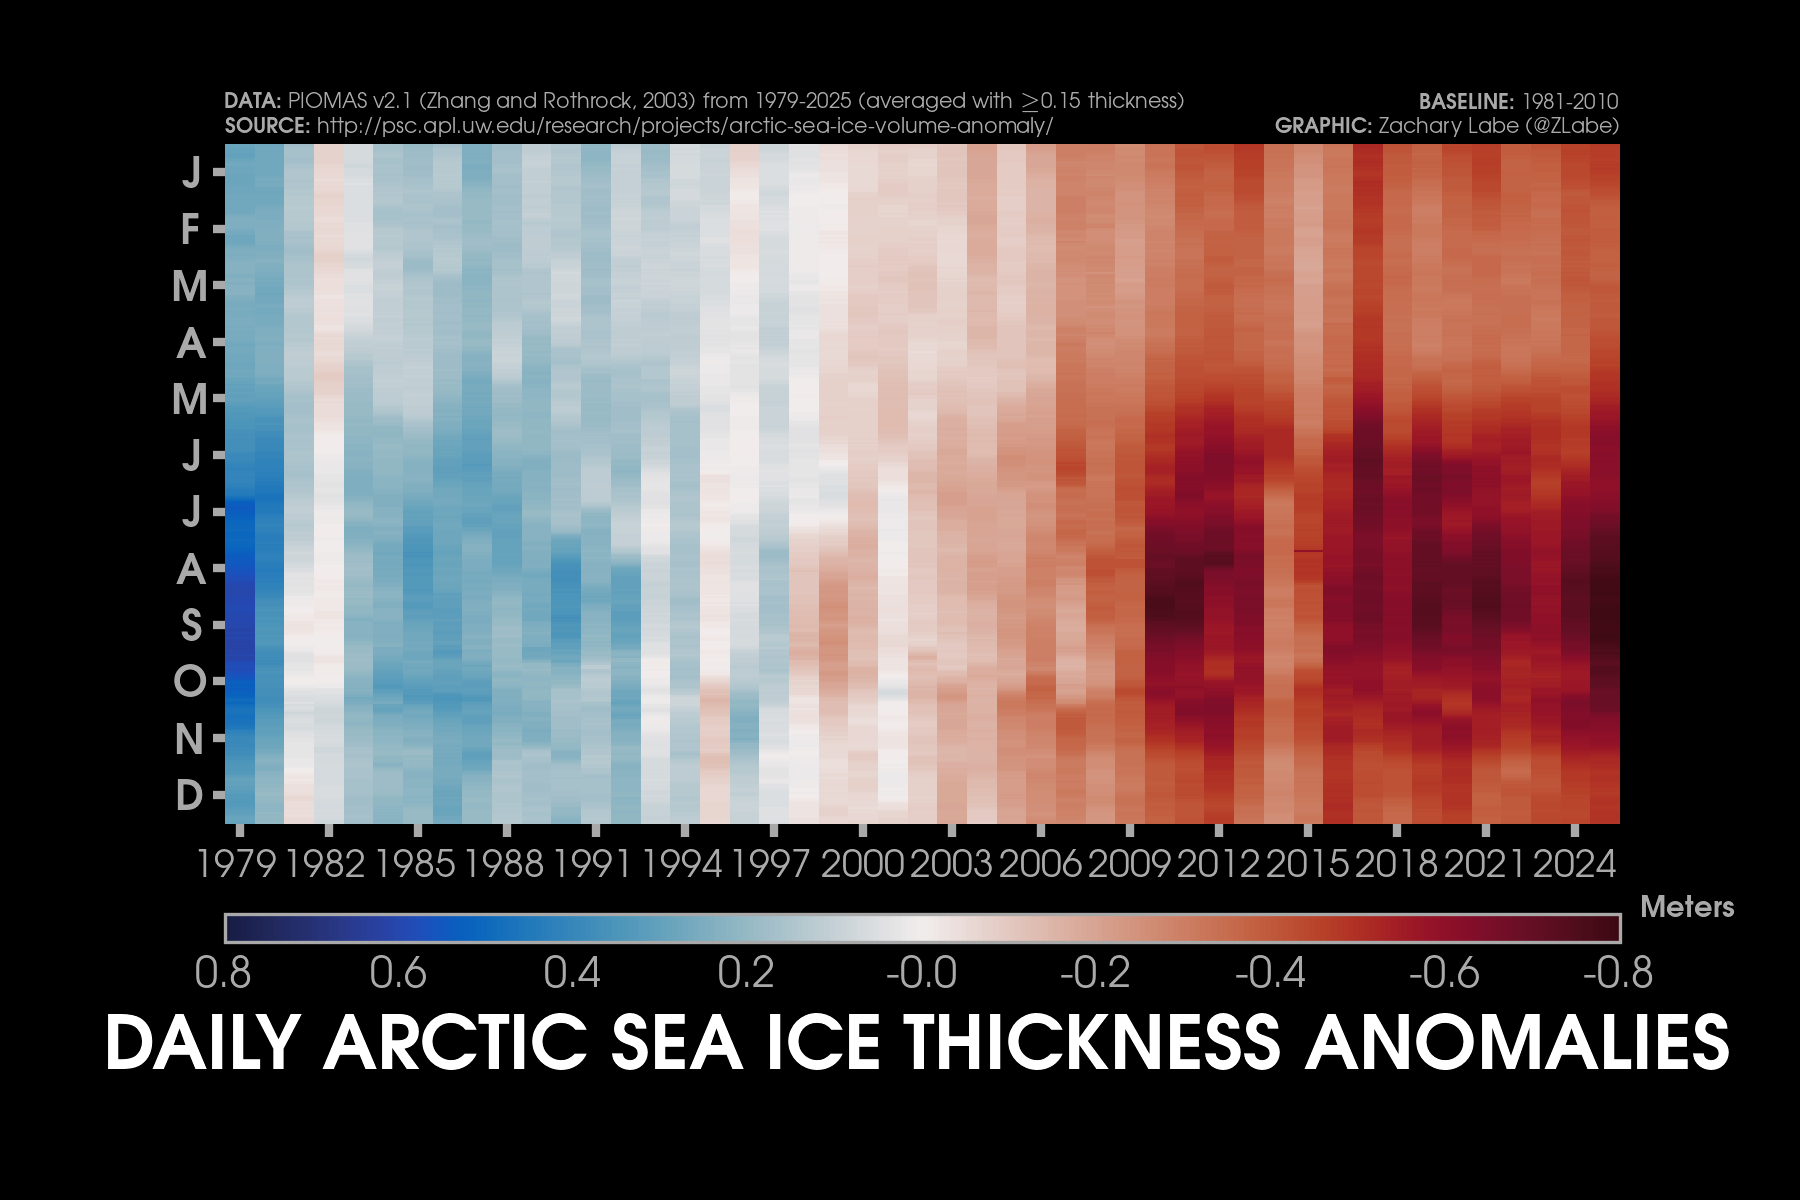
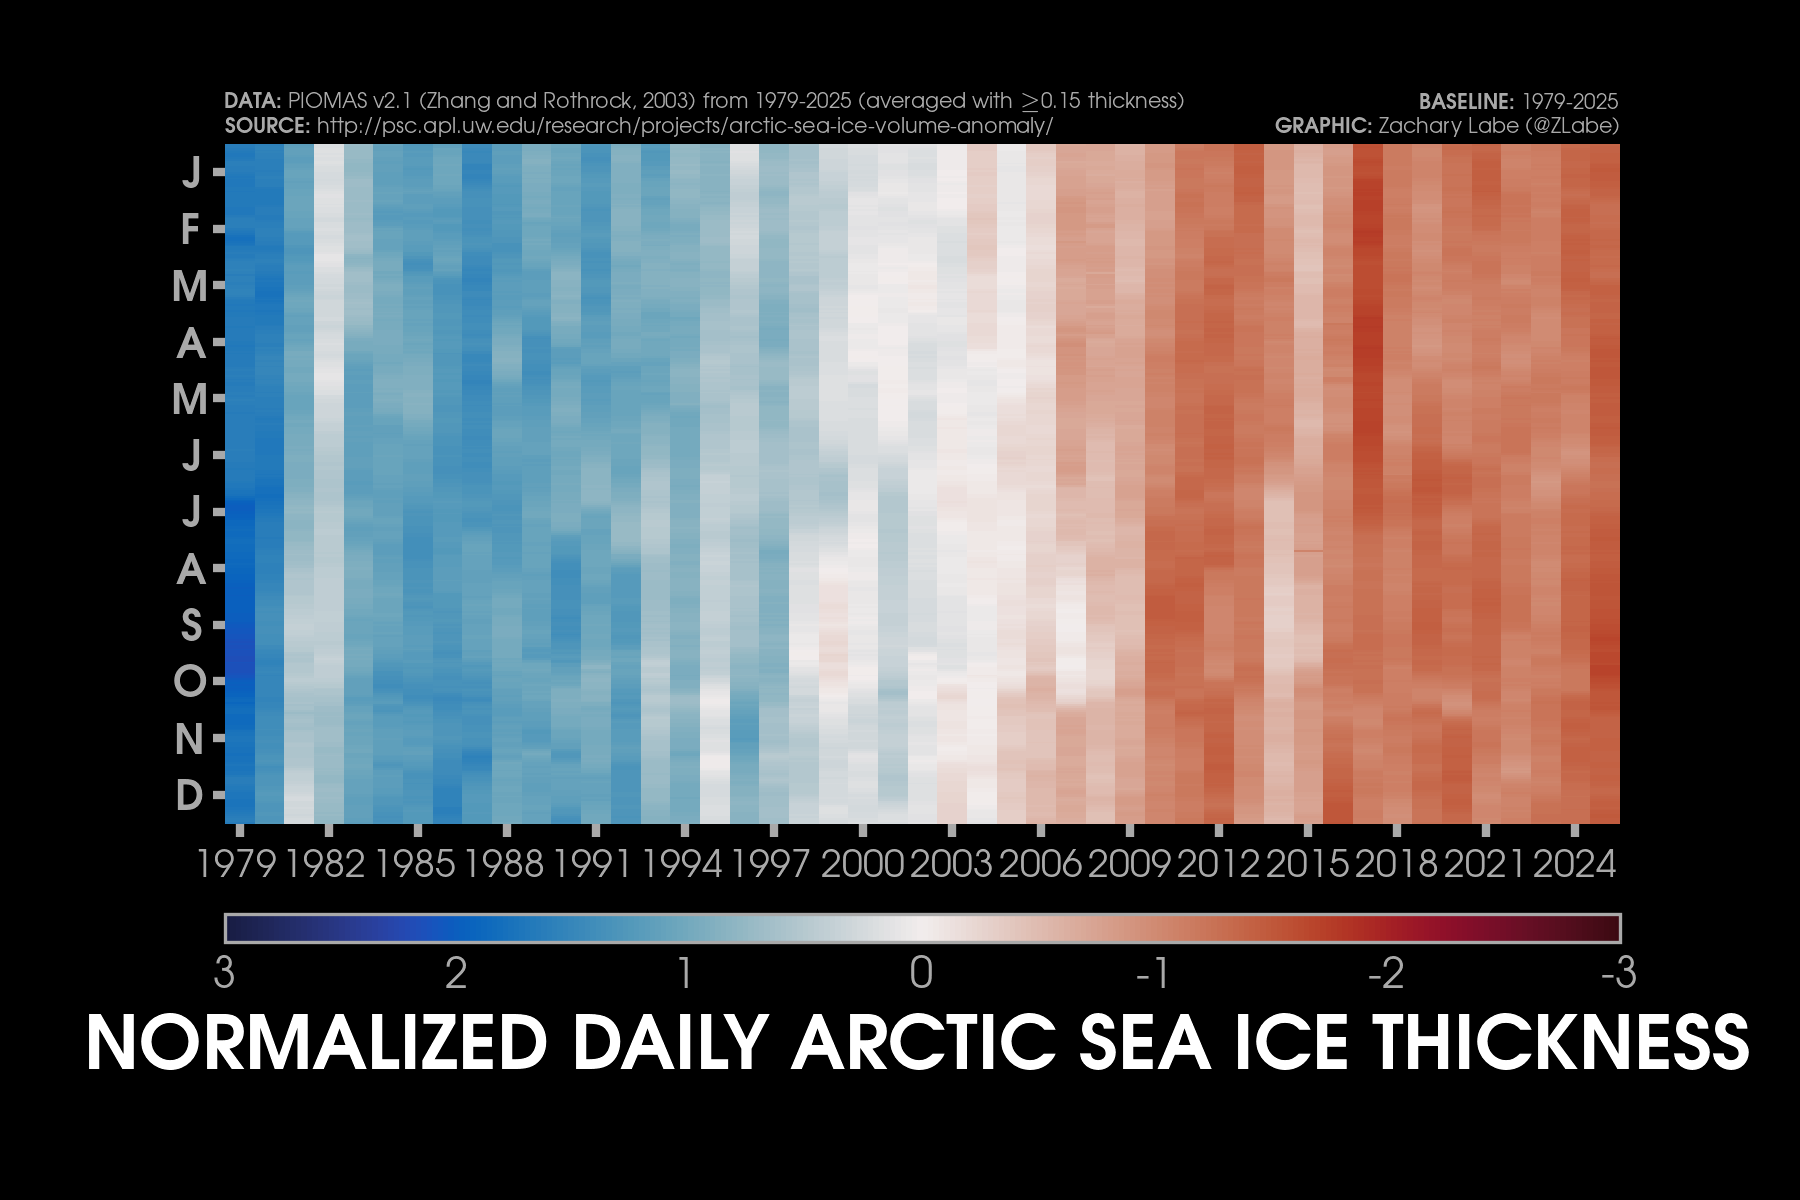
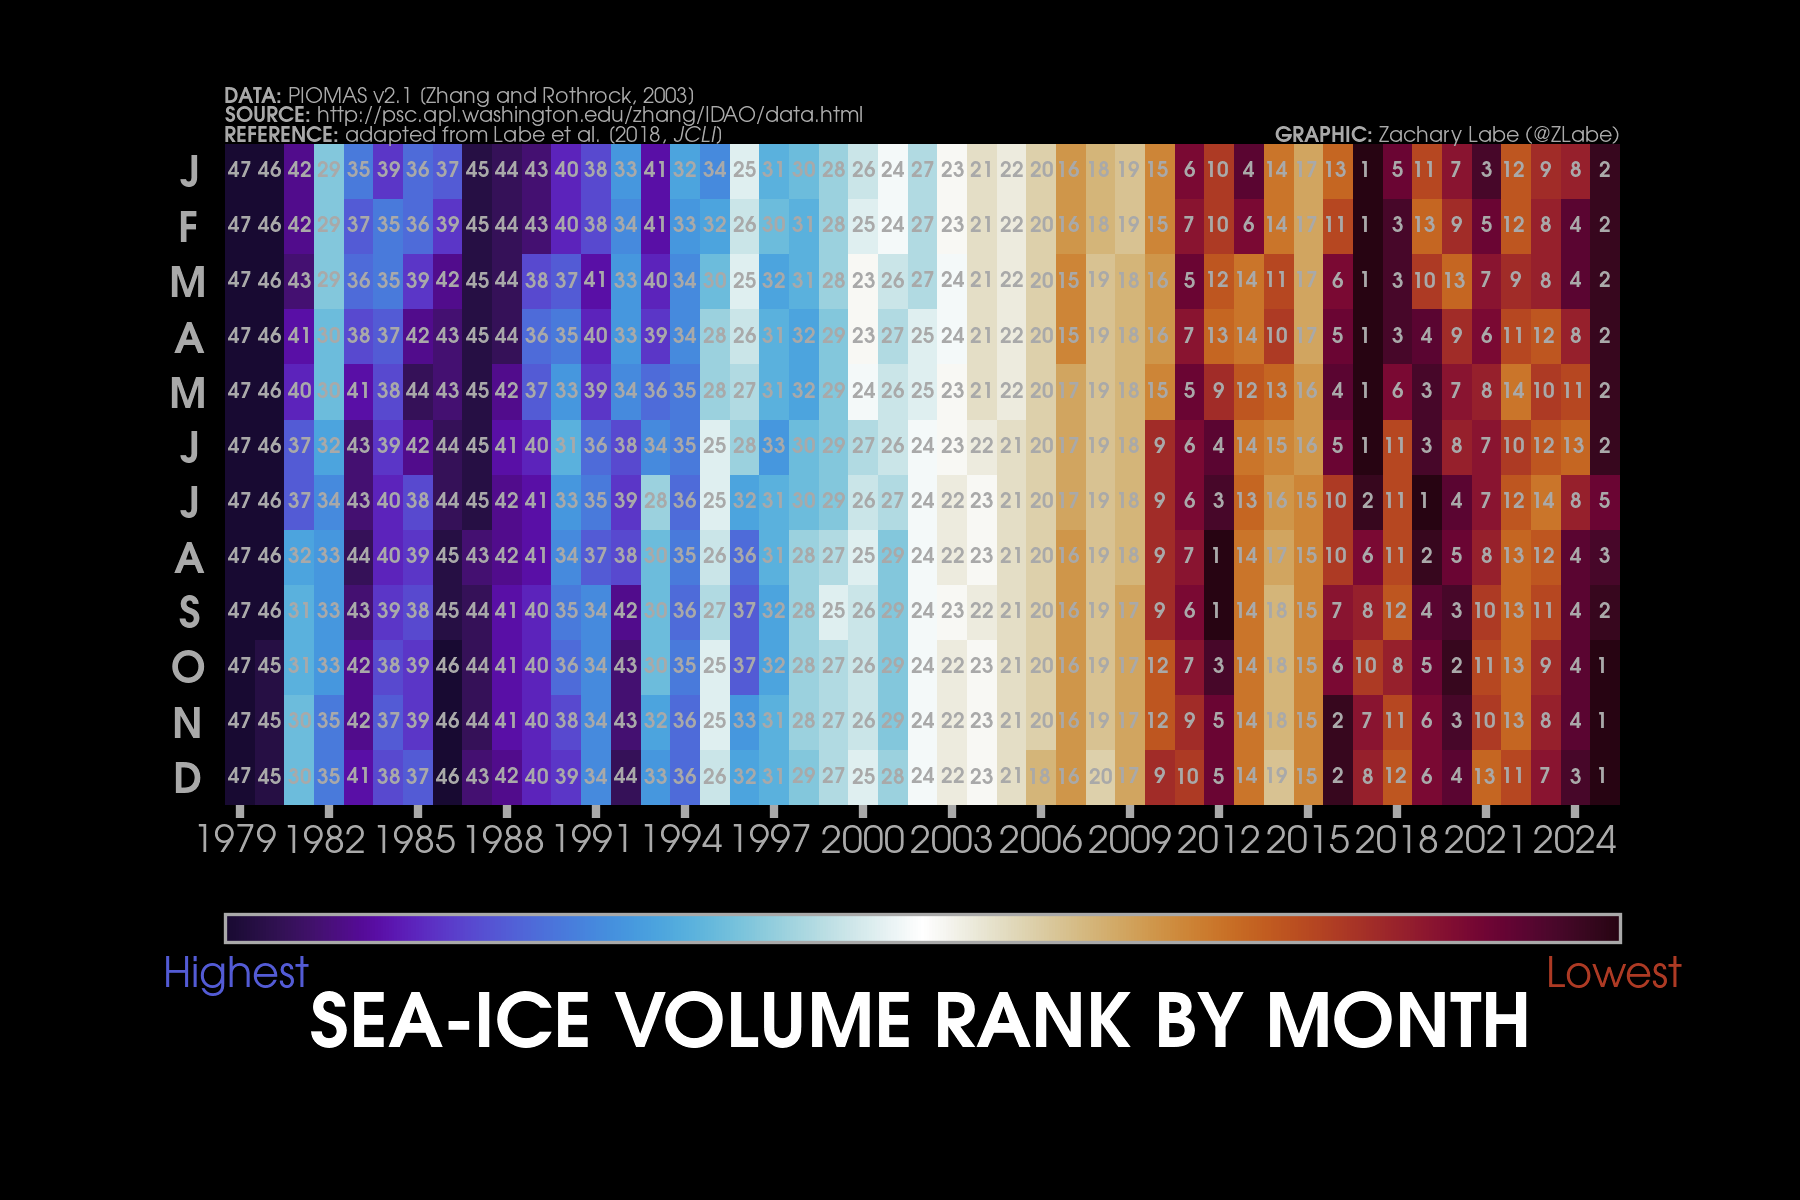
Trends in sea ice thickness/volume are another important indicator of Arctic climate change. While sea ice thickness observations are sparse, here we utilize the ocean and sea ice model, PIOMAS (Zhang and Rothrock, 2003), to visualize February sea ice thickness and volume from 1979 to 2026. Updated for February 2026.Current simulated (PIOMAS; Zhang and Rothrock, 2003) sea ice thickness and anomalies (1981-2010 baseline) updated for February 2026.Simulated (PIOMAS; Zhang and Rothrock, 2003) sea ice thickness anomalies for each February from 2012 to 2026. Note that anomalies are calculated using a recent baseline of 2010-2025, which is a period of substantial Arctic sea-ice loss.Current one month change in simulated (PIOMAS; Zhang and Rothrock, 2003) sea ice thickness from January 2026 to February 2026. Updated 3/3/2026.Current Arctic sea ice thickness derived from weekly sea ice thickness maps based on CryoSat-2/Sentinel-3/SMOS data fusion (Level 4, Version 3.0; Ricker et al. 2017) and its difference compared to the previous year. This graphic will only be updated during winter months (October-April), which is when satellite estimates of sea ice thickness are available. Updated for March 25-31, 2026.Current Arctic sea ice thickness (interpolated and smoothed field) derived from ICESat-2 (L4 Monthly Gridded Sea Ice Thickness, Version 4; Petty et al. 2025) and its difference compared to the previous year. This graphic will only be updated during winter months (September-April), which is when satellite estimates of sea ice thickness are available. Updated for April 2025. Graphic produced on 1/11/2026.Average sea-ice thickness for each month from January 1979 to February 2026 near the North Pole (averaged north of 85°N latitude). Simulated data is available using PIOMAS v2.1 (Zhang and Rothrock, 2003). Graphic updated on 3/13/2026.Current simulated (PIOMAS; Zhang and Rothrock, 2003) sea ice thickness for every February from 1979 to 2026. Updated 3/3/2026.Latest PIOMAS (model; Zhang and Rothrock, 2003) sea ice volume (SIV) across the Arctic (updated for February 2026).Latest PIOMAS (Zhang and Rothrock, 2003) simulated sea ice volume (SIV) across the Arctic (updated through February 2026).Latest PIOMAS (Zhang and Rothrock, 2003) simulated sea ice thickness (SIT) across the Arctic (updated through February 2026).Time series showing Arctic sea-ice volume for every February from 1901 to 2010 using PIOMAS-20C and from 1979 to 2026 using PIOMAS-v2.1. Thin dashed lines using a lowess smoothing fit are shown for each ice-ocean reanalysis dataset. Graphic updated 3/5/2026.Trends in sea ice thickness are another important indicator of Arctic climate change. While sea ice thickness observations are sparse, here we utilize the ocean and sea ice model, PIOMAS (Zhang and Rothrock, 2003), to visualize mean monthly sea ice thickness from 1979 to 2026. Updated through February 2026.Mean Arctic sea-ice thickness for each month from January 2011 to December 2024 from CryoSat-2 (ESA CCI Climate Data Record (CDRv2), ESA CCI Interim Climate Data Record (ICDRv3)). Satellite-derived observations of sea-ice thickness are not available during the melt season. Figure itself was updated April 2025.Trends in sea ice thickness/volume are another important indicator of Arctic climate change. While sea ice thickness observations are sparse, here we utilize the ocean and sea ice model, PIOMAS (Zhang and Rothrock, 2003), to visualize February sea ice thickness from 1979 to 2026. Sea ice less than 1.5 meters is masked out (black) to emphasize the loss of thicker, older ice. Updated through February 2026.Daily Arctic sea ice volume anomalies stretching from 1 February 1979 to 28 February 2026 (PIOMAS; Zhang and Rothrock, 2003). Anomalies are calculated from a climatological baseline of 1981-2010 (updated 3/5/2026).Changes in the annual maximum and minimum of daily Arctic sea-ice volume simulated from PIOMAS (Zhang and Rothrock, 2003). Trends are calculated using a linear least squares fit for the white dashed lines between 1979 and 2025. Graphic updated 12/6/2025.Daily Arctic sea ice thickness (PIOMASv2.1; Zhang and Rothrock, 2003) from 1 January 1979 through 31 December 2025.Daily Arctic sea ice thickness anomalies (PIOMASv2.1; Zhang and Rothrock, 2003) from 1 January 1979 through 31 December 2025. Anomalies are calculated from an averaged 1981-2010 baseline.Daily Arctic sea ice thickness anomalies (PIOMASv2.1; Zhang and Rothrock, 2003) from 1 January 1979 through 31 December 2025. Data are standardized using a 1979-2025 baseline.Arctic sea ice volume rankings (1 = lowest, 47 = highest) from the Pan-Arctic Ice Ocean Modeling and Assimilation System (PIOMAS v2.1, Zhang and Rothrock, 2003). Figured updated through December 2025. Graphic is modified from Labe et al. [2018]. Graphic updated on 1/6/2026.
[3] Eayrs, C. and Z.M. Labe (2025). The future of sea ice. Comprehensive Cryospheric Science and Environmental Change, DOI:10.1016/B978-0-323-85242-5.00050-6 [HTML][BibTeX]
[2]Labe, Z.M., Y. Peings, and G. Magnusdottir (2018), Contributions of ice thickness to the atmospheric response from projected Arctic sea ice loss, Geophysical Research Letters, DOI:10.1029/2018GL078158 [HTML][BibTeX] [Plain Language Summary][Arctic Today]
[1]Labe, Z.M., G. Magnusdottir, and H.S. Stern (2018), Variability of Arctic sea ice thickness using PIOMAS and the CESM Large Ensemble, Journal of Climate, DOI:10.1175/JCLI-D-17-0436.1 [HTML][BibTeX][Code] [Plain Language Summary]
All of the Python code used to generate these figures are available from my GitHub account. Most scripts use data sets that are generated via ftp retrieval.
*These figures may be freely distributed (with credit). Information about the data can be found on my references page and methods page.